Printed version ISSN 0001-3765 / Online version ISSN 1678-2690 http://dx.doi.org/10.1590/0001-3765201620140553
www.scielo.br/aabc
Radiation dose determines the method for quanti
fi
cation of DNA double strand breaks
TANJA BULAT1
, OTILIJA KETA1
, LELA KORIĆANAC1
, JELENA ŽAKULA1 , IVAN PETROVIĆ1
, ALEKSANDRA RISTIĆ-FIRA1
and DANIJELA TODOROVIĆ2
1
University of Belgrade, Vinča Institute of Nuclear Sciences, P.O. Box 522, Belgrade 11001, Serbia
2
University of Kragujevac, Faculty of Medical Sciences, Svetozara Markovića 69, Kragujevac 34000, Serbia
Manuscript received on October 17, 2014; accepted for publication on February 4, 2015
ABSTRACT
Ionizing radiation induces DNA double strand breaks (DSBs) that trigger phosphorylation of the histone protein H2AX (γH2AX). Immunofl uorescent staining visualizes formation of γH2AX foci, allowing their quantifi cation. This method, as opposed to Western blot assay and Flow cytometry, provides more accurate analysis, by showing exact position and intensity of fl uorescent signal in each single cell. In practice there are problems in quantifi cation of γH2AX. This paper is based on two issues: the determination of which technique should be applied concerning the radiation dose, and how to analyze fl uorescent microscopy images obtained by different microscopes. HTB140 melanoma cells were exposed to γ-rays, in the dose range from 1 to 16 Gy. Radiation effects on the DNA level were analyzed at different time intervals after irradiation by Western blot analysis and immunofl uorescence microscopy. Immunochemically stained cells were visualized with two types of microscopes: AxioVision (Zeiss, Germany) microscope, comprising an ApoTome software, and AxioImagerA1 microscope (Zeiss, Germany). Obtained results show that the level of γH2AX is time and dose dependent. Immunofl uorescence microscopy provided better detection of DSBs for lower irradiation doses, while Western blot analysis was more reliable for higher irradiation doses. AxioVision microscope containing ApoTome software was more suitable for the detection of γH2AX foci.
Key words: ApoTome software, AxioImagerA1 microscope, immunofluorescence microscopy, Western blot , γH2AX.
Correspondence to: Danijela Todorović E-mail: [email protected]
INTRODUCTION
The most important direct damages induced by ionizing radiation (IR) are DNA double strand breaks (DSBs). As a consequence of DSBs the histone H2AX becomes phosphorylated (Mischo
et al. 2005). Phosphorylated H2AX (γH2AX) foci appear at the damage sites and their number is considered as one to one DNA DSB (Schmid et al.
2012). The level of γH2AX has been used in in vitro
studies as a tool for the estimation of cellular radio-sensitivity and as a biomarker for individual studies in patient trials to measure DNA damage following radiotherapy and/or chemotherapy (Qvarnström et al. 2004).
In practice, the obtained results may be dif-ferent when various detection systems are used (Ivar et al. 2010). Effects of cancer therapeutics are often analyzed by immunocytochemistry (ICC),
in order to profile the activity of cell signaling proteins. However, the relative sensitivity and specificity of these methods has not yet been established (Lorincz and Nusser 2008). All of the above techniques are based on the particular chemical interaction with specifi c antibody. Fluo-rescence microscopy is frequently used in cell biology because of its sensitivity and the ability to stain and visualize specific parts of the cell, while the light microscopy is not suitable for the detection of weakly stained cellular particles (Fritschy and Härtig 2001). In fluorescence microscopy, there is no background light and the
fl uorescently stained object is being contrasted to a black background. Fluorescent molecules absorb the light of one particular wavelength that produces excitation of electrons, thus emitting the light of another but higher wavelength (Radek et al. 2014). The fl uorescence microscope takes advantage of this difference, fi ltering out the excitation light. Consequently, only the emitted light is seen (Petty 2007). Immunofluoresence microscopy can be used in several microscope designs for the analysis of immunofl uorescence samples. The simplest is the epifluorescence microscope, while confocal microscope is widely used. Moreover, there are powerful super resolution microscopes capable of detecting of nanostructures.
One of the crucial steps in the preparation of samples for immunofl uorescence microscopy is fixation. The goal of fixation is to maintain cellular structure as close as possible to the native state (Bancroft and Gamble 2008). Once fi xed, it is possible to carry on with the procedure without losing the proteins of interest and the rest of the cell. There are various fi xation methods suitable for immunocytochemistry. Fixation can damage or mask antigenic sites, thereby compromising the intensity of immunostaining (Carson and Hladik 2009). Therefore, the choice of fi xative and fi xation protocol may depend on the additional processing steps and biological endpoints.
Flow cytometry is the method which can rapidly detect presence or absence of the protein of interest in the large cell population. Moreover, multi-parameter analysis of the cytometric data makes it possible to correlate them with other attributes of the cells, such as the cell cycle distribution (MacPhail et al. 2003, Yoshida et al. 2003, Huang et al. 2004, Huang and Darzynkiewicz 2006).However,during sample preparation one of the requirements is serial centrifugation. This can cause important cell loss, thus reducing the quantity of sample. Based on that, it is advisable to compare data obtained by this method with results obtained by other assays.
Despite its overall simplicity, Western blot has been proven to be a powerful procedure for immunodetection of proteins, especially those that are of low concentration (Geilfus et al. 2010). This procedure is used in combination with other important antibody-based methods such as immunocytochemistry to provide confirmation of the results both in research and diagnostic trials. Specificity of antibodies used for ICC is of crucial importance and therefore Western blot is essential to address antibodies specifi city (Kurien et al. 2011). Literature data suggest that all mentioned methods have limitations in sensitivity but they do enable consistent characterization of protein phosphorylation and activation of specifi c pathways.
compared. The aim was to analyze which method is more suitable for the detection of γH2AX in samples irradiated under the above mentioned conditions. Moreover, data obtained by two types of microscopes: AxioVision microscope comprising an ApoTome software and AxioImagerA1 microscope were compared in order to analyze infl uence of microscope performances on the result.
MATERIALS AND METHODS
CELL CULTURE
Human HTB140 melanoma cells were obtained from the American Tissue Culture Collection (ATCC, Rockville, MD, USA) and cultured in the RPMI 1640 cell culture medium supplemented with 10% fetal bovine serum (FBS, Sigma-Aldrich Chemie GmbH, Steinheim, Germany) and penicillin/streptomycin (Sigma-Aldrich Chemie GmbH), in a humidifi ed atmosphere of 5% CO2 at 37 °C (Heraeus, Hanau, Germany).
IRRADIATION CONDITIONS
Exponentially growing HTB140 cells were irradiated with γ-rays using 60Co source at the Vinča Institute of Nuclear Sciences in Belgrade, Serbia. Applied doses ranged from 1 to 16 Gy, at the average dose rate ~ 1 Gy/min. Irradiations of cells were carried out in air at ~ 0 °C.
WESTERN BLOT ANALYSIS
Total proteins for the Western blot analysis were extracted from the HTB140 cells 30 min, 2, 6 and 24 h after irradiation. Cells were collected, washed with PBS and homogenized with buffer containing 150 mM NaCl, 50 mM Tris-HCl (pH 8.0), 1% Nonidet P-40 (NP-40), 0.1% sodium dodecyl sulfate (SDS), 0.5% sodium-deoxycholate, 1 mM ethylenediaminetetraacetic acid (EDTA), 1 mM glycol ether diamine tetraacetic acid (EGTA), 1 mM dithiothreitol (DTT), 1 mM Na3VO4, 5 μg/ mL aprotinin, 5 μg/mL antipain, 5 μg/mL leupeptin,
0.5 mM phenylmethanesulphonylfl uoride (PMSF), NaF, β-diglicophosphate and sodium-pirophos-phate. The lysate was centrifuged at 1700 g for 20 min at 4 °C. In the supernatant containing the whole-cell lysate the amount of proteins was quantifi ed spectrophotometrically (Lowry et al. 1951). The samples were mixed with denaturizing buffer according to Laemmli and boiled for 5 min (Laemmli 1970). For the analysis of γH2AX, 60 μg of proteins were loaded onto a 12% SDS-PAGE. Membranes were blocked with 5% Bovine Serum Albumin (BSA) in PBS for 1 h at room temperature and then incubated at 4 ºC overnight with 1:1000 dilution of the primary anti-γH2AX antibody (BioLegend, San Diego, USA) in PBS Tween 20 (PBST)/BSA. For normalization purposes, immunoblots were incubated overnight at 4 ºC with rabbit polyclonal anti-β-actin antibody (Sigma-Aldrich Chemie GmbH) diluted 1:1000 in PBST/non-fat dry milk. After three washings in PBST, lasting 10 min each, the membranes were incubated with horseradish peroxidase-conjugated anti-mouse antibody (HRP, Cell Signaling Technology, Inc. Danvers, MA) diluted 1:5000 in PBST/BSA. Following three washings with PBST, the proteins were visualized with an enhanced chemiluminescence (Sigma-Aldrich Chemie GmbH) and exposed to X-ray fi lm. Protein molecular mass standards (PageRuler Plus Prestained Protein Ladder, Fermentas, Vilnius, Lithuania) were used for calibration. Densitometry of protein bands on X-ray fi lm was performed using ImageJ Analysis software.
IMMUNOFLUORESCENCE MICROSCOPY
fi ve washings in PBST, lasting 3 min each, cells were counterstained with Dapi-antifade solution (Sigma-Aldrich Chemie GmbH). The visualization of cells was done using two microscopes: AxioVision (Carl Zeiss) comprising ApoTome software and AxioImager A1 (Carl Zeiss) with a 100 x objective. All images were captured using AxioVision software. Before the observation of foci, digital images were processed with ImageJ to adjust brightness and contrast.
AUTOMATED DIGITAL IMAGE ANALYSIS
CellProfi ler (www.cellprofi ler.org) is an open source software that is used for a custom and automated approach to image analysis workfl ow (Kamentsky et al. 2011). This software enables objective and quantitative fl uorescence microscopy, based on user-defi ned thresholds for brightness, size, shape and other parameters (Carpenter et al. 2006). The image was converted from color (Aleksa Flour 488 - green, DAPI - blue) to monochrome. Foci were identifi ed with objects area which range from 6-30 pixels, while others were discarded. Data were exported to Excel for further analysis. Automated segmentation of foci was visually compared against manually counted foci. Relative fl uorescence was measured as described previously (Burgess et al. 2010).
STATISTICAL ANALYSES
Duplicate measurements were made during each experiment and all experiments were repeated at least three times. For immunofluorescence microscopy and Western blot analysis results were presented as the mean ± SEM (Standard Error of the Mean).
RESULTS
In order to follow the formation of γH2AX foci, the HTB140 melanoma cell monolayers were irradiated with γ-rays. Applied dose range was from 1 to 16 Gy. Cells were maintained under standard
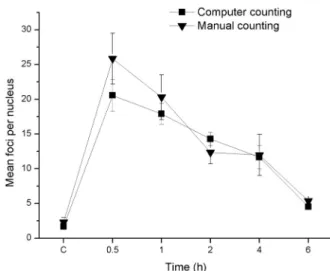
conditions from 30 min to 6 h after irradiation. The dose- and time- depended phosphorylation of H2AX was followed for all time points and doses. The samples were visualized and then subjected to the automated digital image analysis with CellProfi ler software. Software parameters were optimized according to the properties of the cell line (size and shape of nuclei), size and shape of foci, characteristics of micrographs, etc. (Carpenter et al. 2006). In order to optimize software parameters, manual counting of γH2AX foci in sample irradiated with 2 Gy was used as the control measurement for computer counting. All time points were taken into consideration. Data obtained by both ways of counting are shown in Figure 1.
Figure 1 - Mean number of γH2AX foci per HTB140 cell nucleus, counted by computer software (full square) or manually (full triangle), as a function of time elapsed after irradiation with 2 Gy γ-rays (C-control). Data obtained from 3 experiments are presented asmean ± SEM.
Dynamic of the DNA reparation in cells irradiated with 2 Gy γ-rays were analyzed by immunoflourescence microscopy using the two microscopes. The maximal number of γH2AX Figure 2 - Mean numberof γH2AX foci per HTB140 cell
nucleus as a function of dose, 30 min after irradiation with
γ-rays, measured by two types of microscopes: AxioVision comprising ApoTome software and AxioImager A1 (C-control). Data obtained from 3 experiments are presented asmean ± SEM.
doses of 12 and 16 Gy. For these two doses values obtained by AxioImager A1 microscope were low, thus are not given in the fi gure.
It has been noticed that higher radiation doses have weaker effects on DNA, as observed through the number of foci per nucleus. In order to perform further analysis of the results, the relative fluorescence was measured for threshold doses. According to the results presented in Figure 2, threshold doses are 12 and 8 Gy for AxioVision containing ApoTome software and AxioImager A1, respectively. From the results presented in Figure 3, representing relative fluorescence that was evaluated for threshold doses, it can be seen that 12 and 8 Gy have present the expected higher effect on the formation of the DSBs than 1 Gy of γ-rays.
For the Western blot analysis the cells were incubated for 30 min to 24 h after irradiation. The increase of the γH2AX started 30 min after irradiation and was detected throughout of doses applied (Fig. 4). The acquired data for other post irradiation incubation times exhibited similar dose dependence (data not presented).
Figure 3 - Relative fluorescence, given as percentage of control, estimated with the microscopes AxioImager A1 and AxioVision comprising ApoTome software for the dose of 1 Gy each and the threshold doses of 8 Gy and 12 Gy, respectively. Data obtained from 3 experiments are presented as mean ± SEM.
foci was attained 30 min after irradiation (Fig. 5). Again, the results obtained from AxioImager A1 resulted in lower values.
Nevertheless, for the same dose (2 Gy) Western blot analysis did not show time dependence of γH2AX formation (appearance / disappearance). In the samples irradiated with 12 Gy the highest induction of γH2AX was reached 2 h after irradiation, while it was signifi cantly reduced 6 h post- irradiation (Fig. 6).
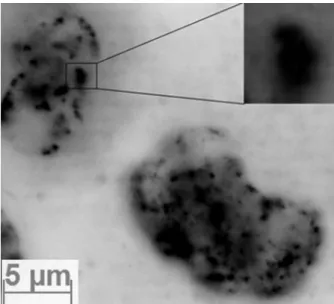
In order to investigate the unexpected weak effect for higher doses (12 and 16 Gy, Fig. 2), despite high immunofl uorescence (Fig. 3), further analyses of images were performed. Among analyzed micrographs the one that was chosen is shown in Figure 7, presenting the sample irradiated with 12 Gy γ-rays. Lots of overlapping signals are most likely the reason of underestimation of the results presented in Figure 2.
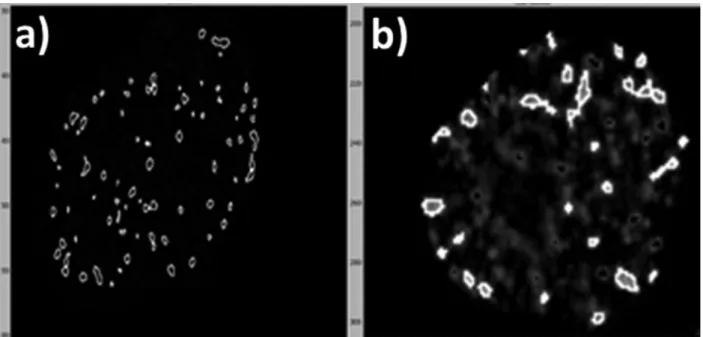
CellProfiler software outlines foci and provides data that characterize each of them. The outlined γH2AX foci in the HTB140 cell sample irradiated with 2 Gy γ-rays obtained by AxioVision
having ApoTome software (a) and AxioImager A1 (b) microscopes, shown in Figure 8. Due to the features of ApoTome software the real number of foci per nucleus was acquired and is presented in Figure 8a. However, on the micrograph obtained by AxioImager A1 presented in Figure 8b, only the foci that are in the focused object plane were recorded, while the others were detected as blurred structures.
Figure 5 - Kinetics of appearance and disappearance of γH2AX foci (time dependent mean number of foci) per HTB140 cell nucleus after irradiation with 2 Gy γ-rays (C-control). Quantifi cation was performed with the microscopes AxioVision comprising ApoTome software and AxioImager A1. Data obtained from 3 experiments are presented as mean ± SEM.
Figure 6 - Time dependent phosphorylation and dephospho-rylation of H2AX protein in HTB140 cells, given as percentage of control and analyzed by Western blot, after irradiation with 2 and 12 Gy γ-rays (C-control). Data obtained from 3 experiments are presented as mean ± SEM.
DISCUSSION
The detection of γH2AX foci that refl ect dynamics of the DNA DSB repair was analyzed after irradiation with low and high doses of γ-rays. The human HTB140 melanoma cells were used as a model system. Experimental conditions and data analyses were optimized according to the methods that were used.
Immunofl uorescence microscopy enabled in situ visualization of each DNA DSB separately, as well as the distribution of breaks inside the nucleus of a single cell (Hu et al. 2005). Before counting, CellProfiler image analysis software was optimized. The software establishes whether the object that is analyzed is an individual one or if there are two or more clumped ones. This is a very important initial parameter which determines appropriate module by recognizing primary (nuclei) and secondary objects (foci). Most options within the module use this estimation of the size range of the objects in order to distinguish them from the noise in the image. Since pixels are used as units in CellProfiler, it is easy to zoom in on objects
and determine typical diameters (Carpenter et al. 2006). When the software parameters are correctly set the results obtained by software and by manual counting of foci are compatible (Fig. 1).
During capture of images for the analysis with AxioImager A1 microscope each image consists of signal contributions coming from the focused object plane. However it also includes contributions coming from the structures located above and below it. The blurred structures from above or below are either recognized to be out of focus or, if they are clearly outside the focal plane, they give the effect of brightening the image background (Ju et al. 2009). With the AxioVision comprising ApoTome software, a grid structure is inserted into the light
fi eld diaphragm plane of the refl ected-light beam path. Advantage of this system, as compared to AxioImager A1, is its possibility to precisely make an image of the object plane. This is done by a high precision scanning mechanism that moves the grid pattern in defi ned steps across the sample plane. The result is a precise optical section through the specimen with no blurring and with high contrast (Conchello and Lichtman 2005).
Different performances of the microscopes explains some discrepancy in the number of foci detected with AxioVision having ApoTome software and AxioImager A1, presented in Figures 2 and 5. For higher doses, clumped objects that are shown in Figure 7 most probably cause underestimation of the number of foci. This can be misinterpreted as a weaker effect of irradiation. Image analyses through relative fl uorescence (Fig. 3) indicate the need for parallel analysis on at least two different approaches for the same method, in this case for ICC. In combination with Western blot analysis, ICC confi rms the assumption that results for higher doses presented in Figure 2 are underestimated, thus the doses of 8 and 12 Gy have stronger effects on the DNA level than the dose of 1 Gy of γ rays.
For analyzed cell system AxioVision with ApoTome software and AxioImager A1 are valid for up to 8 and 6 Gy, respectively. Differences in counting of foci by the two microscopes are illustrated in Figure 8 where the outlined γH2AX foci correspond to the previously defi ned parameters in CellProfi ler. In images captured with the AxioVision with ApoTome software there is negligible number of discarded γH2AX foci, due to the ability of this software to make precise optical sections, thus giving higher number of foci per nucleus.
Quantifi cation of phosphorylation of H2AX protein as a function of dose is also possible by Western blot analysis (Fig. 4), using actin for normalization purpose (Gaba et al. 2010). However, the analysis could not be fully attained with this method when using lower radiation doses at different post-irradiation incubation times (Fig. 6). In the Western blot assay, the protein to be quantifi ed is coming from a large number of cells. Therefore, this method is not appropriate to provide the precise information about the level of γH2AX per single cell. On the other hand, since the irradiation with doses of 1 or 2 Gy caused lower
level of phosphorylation of H2AX, the intensity of corresponding bands obtained by the Western blot do not follow the real changes in the γH2AX kinetic (Fig. 6). Yet, the Western blot analysis was very useful for the analysis of phosphorylation of H2AX after irradiation with higher doses when the overlapping of signals disabled reliable quantification using immunofluorescence microscopy. Moreover, Western blot is a favorable method when following different cellular pathways triggered by radiation or other treatments (Wang et al. 2013).
In summary, since γH2AX is considered to be a sensitive indicator of DNA DSBs, the development of different γH2AX focus formation assays and the corresponding data analyses are of great experimental and even clinical importance. The described experimental techniques are becoming powerful tools for further studies of the cellular response to DNA damage. The combined use of ICC and Western blot analysis with respect to the dose level and other properties of a toxic agent, provide data about cellular processes important for the maintenance of genome stability.
ACKNOWLEDGMENTS
This work was supported by the Ministry of Education, Science and Technological Development of Serbia (grants 173046 and 171019).
RESUMO
A radiação ionizante induz a rupturas dos fi lamentos duplos (DSBs) do DNA que ativam a fosforilação da proteína histona H2AX (γH2AX). A coloração por imunofl uorescência visualiza a formação de focos de
técnica deve ser aplicada, relativa à dose de radiação, e como analisar imagens de microscopia fl uorescente obtidas por diferentes microscópios. Células de melanoma HTB140 foram expostas a raios-y, com doses na faixa de 1 a 16 Gy. Efeitos das radiações a nível de DNA foram avaliadas em diferentes intervalos de tempo e após a irradiação analisada por Western blot e pela microscopia de imunofl uorescência. Células coradas imunoquimicamente foram visualizadas por dois tipos de microscópios: microscópio AxioVision (Zeiss, Alemanha), que compreendem com software ApoTome, e o microscópio AxioImagerA1 (Zeiss, Alemanha). Os resultados obtidos mostram que o nível de γH2AX é tempo e dose dependente. Microscopia de imunofl uorescência forneceu uma melhor detecção de DSBs para doses de radiações mais baixas, enquanto a análise Western blot foi mais confi ável para doses de radiações mais elevadas. Microscópio AxioVision contendo o software ApoTome foi mais adequado para a detecção de focos γH2AX.
Palavras-chave: software ApoTome, microscópio Axio-ImagerA1, microscopia de imunofl uorescência, Western blot, γH2AX.
REFERENCES
BANCROFT JD AND GAMBLE M. 2008. Theory and Practice of Histological Techniques. 6th
ed., Elsevier Health, 744 p. BURGESS A, VIGNERON S, BRIOUDES E, LABBÉ JC, LORCA T
AND CASTRO A. 2010. Loss of human Greatwall results in G2 arrest and multiple mitotic defects due to deregulation of the cyclin B-Cdc2/PP2A balance. Proc Natl Acad Sci USA 107: 12564-12569.
CARPENTER AE ETAL. 2006. CellProfiler: image analysis software for identifying and quantifying cell phenotypes. Genome Biol 7(10): R100.
CARSON FL AND HLADIK C. 2009. Histotechnology: A Self-Instructional Text. 3rd
ed., American Society for Clinical Pathology, 400 p.
CONCHELLO JA AND LICHTMAN JW. 2005. Optical sectioning microscopy. Nat Methods 2: 920-931.
FRITSCHY JM AND HÄRTIG W. 2001. Immunofluorescence. eLS.
GABA VL, SHERMAN MY AND YAGLOM JA. 2010. HSP72 depletion suppresses γH2AX activation by genotoxic stresses via p53/p21 signaling. Oncogene 29: 1952-1962. GEILFUS CM, MUHLING KH AND ZORB C. 2010. A methodical
approach for improving the reliability of quantifiable two-dimensional Western blots. J Immunol Methods 362: 89-94.
HU B, HAN W, WU L, FENG H, LIU XQ, ZHANG Y, XU A, HEI TK AND YU Z. 2005. In situ visualization of DSBs to assess the extranuclear/extracellular effects induced by low-dose alpha-particle irradiation. Radiat Res 164: 286-291.
HUANG X AND DARZYNKIEWICZ Z. 2006. Cytometric
Assessment of Histone H2AX Phosphorylation A Reporter of DNA Damage. Methods Mol Biol 314: 73-80.
HUANG X, OKAFUJI M, TRAGANOS F, LUTHER E, HOLDEN
E AND DARZYNKIEWICZ Z. 2004. Assessment of histone H2AX phosphorylation induced by DNA topoisomerase I and II inhibitors topotecan and mitoxantrone and by the DNA cross-linking agent cisplatin. Cytometry A 58A: 99-110.
IVAR S, MARIT N, EINAR G, JAN K, KJELL K, EMIEL J
AND JAN B. 2010 Evaluation of 5 different labeled polymer immunohistochemical detection systems. Appl Immunohistochem Mol Morph 18: 90-96.
JU L, WEI M, JOSÉ-ANGEL C, SUNNEY XX AND JEFF LW. 2009. Super-resolution laser scanning microscopy through spatiotemporal modulation. Nano Lett 9: 3883-3889. KAMENTSKY L, JONES TR, FRASER A, BRAY MA, LOGAN DJ,
MADDEN KL, LJOSA V, RUEDEN C, ELICEIRI KW AND
CARPENTER AE. 2011. Improved structure, function and compatibility for CellProfiler: modular high-throughput image analysis software. Bioinformatics 27: 1179-1180. KURIEN BT, DORRI Y, DILLON S, DSOUZA A AND SCOFIELD
RH. 2011. An overview of Western blotting for determining antibody specificities for immunohistochemistry. Methods Mol Biol 717: 55-67.
LAEMMLI UK. 1970. Cleavage of structural proteins during the assembly of the head of bacteriophage T4. Nature 227: 680-685.
LORINCZ A AND NUSSER Z. 2008. Specificity of immuno-reactions the importance of testing specificity in each method. J Neurosci 28: 9083-9086.
LOWRY OH, ROSEBROUGH NJ, FARR AL AND RANDALL RJ. 1951. Protein measurement with the folin phenol reagent. J Biol Chem 193: 265-275.
MACPHAIL SH, BANÁTH JP, YU TY, CHU EH, LAMBUR
H AND OLIVE PL. 2003. Expression of phosphorylated histone H2AX in cultured cell lines following exposure to X-rays. Int J Radiat Biol 79: 351-358.
MISCHO HE, HEMMERICH P, GROSSE F AND ZHANG S. 2005. Actinomycin D induces histone gamma-H2AX foci and complex formation of gamma-H2AX with Ku70 and nuclear DNA helicase. J Biol Chem 280: 9586-9594. PETTY HR. 2007. Fluorescence microscopy: established
and emerging methods, experimental strategies, and applications in immunology. Microsc Res Tech 70: 687-709.
QVARNSTRÖM OF, SIMONSSON M, JOHANSSON KA, NYMAN
RADEK M, PETER K AND MARTIN H. 2014. Statistical filtering in fluorescence microscopy and fluorescence correlation spectroscopy. Anal Bioanal Chem 406: 4797-4813. SCHMID TE, ZLOBINSKAYA O AND MULTHOFF G. 2012.
Differences in Phosphorylated Histone H2AX Foci Formation and Removal of Cells Exposed to Low and High Linear Energy Transfer Radiation. Current Genomics 13: 418-425.
WANG L, YUAN C, LV K, XIE S, FU P, LIU X, CHEN Y, QIN
C, DENG W AND HU W. 2013. Lin28 mediates radiation resistance of breast cancer cells via regulation of caspase, H2A.X and Let-7 signaling. PloS One 8: e67373.