A Work Project, presented as part of the requirements for the Award of a Master Degree in Management from the NOVA – School of Business and Economics
HOW TO IMPROVE CUSTOMERS’ CHECKOUT EXPERIENCE IN CONTINENTE STORES?
MARTA MENÉRES DE CARVALHO CAMPOS NR. 2756
A Project carried out on the Master in Management Program, under the supervision of: Professor José Crespo de Carvalho
2 HOW TO IMPROVE CUSTOMERS’ CHECKOUT EXPERIENCE IN CONTINENTE STORES?
Abstract:
This work project studies the checkout experience provided in Continente stores, which is the hypermarket of Sonae MC, the retail market leader in Portugal. Food retailers must have in mind that the long waits at checkout have a negative impact on customer satisfaction and, thus, it is paramount to improve this experience, either by increasing checkout processes efficiency or by enhancing the customer’s perceived quality of the service provided at checkout. This dissertation provides an analysis of the current checkout processes offered in Continente stores, which allows to recommend two improvement opportunities that will, ultimately, provide a better checkout experience.
3 Index
1. Introduction ... 3
2. Literature Review ... 5
2.1 Retailing Customer Experience ... 5
2.2 Queuing Experience and Psychology of Waiting Lines ... 6
2.3 Checkout Processes ... 7
3. Methodology ... 8
4. Results and Discussion ... 9
4.1 Processes’ Flowcharts... 9 4.2 Work Measurement ... 12 4.3 Focus Group ... 13 4.4 Performance Evaluation ... 14 4.5 Process Re-Design ... 14 5. Conclusion ... 22 6. References ... 24 7. Appendices ... 26 1. Introduction
This work project focuses on the analysis of the checkout processes available in Continente stores and it was developed in collaboration with Sonae MC, a sub-holding of Sonae SGPS. Sonae is a multinational company managing a diversified business portfolio in retail, telecommunications, financial services and shopping centers. Sonae MC is the grocery retail market leader in Portugal and it offers 4 different models of supermarkets: Continente (hypermarkets), Continente Modelo, Continente Bom Dia (convenience supermarkets) and Meu Super (franchised supermarket). This work project took place at Business Information Technology (BIT) which is the area of
4 information systems that supports Sonae’s businesses. More specifically, this research was developed in a team whose purpose is to work as a partner of the Sonae’s businesses, by seeking innovative solutions that will, ultimately, deliver a better shopping experience.
This study focuses on the improvement of the checkout processes since these comprehend a critical part of the customer journey. As a matter of fact, checkout is the most stressful and frustrating stage of the shopping experience: customers need to wait in order to pay for their merchandise when they just want to leave the store as fast as they can. Moreover, it is the last customer-employee interaction in the supermarket, and hence the quality of the service provided at this point will strongly influence the customer’s perceived quality of the service provider. Therefore, food retailers must deliver a great checkout experience since it will impact customer satisfaction and customer loyalty and, ultimately, the retailer’s revenues and profits. Thereupon, the main goal of this research is to find ways of increasing the efficiency of checkout processes in Continente stores while also enhancing the customer’s perceived quality of the service provided at checkout in order to deliver a great experience to the customer.
This research will analyze the three checkout options offered in Continente stores: the Traditional Cashiers (TC), which is offered both in single-server and multi-server queuing models, and two alternative self-technology based services, Self-Checkout (SCO) and Self-Scanning (SS).
The remainder of this report is structured as follows. In the beginning, a brief literature review will be exposed, followed by the presentation of the methodology adopted as well as the methods used to develop this research. Afterwards, the results obtained will be provided and a discussion on the data collected will be presented. The discussion of the results gives place to proposals of improvement opportunities for the company’s checkout processes, where the feasibility and benefits of the solutions are explored. Finally, a research conclusion will not only summarize its main outputs, but also highlight its limitations and opportunities for further research.
5
2. Literature Review
This chapter reviews previous research on three topics that are intrinsically linked to supermarket checkout processes. At first, the food retailers’ need to offer experiences to customers will be explored. Secondly, the main findings on the queuing experience subject will be examined and, lastly, the different checkout options as well as their attributes will be explained.
2.1 Retailing Customer Experience
In the current retailing environment, competition has become fiercer and, therefore, supermarkets are increasingly attempting to differentiate themselves by providing a better shopping experience (Verhoef et al., 2009). This idea is supported by Pine and Gilmore (1998) who argued that goods and services are commoditized and that we are currently moving to the experience economy where experiences are the source of value to customers. LaSalle and Britton (2003) defined an experience as the set of interactions between the customer and the product or service, company or its representatives, which provokes a reaction on the customer. If the provoked reaction is positive, the interaction’s result is the recognition of value. Hence, this experience is extremely personal and it implies the customer involvement, which happens at different levels, including the sensorial, emotional, cognitive, pragmatic, lifestyle and relational (Gentile et. al., 2007). An increasing attention has been put on the irrational components of the experience, since it is argued that these are the most effective ones (Bäckström and Johason, 2006, Gentile et. al., 2007), by engaging the customer in a memorable way (Pine and Gilmore, 1998). The emotional component involves the customer’s affective system and it generates emotions and feelings (Gentile et. al., 2007). Some researchers argue that, among the aspects that influence the customer’s experience, there are retailer’s controlled factors and customer’s controlled factors (Bäckström and Johanson, 2006, Verhoef et. al, 2009). Within the retailer’s non-controlled
6 factors is the customers’ attitude to time and so, if a retailer provides a fast service offering to shoppers that are short on time, it will contribute to a more positive experience.
2.2 Queuing Experience and Psychology of Waiting Lines
Waiting is a negative experience that customers regard as stressful, frustrating, time consuming and annoying (Maister, 1985). The waiting experience has the potential to produce these negative affective reactions on customers that will, ultimately, impact the customer’s evaluation of service (Katz et al., 1991, Maister, 1985, Taylor, 1994, Tom and Lucey, 1997). However, it is an inevitable experience since service providers face fluctuating demand which prevents them from having total control over the lengths of the waiting durations (Taylor, 1995). Nevertheless, managers have to find ways to speed up the service in order to reduce the negative effects that waiting has over the perceived quality of the service provided. Operations Management is a tool that can be used to control service waiting durations, by either adding servers or improving the time it takes to serve each customer (Maister, 1985). On the other hand, managers should also look to Perceptions Management as a tool to reduce the impact of the waiting time on the perceived quality of the service (Katz et al., 1991). Indeed, Tom and Lucey (1997) have shown that the perceived waiting time plays a more important role on customer satisfaction than measured or objective time and, furthermore, customers tend to overestimate waiting durations because this is a passive activity. Therefore, retailers should understand the factors that can influence the negative affective responses to wait and so, the perception of waiting duration, in an attempt to increase the overall service evaluation. Among these factors is the wait attribution: the more the cause of the wait is perceived to be under the service provider’s control, then the more dissatisfied is the customer (Taylor, 1994, Taylor, 1995). In addition, several researchers have found evidence that when waiting time is occupied, negative customer’s reactions will have less impact on customer satisfaction because, while the customer is physically and psychologically
7 engaged in some activity, he/she does not pay so much attention to the passage of time (Larson, 1987, Maister, 1985, Taylor, 1994, Taylor, 1995). Finally, according to Larson (1987), social justice and uncertainty regarding waiting duration also impact the affective responses to wait.
2.3 Checkout Processes
The customer’s shopping trip only finishes after going through the checkout process and customers want it to be as fast as possible. The most time efficient checkout process is the traditional cashier’s checkout since they are well-trained for the job. More recently, the self-service concept started to be offered as a checkout option in supermarkets. They were implemented to increase productivity and to reduce labor costs. On the customer perspective, the main determinants of technology based self-service adoption are speed, reliability, control, ease of use and enjoyment (Dabholkar, 1996, Dabholkar and Bagozzi, 2002, Marzocchi and Zammit, 2006, Weijters et al., 2007). However, these perceived attributes of the checkout option do not determine intentions to use the technology only by themselves. Self-service technologies’ adoption is also influenced by consumer traits such as, among others, the need for interaction with service employees or the inherent novelty seeking (Dabholkar, 1996, Dabholkar and Bagozzi, 2002, Weijters et al., 2007). Finally, and in accordance with the findings of many authors, such as Taylor (1994) and Tom and Lucey (1997), the self-checkout’s perceived waiting duration has a strong influence on the customers’ intentions to use it (Dabholkar, 1996, Dabholkar and Bagozzi, 2002, Weijters et al., 2007). Furthermore, not long ago, another self-technology based service, the self-scanning, started to appear in supermarkets as an alternative checkout option. In this process, customers scan the products’ barcodes while picking items around the store and, when they are ready to checkout, customers are only required to pay for their groceries. According to previous research (Marzocchi and Zammit, 2006), self-scanning eliminates repetitive packaging and unpackaging operations inherent to other checkout processes
8 and, thus, it allows customers to turn the “wasted” time spent at checkout into useful time. For retailers, self-scanning enables them to save labor costs but it increases the risk of theft in their stores. For this reason, they, occasionally, execute service’s audit checks and scan, randomly, a pre-determined number of items from the customer’s shopping cart at checkout.
Concerning the queuing system designs, there are two main types offered in supermarkets: the traditional queuing system with a line per server (single-server model) and the single line queuing system, with a single line for multiple servers (multi-server model). The latter started to appear at supermarket checkout to reduce the customer’s perceived waiting time. Indeed, one of the advantages of the multi-server model is the fact that customers no longer are faced with the guess and uncertainty associated with having to choose among all the cashiers’ lines. Besides, customers have no longer the feeling of having chosen the wrong line because of a slow customer, and so, line envy is eliminated, thus reducing the feeling of social injustice.
3. Methodology
This chapter will focus on presenting the main goals of this study as well as the methodology adopted and, lastly, the methods applied to obtain data.
The aim of this project is to acknowledge how to improve the checkout processes efficiency, how to reduce the customer’s perception of waiting time and how to enhance the quality of the service provided at the several checkout options. The case study approach was the selected methodology when designing this work project, which allows the researcher to focus on a single case, e.g. an organization or a social group, offering the benefit of studying a phenomenon in a concrete context and, thus, making the research doable. (Yin, 2009). Therefore, this approach seemed to be the most appropriate to study the checkout processes in Continente stores. According to Yin (2009), another advantage of this approach is the ability to use multiple sources of evidence which allows triangulation of findings, meaning that the different sources of data corroborate a
9 single finding, turning the conclusions more robust. The sources of evidence adopted in this research were archival records, observation, participant-observation, focus group, and survey, which allowed to collect both quantitative and qualitative data.
This work project aims at proposing recommendations of processes improvements and, therefore, the blueprint for process analysis proposed by Krajewski et al. (2013) was followed. Firstly, as a part of the process documentation step, the processes flowcharts were drawn. Secondly, they were characterized by analyzing the flow times of each element or phase. For this purpose, it was analyzed both data collected in-store and historical data recorded in the information systems. Afterwards, the brainstorming approach was used to collect thoughts from knowledgeable people. Furthermore, the second step of process evaluation was pursued, by measuring Key Performance Indicators (KPIs) metrics. Finally, the processes were re-designed and solutions to improve Continente’s checkout were proposed. To support them, the benchmarking approach was adopted as it offers a way to acknowledge how outstanding companies execute their activities and, thus, to comprehend how one company can improve its own processes. The survey tool was also applied for the sake of evaluating the improvement opportunity’s benefit. Finally, the Cost-Benefit Analysis (CBA) offered a basis to appraise the value of the recommendations for the company.
4. Results and Discussion 4.1 Processes’ Flowcharts
Process mapping is a technique used in improvement activities as it provides a clear understanding of the steps that comprehend each process, while also enabling to identify the problems that may be reducing its efficiency. Hence, the three checkout processes available in Continente stores were observed and mapped as a swim lane flowchart so as to distinguish the different interveners in these processes (Krajewski et al., 2013). The rules followed to draw the processes’ maps can be observed in Appendix I.
10
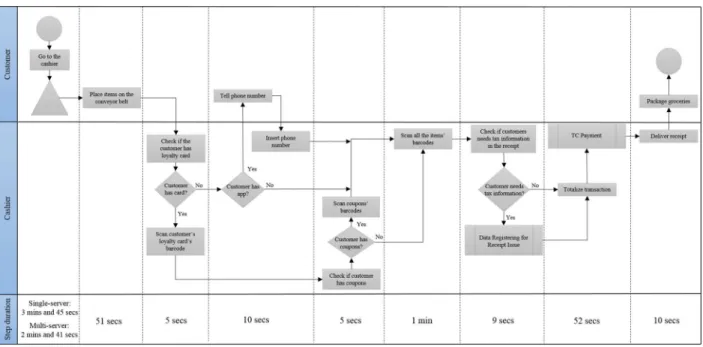
At first, the TC checkout process map was drawn and its flowchart is presented in Figure 3.
Figure 3 - TC Checkout Process Flowchart
In this option, the cashier registers the loyalty card, in case the customer possesses one, after having the groceries placed on the conveyor belt. Secondly, the cashier can register the coupons’ barcodes on the scanner, in case the customer wants. If the customer does not bring the loyalty card but wants to use the Continente’s mobile app, then he/she tells the phone number. This will allow the customer not only to identify the loyalty card, but also to associate any coupons to the purchase, which have been previously selected through this app. The cashier will, then, register all the items placed on the conveyor belt and the customer, at this point, can package all the groceries. Afterwards, the cashier validates if the customer wants tax information in the receipt and, if so, she starts the sub-process of data registering for receipt issue, as showed in Appendix II. Finally, this step is followed by the payment sub-process, explained in Appendix III. In this process, the customer starts to deliver any discount coupons that he/she possesses. After, the cashier will ask if the customer wants to use the balance of the loyalty card and, if so, it will be discounted by the cashier to the total amount to pay. If the card balance is enough to pay the total
11
amount, then this sub-process is finished. If not, the cashier will validate what is the payment method the customer wants to use. In this checkout option, the customer can use all the payment methods, which include the ATM, cash, gift card and bank check methods. The process is finished when the receipt is handed to the customer.
The TC checkout process is available in Continente stores through two different queuing systems: the single-server and multi-server designs, as it can be observed in Appendix IV.
In the second place, the SCO option, whose process map is shown in Appendix V, is offered to customers with a basket size with less than 15 items. In this process, the customer is able to checkout almost independently from the supervisor’s interventions, whose function is to help customers during the process. The customer starts the process by scanning all the items’ barcodes as well as the loyalty card and coupons in the self-service machine. Afterwards, the payment sub-process starts, whose flowchart is presented in Appendix VI. As it can be observed, the customer can also pay autonomously, except for the gift card and bank check payment methods.
In the SCO, customers form two different lines, as it is presented in Appendix VII, to wait for a free self-service machine: one for 2 payment towers that accept all payment methods and another for 4 cashless payment towers.
Finally, the SS process was also mapped and its flowchart can be observed in Appendix VIII. In
this checkout service, the customer heads to the check-in area before starting the shopping trip, where the loyalty card’s barcode can be scanned in order to remove one of the scanner devices. Then, the customer starts to browse around the store, scanning the barcode of every item that is put in the shopping cart. Afterwards, in the checkout area, the customer is able to register the coupons and pay for the groceries autonomously. The payment sub-process was mapped and its flowchart is available in Appendix IX. If the system requires a random check, the supervisor, who is available to help with any issues during the process, will register 5 or more items of the
12
customer’s shopping cart before the payment stage. If any inconsistency is identified, a full verification will be performed. To finish the process, the customer scans the receipt’s barcode in a scanner that opens the gate of the SS checkout area, as a guarantee that the customer has paid. 4.2 Work Measurement
After understanding the activities that encompass each one of the checkout processes, one should estimate the average time that each step takes to be executed (Krajewski et al., 2013).
Therefore, the time spent on each element of the processes was recorded in-store with a stopwatch in 75 transactions. From the analysis of the empirical data collected, it is clear that payment times merely change across checkout options but they vary significantly between payment methods, as it can be concluded from Appendix X.
Secondly, historical data on the average processing times was also analyzed. From this analysis, the following was concluded: cashiers take, on average, 52 seconds to perform the payment step, whereas customers take 51 seconds, on average. Furthermore, it is also clear that the scanning time of the TC and SCO processes, meaning the time until the transaction is totalized and the payment process begins, varies positively with the basket size, as shown in the scatter plot presented in Appendix XI. Moreover, from the analysis of historical data, the scanning times in these two processes were also compared. Since the SCO’s basket size is smaller, the scanning step times were compared by looking only at TC’s transactions that have less than 15 items. In brief, cashiers spend, on average, 19 seconds at the scanning activity whereas, at SCO, customers spend, on average, 36 seconds, as it is observed in Appendix XII.
Lastly, the data collected allowed to estimate the average duration of each element of the processes, as it can be observed on the bottom of the aforementioned processes’ flowcharts. To summarize, from the analysis of both sources of data, it is clear that cashiers are very efficient, comparing to customers, at the scanning phase, while showing a similar level of
13 efficiency as customers in the payment step. In addition, it is important to notice that the scanning time is much more volatile than the payment sub-process time since the first phase depends significantly on the basket size, whereas the latter is almost constant between transactions.
4.3 Focus Group
The Focus Group method, which is used to gather opinions on key issues from knowledgeable, was also adopted to gather data (Krajewski et al., 2013). Employees close to the process were brought to a creative environment, where they were asked to identify the major pain points felt by customers in their checkout journey, by scrutinizing each one of the processes’ steps. The results, summarized in three tables available in Appendix XIII, show that, in the TC’s checkout, the worst frustration is the waiting time duration and its inherent negative affective responses. Furthermore, in the SS process, customers present lower satisfaction with the service when they have to be checked as well as when they have to read the same item’s barcode several times without being able to introduce the quantity of the item being scanned.
Regarding the SCO option, according to a market research performed by Sonae (2014), customers choose this process specially when there are long lines in the TC checkout. They also appreciate its attributes, such as speed, convenience and privacy. However, they indicate that the main SCO’s disadvantage is the frequency of supervisor’s interventions and the amount of time spent waiting for the supervisor’s help. This issue is a consequence of the customers’ lack of autonomy at this process, which is reducing the quality of the checkout experience. This outcome is in line with pain points found in the focus group method which are intrinsically related with the customers’ lack of autonomy, such as the inability to introduce tax information, quantity of the product, item’s barcode or to pay with gift card autonomously. Moreover, customers also feel less autonomous due to their lack of knowledge about the way the process is performed.
14
4.4 Performance Evaluation
According to Krajewski et al. (2013), performance evaluation is needed in order to complete the process analysis and reveal the performance gap. Therefore, the processes KPIs were measured. The process’s flow time is one of the metrics used to assess performance. For this purpose, data on the processing times was collected in-store by observing 75 transactions and the results are presented in Appendix XIV. The average service time at the TC option (00:02:21) is larger than at the SCO process (00:02:06). The SS option is the one that offers the lowest processing time (00:01:37), in case the customer is not checked by the supervisor. However, if the customer is checked, the flow time of this process increases to 00:03:13, thus becoming the slowest option. Furthermore, the average waiting time and the average number of customers in line also serve as KPIs of services where delays are likely to occur (Krajewski et al., 2013). Thereupon, these metrics were measured based on the observation of 148 transactions, at peak and off-peak hours. As it can be observed in Appendix XV, it is in the single-server TC’s checkout that customers wait more time to be served (00:03:45). The second highest waiting time at Continente checkout is the TC’s multi-server queuing system (00:02:41), followed by the SCO (00:00:23) and the SS (00:00:18) options.
Finally, the average utilization rate is also considered to be a good performance measure in these processes (Krajewski et al., 2013) and, therefore, this metric was estimated based on the analysis of historical data, as it can be observed in Appendix XVI. Looking at the TC checkout, this metric is 7% higher in the multi-server model (72%), than in the single-server model (67%).
4.5 Process Re-Design
After documenting the analyzed processes and assessing the current performance gaps, it is necessary to propose a new design for them (Krajewski et al., 2013). This chapter explores two improvement opportunities which were identified for the checkout processes. In order to evaluate
15 the proposed solutions to the company, the CBA was used by estimating their Net Present Value (NPV), taking into consideration a 3 years’ time horizon and a 15% cost of capital.
Hybrid Checkout
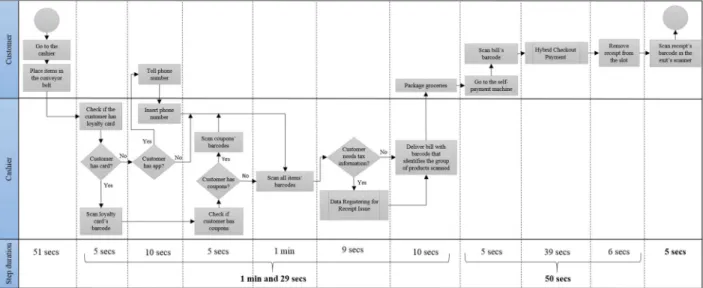
This section presents a new checkout solution that should be considered by the company in stores’ refurbishments and new stores. In this checkout process, customers are served in a three-phase system that separates the scanning and the payment sub-processes, as it can be observed in the queuing system design presented in Appendix XVII. In this solution, the scanning step is executed by cashiers as they proved to be the best performers of this step. On the other hand, the payment phase is performed by customers in a self-payment tower considering that they presented, in this step, the same level of efficiency as cashiers. Thereby, as soon as the cashier finishes the scanning step, the customer can perform the payment sub-process autonomously, leaving the cashier free to serve another customer waiting. This checkout was called “Hybrid” option since it is partially performed by cashiers and partially by customers. As a consequence, it provides a reduction of 37% in the number of cashiers required to perform the checkout service, compared to the TC process. The Hybrid’s flowchart was also drawn and it is shown in Figure 6.
16 In the bottom of the process’s flowchart, the average flow times of each activity are presented, which were estimated based on the data collected in-store from the TC and SCO processes. As it is observed, in this three-phase process, the cashier would start by associating the loyalty card to the transaction, either by scanning its barcode and the coupons or by introducing the customer’s phone number. After scanning all the items’ barcodes, the employee would give a bill that shows
a barcode identifying the group of items scanned and the amount to pay. Finally, the customer can proceed to the self-payment available machines, scan the bill’s barcode and perform payment
with the method selected. This part of the process was mapped in a flowchart shown in Figure 7.
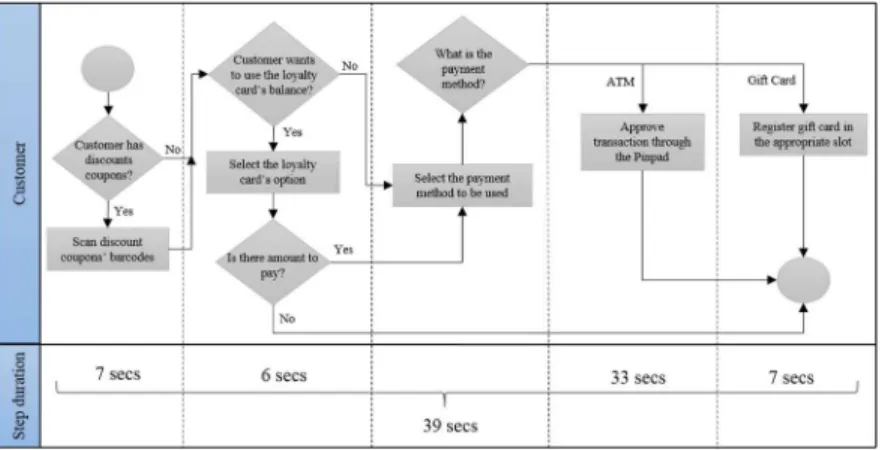
Figure 7 - Flowchart of the Payment Sub-Process of the Hybrid Checkout
In this process, it can only be used the ATM, gift card or the discount coupons payment methods due to the lower processing times that have been observed in the SCO option. In the end, the receipt’s barcode has to be scanned so as to open the gate to exit the checkout area, thus assuring that the customer has paid for the groceries.
For the purpose of evaluating the impact of the Hybrid checkout on waiting times, when compared to the TC process, the following assumptions were considered. Firstly, it was assumed that the customer arrival rate follows a Poisson distribution and that the average arrival rate for each cashier is 0,39 customers per minute. This assumption was made based on the data collected in-store for 3 hours during peak periods. The service rates assumed were calculated based on the
17 average processing time of each step in SCO and TC processes, as it is shown in Appendix XVIII, and it was assumed that the service rates follow all an exponential distribution. Moreover, in order to compare the two checkout processes, it was considered that both operate in a multi-server queuing design and, in addition, that the TC checkout operates with six cashiers available, while Hybrid checkout operates with four cashiers, three payment towers and one exit scanner. Yet, the arrival rate considered for the Hybrid checkout was the arrival rate for 6 cashiers. Having these hypotheses established, the TC is expected to offer a waiting time of 3 minutes and 36 seconds, while the Hybrid checkout offers a total average waiting time of 2 minutes and 40 seconds, thus providing a 26% reduction in checkout waiting times. These values are presented in Appendix XIX, where it can be observed that the expected waiting time of the first stage is, approximately, 2 minutes, on average, while the self-payment’s waiting time is 37 seconds, on average, and, in the exit scanner, customers are expected to wait, on average, 2 seconds.
Finally, a CBA was performed in order to appraise the NPV of the Hybrid solution. Its benefits were calculated having in mind the reduction in human resources needed at the checkout process. The higher levels of customer satisfaction resulting from the reduced checkout waiting times are difficult to quantify and so, the economic value of this benefit was not taken into account. The solution’s costs took into consideration the system development needed to support these processes as well as the equipment acquisition and maintenance costs, compared to the TC’s costs. That being said, this solution provides a NPV of 343 414 €, as it is shown in Appendix XX. To conclude, this checkout option is appropriate for customers seeking a fast service and who are available to perform part of the checkout process in self-service technologies. Comparing to the SCO option, the main advantage is the lower processing times offered to customers. In addition, customers feel more autonomous in the Hybrids’ self-service stage than in the SCO, considering cashiers execute the most difficult part of the process for customers. Compared to the SS option,
18 this service offers a reduced risk of theft and so, customers’ experience is not damaged by the existence of check audits. On the other hand, the main pitfall is the possible feeling of lack of control that may be experienced during the second waiting line. Yet, customer dissatisfaction may be reduced by the multi-server design since it brings a sense of fairness. Nevertheless, the company should act towards reducing the negative affective responses to wait at this stage.
Virtual Queue
Virtual Queue (VQ) is a queuing system that prevents customers from being in a physical line when waiting for a service, thus enabling customers to engage in other more enjoyable activities. It is already used in supermarkets and, in particular, in Continente stores, at department services such as butchery and fishmonger, among others. Here, customers may take a ticket from a kiosk or from a mobile app and, then, join a virtual queue until their ticket’s number is called. The purpose of this section of the paper is to apply the VQ’s concept to Continente checkout.
To support this solution, the benchmarking approach was adopted, by looking at Walt Disney World’s successful VQ’s implementation in its amusement parks. In the Disney’s VQ system, customers take a ticket from a kiosk near the attraction, which indicates the time window of freed time that they have until their turn arrives. According to Cope et al. (2008), after its implementation, guests who used the VQ’s system were more satisfied, saw more attractions and spent significantly much less time waiting in line.
For the purpose of applying the VQ to the supermarket checkout, the most appropriate solution seems to be a mobile app, for two main reasons: firstly, customers do not need to wait in line to take a ticket from a kiosk, as it happens in Disney amusement parks; secondly, customers do not have to pay attention to the progress of the VQ since the app will notify customers when their turn to join checkout arrives, thus offering a more comfortable waiting experience. The creation of an extra personalized customer touchpoint is another benefit of the mobile app solution.
19 The drafts of the app’s wireframes were drawn, which are available in Appendix XXI. As it can be observed, the mobile app should offer a quick accessibility and it should be integrated in another mobile app, such as Continente’s app. The app should show customers real-time information on the expected waiting time in the VQ. Besides these requirements, the app should accommodate a feature that allows customers to make a re-queue request as well as to dropout the queue. The re-queue request would enable the customer to be re-allocated in the queue in case he/she needs more time in the store, thus assuring that no sales are lost with this checkout system. The VQ service’s target is characterized by customers that have a pre-disposition to use mobile apps and, thus, who are aged between 22 and 60 years old. In addition, this checkout system is ideal for customers that are short on time and that usually purchase more than 15 items.
As the VQ’s acceptance and usage is key to this service’s success, a market survey was performed in order to assess the customers’ willingness to adopt the VQ system. The survey’s questions and results can be observed in Appendix XXII. The survey was structured as follows: the first section allowed to perceive the customers’ intentions to use this queuing system; secondly, questions, such as age and the tendency of app’s usage, were asked; thirdly, the consumer behavior was also explored, by asking in which retailers they make most of the groceries’ shopping, if they usually go in a hurry to the supermarket and, finally, the usual transactions volume. A sample of 266 responses resulted in the values available in Appendix XXII. In the 1st section, respondents were asked to rank the probability to use the mentioned service in a 5-point scale from 1 – “extremely unlikely” to 5 – “extremely likely”. In brief, 32% of the respondents ranked the probability of using the VQ system as 5 and, in addition, almost 35% selected 4 to rank this probability, making a total of 67% of the sample. Furthermore, within the service’s defined target, which accounts for 23% of the survey’s sample, 43% are extremely likely to use the VQ service at checkout. Moreover, the respondents within this segment that
20 selected 4 or 5 to rank the probability of adopting the VQ service account for 75% of the target’s sample. To sum up, these values show the high willingness to use VQ system at checkout.
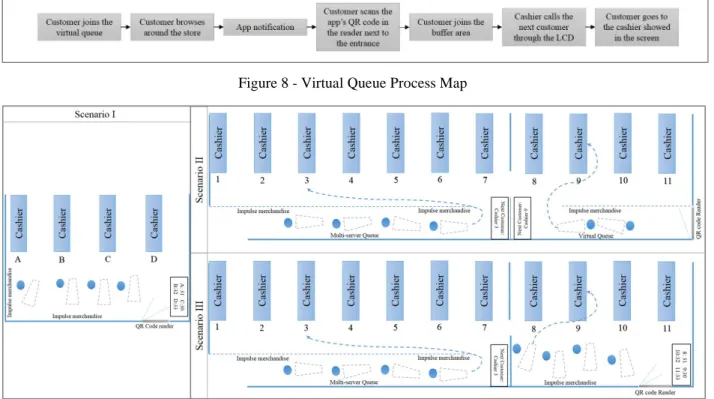
For the purpose of recommending the application of a VQ’s concept to Continente checkout, three operational solutions have been designed. One of their main requirements is to assure the minimum flow of the checkout process in order to prevent an increase in the cashiers’ idle time. For this purpose, the system that supports the VQ process must have real-time information on the number of VQ’s users waiting, at each moment, in the checkout buffer area. Thus, the three scenarios proposed include technological solutions that allow to inform the system when the customer arrives at the checkout area as well as when the customer starts being served. Moreover, the VQ checkout area must be clearly distinct from the traditional cashiers’ checkout area in order to avoid misunderstandings among customers. Having these constraints in mind, the VQ’s process was drawn and its map can be observed in Figure 8. In addition, a draft of the layout of the three scenarios proposed to employ the VQ solution can be observed in Figure 9.
Figure 8 - Virtual Queue Process Map
21 As presented in Figure 8, the VQ process starts as soon as the checkout option is selected by the customer in the mobile app. He/she can continue to browse around the store, until the app’s notification is received. At this moment, the customer has a pre-determined amount of time to arrive at the VQ’s checkout area, where the app’s QR code has to be read in order to enter in the VQ’s buffer area. In this area, the customer has to wait until a warn is displayed in a LCD screen, which informs the customer which cashier is available to start the checkout process.
As it is shown in Figure 9, the 1st proposed scenario offers an exclusive checkout area to customers using the VQ system. Here, customers can wait in a spacious and comfortable place until the cashier calls them, which reduces the negative affective responses to wait that may be felt in the buffer area. In the 2nd scenario, there are two multi-server lines, one for the VQ’s non-users and another for VQ’s non-users. In this solution, if there are no customers in the VQ’s buffer area, the cashiers allocated to the VQ system can call customers waiting in the physical queue as well, as shown in Appendix XXIII. Therefore, the main benefit of this scenario is the reduction of the minimum number of customers needed in the buffer area in order to maintain the process flow, since there is a very low risk of having cashiers unoccupied. Nevertheless, in this operational solution, customers waiting in the physical line may perceive that they are being overtaken by the VQ’s users and so, there is a risk of increasing these customers’ dissatisfaction. This risk is reduced with the 3rd scenario proposed since it offers a VQ’s buffer area similar to the 1st scenario, which allows a clearer distinction between the VQ’s area and the physical line’s area. Moreover, this scenario gathers the 1st scenario’s benefit of reducing the negative responses to wait and the 2nd scenario’s benefit of reducing the risk of increasing the cashiers’ idle time. To conclude, a CBA was performed to evaluate the economic value of the VQ proposed solution. The foreseen benefits of the VQ at checkout are the reduced customers’ perception of waiting time and the increased unplanned purchases. Besides, the reduced uncertainty regarding the wait
22 duration and the increased customers’ sense of control over the wait are also positive points of this system. Despite being the main benefit offered by this solution, the value of the reduction in customers’ perceived waiting time at checkout was not, once again, measured. Nevertheless, the increase in checkout efficiency can also be identified as a benefit of this queuing system. In fact, since the multi-server model is the proposed design for the VQ, it can be assumed that the efficiency gaining offered by this solution, measured by the cashiers’ useful time rate, will be similar to the TC multi-server model’s. Therefore, this was the rationale that formed the basis for the calculation of the VQ’s benefit. Moreover, the solution’s cost had into consideration the cost of development of the software as well as the store equipment cost and the costs of implementation. As shown in Appendix XXIV, the VQ’s solution offers a NPV of 158 125€.
5. Conclusion
Supermarket checkout is perceived by customers to be a waste of one of the most precious commodities: time. The analysis of Continente checkout processes performed by this research provided two possible improvements which address not only the waiting time perception topic, but also the process efficiency issue so as to deliver a better checkout experience to customers. Through the processes analysis, it was proved that cashiers show higher efficiency than customers at performing the checkout’s scanning phase, while customers present the same level of efficiency as cashiers in the payment step. Furthermore, it was concluded that customers wait more time than it is desirable at the TC checkout. The SS option attempts to solve this concern but the high risk of losses is turning this process longer than it was expected, thus reducing the service’s perceived quality. The SCO also seems to be an option with low waiting times, however, the frequency of supervisor’s interventions and the time spent waiting for them are reducing the quality of the service provided. At the end, the checkout service provided is not the ideal for shoppers which reduces customer satisfaction. As a result, two solutions were proposed.
23 In the first place, the Hybrid checkout allows to use cashiers and customers at the activities in which each showed better performance, thus increasing process efficiency. Consequently, the solution offers lower waiting times than the TC checkout and, in addition, lower processing times than SCO option. Moreover, the customers’ feeling of autonomy in the self-service stage is high and it provides low risk of theft, compared to the alternative self-service options. Thereupon, Sonae MC should evaluate carefully this option so as to reduce checkout operational costs without disregarding the customers’ perception of waiting time and the quality of the customer experience provided at checkout.
In the second place, the value proposition of the recommended Virtual Queue system is to deliver a better shopping experience with significantly reduced perceived waiting times at checkout. Thus, it is an optimal solution if the company’s major priority is the perceived quality of the service provided at checkout, and hence customer satisfaction. Besides, it offers increased checkout efficiency and, in addition, increased revenues, by raising the store dwell time.
Lastly, as data was collected in only one store, further research could be undertaken in order to ascertain the generalizability of the presented findings to other supermarkets, showing different customer behaviors as well as with other store environments. Furthermore, when evaluating the application of both solutions to Continente’s checkout, Sonae MC should consider to implement them on a trial basis, in a reduced number of stores, in order to measure the aforementioned checkout processes’ KPIs. Likewise, the company should also evaluate the resulting customers’ satisfaction levels and the main frustrations felt by them in these two checkout services. Finally, the reverse scanner solution, which allows customers to checkout completely by themselves when there is no cashier available to serve them, was not addressed by this work project. Thus, the company should perform a CBA of the implementation of reverse scanners together with the Hybrid checkout, since it would offer an even higher human resources’ reduction.
24
6. References
Bäckström, Kristina and Johansson, Ulf. 2006. “Creating and Consuming Experiences in Retail Store Environments: Comparing Retailer and Consumer Perspectives.”, Journal of Retailing and
Consumer Services, 13: 417-430.
Cope, Robert F. III, Cope, Rachelle F. and Davis, Harold E. 2008. “Disney’s Virtual Queues: A Strategic Opportunity To Co-Brand Services?”, Journal of Business & Economics Research, 6 (10): 13-20.
Dabholkar, Pratibha A. 1996. “Consumer Evaluations of New Technology-Based Self-Service Options: An Investigation of Alternative Models of Service Quality”, International Journal of
Research in Marketing, 13(1): 29-51.
Dabholkar, Pratibha A. and Bagozzi, Richard P. 2002. “An Attitudinal Model of Technology-Based Self-Service: Moderating Effects of Consumer Traits and Situational Factors.”, Journal of
the Academy of Marketing Science, 30(3): 184-201.
Gentile, Chiara, Spiller, Nicola and Noci, Giuliano. 2007. “How to Sustain the Customer Experience: An Overview of Experience Components that Co-create Value with the Customer.”
European Management Journal, 25(5): 395-410.
Katz, Karen L., Larson, Blaire M., and Larson, Richard C. 1991. “Prescription for the Waiting-in-Line Blues: Entertain, Enlighten, and Engage.” Sloan Management Review, 32(2): 44-53.
Krajewski, Lee J., Ritzman, Larry P. and Malhotra, Manoj K. 2013. Operations Management:
Processes and Supply Chains. Upper Saddle River: Prentice Hall.
Larson, Richard C. 1987. “Perspective on queues: social justice and the psychology of queueing.”
25 LaSalle, Diana and Britton, Terry A. 2003. Priceless: Turning Ordinary Products into
Extraordinary Experiences. Boston, MA: Harvard Business School Press.
Maister, David H. 1985. “The psychology of waiting lines”, In The Service Encounter, edited by Czepiel, J.A., Solomon, M.R. and Surprenant, C.F., 113-123. Lexington, MA: Lexington Books.
Marzocchi, Gian L. and Zammit, Alessandra. 2006. “Self-scanning technologies in retail: Determinants of Adoption.” The Services Industries Journal, 26(6): 651-669.
Pine, Joseph. B. and Gilmore James B. 1998. “Welcome to the Experience Economy.” Harvard
Business Review,76(4): 97-105.
Sonae (2014), “Avaliação Caixas Self-Checkout”.
Taylor, Shirley. 1994. “Waiting for service: the relationship between delays and evaluation of service quality.” Journal of Marketing, 58(2): 56-69.
Taylor, Shirley. 1995. “The effects of filled waiting time and service provider control over the delay on evaluations of service.” Journal of the Academy of Marketing Science, 23(1): 38-48. Tom, G. and Lucey, S. 1997. “A Field Study Investigating the Effect of Waiting Time on Customer Satisfaction.”, Journal of Psychology, 131(6): 655-60.
Verhoef, Peter, Lemon, Katherine N., Parasuraman, A., Roggeveen, Anne, Tsiros, Michael and Schlesinger, Leonard A. 2009. “Customer Experience Creation: Determinants, Dynamics and Management Strategies.” Journal of Retailing, 85(1): 31-41.
Weijters, Bert, Devarajan, Rangarajan, Falk, Tomas and Schillewaert Niels. 2007. “Determinants and Outcomes of Customers’ Use of Self-Service Technology in a Retail Setting.” Journal of
Service Research, 10(1): 3-21.