Authors
Priscila Ruppel1 Claudia R. Felipe1 Jose O. Medina-Pestana1 Liliane Lumi Hiramoto1 Laila Viana1
Alexandra Ferreira1 Wilson Aguiar1 Mayara Ivani1 Adrieli Bessa1 Marina Cristelli1 Melissa Gaspar1 Helio Tedesco-Silva Jr1
1 Universidade Federal de São
Paulo, São Paulo, SP, Brasil.
Submitted on: 07/22/2017. Approved on: 09/04/2017.
Correspondence to: Helio Tedesco-Silva Jr. E-mail: heliotedesco@medfarm. com.br
The influence of clinical, environmental, and
socioeco-nomic factors on five-year patient survival after kidney
transplantation
A influência de fatores clínicos, ambientais e socioeconômicos na
sobrevida de cinco anos após o transplante renal
Introdução: O risco de óbito após transplan-te renal está associado à idade do receptor, presença de comorbidades, condição socioe-conômica, às características ambientais locais e ao acesso a serviços de atenção à saúde. Objetivo: Investigar as causas e fatores de risco associados ao óbito nos primeiros cin-co anos após o transplante renal. Métodos: Este é um estudo unicêntrico retrospectivo com pareamento dos grupos caso e controle. Resultados: Em uma coorte consecutiva de 1.873 receptores de transplante renal atendi-dos de 1/1/2007 a 31/12/2009 foram registra-dos 162 óbitos (grupo caso), correspondendo a uma taxa de sobrevida após cinco anos de 91,4%. Dos óbitos registrados, 25% ocorre-ram nos primeiros três meses após o trans-plante. A causa de óbito mais prevalente foi infecção (53%), seguida de doença cardiovas-cular (24%). Os fatores de risco associados a mortalidade foram histórico de diabetes, tipo e tempo em diálise, desemprego, função tar-dia do enxerto, número de consultas, núme-ro de hospitalizações e tempo de internação hospitalar. Após análise multivariada, apenas o tempo em diálise, o número de consultas e dias de internação permaneceram associados a mortalidade. Os pacientes que foram a óbi-to tiveram um número não significativamente maior de tratamentos de episódios de rejeição aguda (38% vs. 29%; p = 0,078), maior nú-mero médio de eventos adversos por paciente (5,1 ± 3,8 vs. 3,8 ± 2,9; p = 0,194) e TFGe média mais baixa aos três meses (50,8 ± 25,1
vs. 56,7 ± 20,7; p = 0,137) e 48 meses (45,9 ± 23,8 vs. 58,5 ± 20,2; p = 0,368). Conclusão: A presente análise confirmou que nessa po-pulação, a infecção foi a principal causa de mortalidade nos primeiros cinco anos após transplante renal. Vários fatores de risco de-mográficos e socioeconômicos foram associa-dos a mortalidade, a maioria não prontamen-te modificável.
RESUMO
Palavras-chave: Transplante de Rim; Mortalidade; Fatores de Risco; Fatores Socioeconômicos.
Introduction: The risk of death after kidney transplant is associated with the age of the recipient, presence of comor-bidities, socioeconomic status, local en-vironmental characteristics and access to health care. Objective: To investigate the causes and risk factors associated with death during the first 5 years after kid-ney transplantation. Methods: This was a single-center, retrospective, matched case-control study. Results: Using a consecu-tive cohort of 1,873 kidney transplant re-cipients from January 1st 2007 to
Decem-ber 31st 2009, there were 162 deaths (case
group), corresponding to 5-year patient survival of 91.4%. Of these deaths, 25% occurred during the first 3 months after transplant. The most prevalent cause of death was infectious (53%) followed by cardiovascular (24%). Risk factors as-sociated with death were history of dia-betes, dialysis type and time, unemploy-ment, delayed graft function, number of visits to center, number of hospitaliza-tions, and duration of hospital stay. After multivariate analysis, only time on dialy-sis, number of visits to center, and days in hospital were still associated with death. Patients who died had a non-significant higher number of treated acute rejection episodes (38% vs. 29%, p = 0.078), high-er mean numbhigh-er of advhigh-erse events phigh-er pa-tient (5.1 ± 3.8 vs. 3.8 ± 2.9, p = 0.194), and lower mean eGFR at 3 months (50.8 ± 25.1 vs. 56.7 ± 20.7, p = 0.137) and 48 months (45.9 ± 23.8 vs. 58.5 ± 20.2, p = 0.368). Conclusion: This analysis con-firmed that in this population, infection is the leading cause of mortality over the first 5 years after kidney transplantation. Several demographic and socioeconomic risk factors were associated with death, most of which are not readily modifiable.
ABSTRACT
Keywords: Kidney Transplantation; Mortality; Risk Factors; Socioeconomic Factors.
INTRODUCTION
Death with functioning graft is a major cause of graft loss among kidney transplant recipients worldwide. A recent review of almost ten thousand kidney trans-plants revealed that death with functioning graft ac-counted for 45% of kidney graft losses.1 Contrary
to developed countries, where cardiovascular events are the major cause of death, in this large cohort of kidney transplant recipients from a developing coun-try, the major cause of death was infection, not only during the first year but during any time after kid-ney transplantation.1 The risk of death increases with
the age of the recipient from 5.8% under 50 years to 45.5% in patients older than 80 years. The risk of death increases even more in the presence of comor-bidities such as hypertension, dyslipidemia, and post-transplant diabetes.2
A previous study revealed several risk factors as-sociated with death within the first 6 months after transplantation, including donor age and cause of death, recipient gender, HLA compatibility, changes in electrocardiogram, weight at the time of trans-plantation, financial assistance, monthly income, and having children and family support.3 Patients living
in lower socioeconomic areas have a higher risk of death2 and patients with lower income presented an
additional 36.2% risk for graft loss.4 In the past,
evaluating the impact of socioeconomic factors on the outcome of transplantation was difficult, so race was used as a surrogate for patient’s socioeconomic status. In that scenario, Black patients, with usually worse socioeconomic characteristics, had lower graft survival.5 Socioeconomic variables have always
influ-enced health-related outcomes.3 In a previous study,
four of ten variables influencing transplant outcomes were socioeconomic, perhaps explaining the apparent discrepancy in the cause of death between developed and developing countries.3
Other socioeconomic factors have been associ-ated with graft loss and death after renal transplant. One of these factors is the human development index (HDI), a statistical measure used as an indicator of health to classify regions considering life expectancy, education, and per capita income.6,7 Finally, local
environment also influence health-related outcomes. As such, sanitation, weather, endemic diseases, and
access to health care may influence kidney transplant outcomes. Considering this complex scenario, we in-vestigated further the causes and risk factors associ-ated with death over the first five years after kidney transplantation.
METHODS
STUDY DESIGN
This was a single-center, retrospective, case-con-trol study comparing demographical and clinical outcomes between patients who died and paired matched living controls during the first 5 years af-ter kidney transplantation. The case-control design hindered several traditional risk factors such as re-cipient age, diabetes, and cardiovascular disease. However, the aim was to investigate beyond these traditional risk factors and determine whether local socioeconomic and environmental risk fac-tors would be involved. The data was extracted from the electronic database and judged accord-ingly. The study was approved by the local ethics committee.
POPULATION
We included only patients who received a kidney transplant from January 1, 2007 to December 31, 2009, thus allowing 5 years of follow up by December 31, 2014. During this period 2305 kidney transplants were performed. We excluded 140 recipients of re-transplants, 126 recipients of combined kidney/pan-creas transplants and 166 pediatric recipients. Of the final cohort of 1,873 patients, we identified all deaths within the first 5 years after transplantation to form the case group. The control group (1:1) was selected from the same cohort by matching the following vari-ables: date of transplant, recipient age (+/- 5 years), gender and race, donor age (+/- 5 years), gender and type (living or deceased) and use of thymoglobulin induction.
OBJECTIVE
of hospitalizations, renal function, and specific causes of death.
DEMOGRAPHICANDSOCIOECONOMICVARIABLES
Data were collected retrospectively from medical re-cords and included recipient, donor, and transplant-related variables. We also assessed human develop-ment index (HDI) of the city of each patient using the Human Atlas of Human Development (http://www. atlasbrasil.org.br/, assessed on 13 of June, 2016)7 and
travel distance to the transplant center using Google Maps™ (maps.google.com). Professions were classi-fied in three main categories based on the information obtained at the time of transplantation: higher occu-pations (high-level hierarchical position), intermediate occupations (lower hierarchical rank) and lower occu-pations (manual or routine labor), also including those who had never worked or were unemployed according the National Socio-economic Classification (NS-SEC).8
IMMUNOSUPPRESSIONANDPROPHYLAXIS
The use of induction therapy, with basiliximab or rabbit anti-thymocyte globulin, and the maintenance immunosuppressive regimens consisted primarily of a calcineurin inhibitor in combination with an anti-pro-liferative drug or an mTOR inhibitor and were based on institutional protocol derived from evaluation of immunological risk. All patients received corticoste-roids, 1 mg intravenous bolus of methylprednisolone before graft revascularization followed by 0.5 mg/kg/ day of prednisone with a taper to 5 mg/day between 30 to 45 days after transplantation. All patients re-ceived sulphametaxasol trimetropin for at least 6 months for prophylaxis against Pneumocystis jirove-cii pneumonia and urinary tract infection. All patients received albendazole for parasitic infections. None of the patients received pharmacological prophylaxis for cytomegalovirus (CMV) infection. Instead, preemp-tive treatment was performed in patients deemed as high risk for developing CMV infection: (1) seronega-tive CMV kidney transplant recipients from seroposi-tive CMV donors (D+/R-); (2) use of r-ATG for in-duction and (3) use of MPS for maintenance therapy; (4) after treatment of acute rejection episodes.
CLINICALPARAMETERS
Delayed graft function (DGF) was defined as the need for dialysis during the first week after transplantation, except for one dialysis due to
hyperkalemia. Estimated glomerular filtration rate (eGFR) was calculated using the MDRD formula. Acute rejection episodes included biopsy-proven acute rejection (BPAR) (Banff 2005) and clinical acute rejections were episodes of acute graft dys-function treated with methylprednisolone for at least 3 days without histological confirmation (no biopsy, biopsy with insufficient representation of renal compartments or biopsy without evidence of acute rejection). All causes of death and graft loss were assessed. Patients transferred to another cen-ter or those with missing appointments for more than 6 months were considered lost to follow-up.
OUTPATIENTVISITSANDHOSPITALIZATIONS
The number of outpatient visits and hospital readmis-sion days were calculated in both groups during the follow-up time in months. All serious adverse events (SAE) during each hospitalization were captured and classified according to the Common Terminology Criteria for Adverse Events (CTCAE) version 4.0.
STATISTICALANALYSIS
The Kolmogorov-Smirnov test was performed to verify the normality of the numerical variables. Variables with normal distribution were summa-rized by mean and standard deviation and differ-ences compared using the Student’s t-test. Variables with non-normal distribution were summarized by median and range and the differences were com-pared using the non-parametric U Mann-Whitney test. Frequencies and the chi-square test were used for qualitative variables. Uni- and multivariable risk analysis was performed using Cox regression and 95% confidence intervals. All tests were ana-lyzed using the SPSS Statistics 18.0 program (SPSS Inc., Chicago, IL). Values of p < 0.05 were report-ed as statistically significant.
RESULTS
POPULATION
Variables death (n = 162) control (n = 162) p
Recipient age (years), mean ± SD 50.3 ± 12.2 49.8 ± 12.6 0.971
Recipient gender (male), N (%) 96 (59.3) 102 (63) 0.494
Cause of chronic kidney disease, N (%) 0.418
Undetermined 75 (46.3) 79 (48.8)
Hypertension 14 (8.6) 11 (6.8)
Diabetes mellitus 32 (19.8) 24 (14.8)
Glomerulonephritis 11 (6.8) 17 (10.5)
Time on dialysis (months), mean ± SD 53.9 ± 41.5 36.9 ± 31.0 < 0.001
Type of renal replacement therapy, N (%) 0.019
Preemptive 2 (1.2) 12 (7.4)
Hemodialysis 146 (90.1) 140 (86.4)
Peritoneal 14 (8.7) 10 (6.2)
History of diabetes mellitus, N (%) 47 (29) 30 (18.5) 0.026
Prior contact with tuberculosis, N (%) 3 (1.9) 0 (0) 0.082
Panel reactive antibodies, (%)
Class I, mean ± SD 7 ± 17 8 ± 20 0,265
Class II, mean ± SD 6 ± 19 3 ± 13 0,01
HLA mismatches, mean ± SD 2.8 ± 1.6 2.3 ± 1.6 0.64
Donor age, years, mean ± SD 46.5 ± 12.7 46.0 ± 12.9 0.763
Donor gender, male, N (%) 79 (48.7) 87 (53.7) 0.405
Donor type, N (%) 0.968
Living 51 (31.5) 53(32.7)
Deceased Standard criteria 76 (46.9) 74 (45.7)
Deceased Expanded Criteria 35 (21.6) 35 (21.6)
Deceased donor cold ischemia time, hours, mean ± SD 25.4 ± 6.42 24.9 ± 5.76 0.163
TABLE 1 DEMOGRAPHICSCHARACTERISTICSOFTHESTUDYPOPULATION
HLA: human leukocyte.
controls (transplants prior to 2007 [n = 4] or af-ter 2009 [n = 5], without matched donor age [n = 3], gender [n = 4] or donor type [n = 2]). Among the 162 control cases, there were 9 graft losses, 11 losses to follow-up and 5 transplants after 2009, yielding 137 patients who completed 5 years of follow-up.
DEMOGRAPHY
Patients who died during the first 5 years after trans-plantation were more likely to have diabetes mellitus, were on dialysis for a longer period of time and three of them had prior contact with tuberculosis (Table 1). There was no difference in marital status, religion, and HDI. Patients who died tended to have lower lev-el of education and to be unemployed. Interestingly, patients who died lived closer to the transplant center (Table 2). There was no evident difference in use and
type of induction agent or the maintenance of immu-nosuppressive regimens. The majority of patients re-ceived induction therapy followed by tacrolimus with mycophenolate or azathioprine (Table 3).
CLINICALOUTCOMES
Patients who died had a higher incidence of delayed graft function, higher incidence of treated acute re-jection episodes, higher number of acute rere-jection episodes treated with rabbit anti-thymocyte globulin (r-ATG), and lower eGFR compared to the control group during the 5 years of follow up (Table 4).
VISITS, HOSPITALIZATIONS, AND SERIOUS ADVERSE EVENTS
Variables, N (%) death (N=162) control (N=162) p
Marital status 0.966
Married 104 (64.2) 104 (64.2)
Cohabitation 3 (1.9) 5 (3.1)
Separated 2 (1.2) 3 (1.9)
Divorced 6 (3.7) 7 (4.3)
Not married 37 (22.8) 33 (20.4)
Widower 8 (4.9) 9 (5.6)
Others 2 (1.2) 1 (0.6)
Religion 0.255
Adventist 1 (0.6) 0 (0)
Atheist 6 (3.7) 9 (5.6)
Batista 0 (0) 2 (1.2)
Catholic 109 (67.3) 96 (59.3)
Evangelical 27 (16.7) 33 (20.4)
Jehovah’s Witness 3 (1.9) 1 (0.6)
Protestant 0 (0) 3 (1.9)
Spiritist 5 (3.1) 3 (1.9)
Others 11 (6.8) 15 (9.3)
Degree of instruction 0.133
Primary incomplete 29 (17.9) 22 (13.6)
Secondary incomplete 82 (50.6) 72 (44.4)
Secondary or higher 51 (31.5) 68 (42.0)
Profession classification < 0.001
Intermediate 8 (4.9) 31 (19.1)
Lower 75 (46.3) 80 (49.4)
Unemployed 79 (48.8) 51 (31.5)
Human Development Index of the city-2010 0.373
Very high 68 (42) 72 (44.4)
High 88 (54.3) 87 (53.7)
Medium 6 (3.7) 2 (1.2)
Low 0 (0) 1 (0.6)
Travel distance to center, Km, mean ± SD 93.98 ± 191.87 144.92 ± 342.93 0.011
TABLE 2 SOCIOECONOMICANDCULTURALCHARACTERISTICSOFTHESTUDYPOPULATION
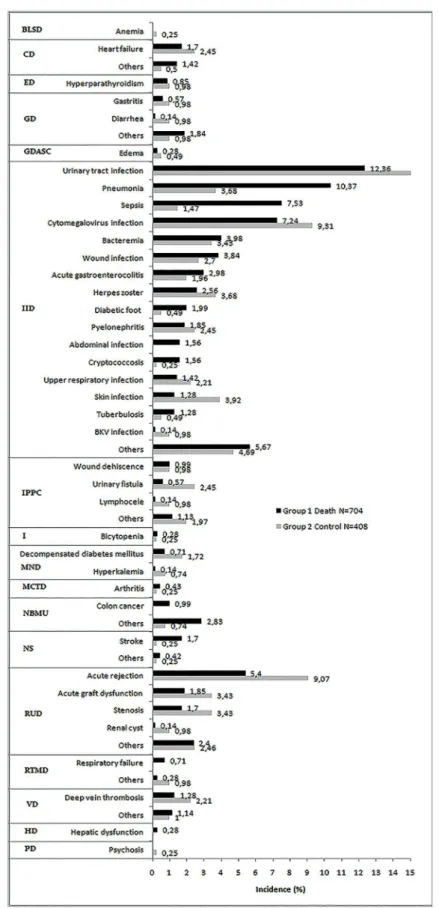
infestations accounted for the majority of the adverse events. Urinary tract infection, pneumonia, sepsis, and CMV infection accounted for the majority of in-fections leading to hospital readmissions. While pneu-monia and sepsis were more prevalent among patients who died, no clear differences were observed for uri-nary tract and CMV infections. Interestingly, skin in-fection, urinary fistula, and acute rejection were more prevalent in the control group, with no significant
differences in other specific adverse events during hospitalizations comparing both groups (Figure 1).
RISKFACTORSANDCAUSESOFDEATH
Regimen, n (%) death (n = 162)
control (n = 162)
Induction
none 52 (32) 65 (40)
basiliximab 96 (59) 80 (49)
anti-thymocyte globulin 14 (9) 17 (11)
Maintenance
Tacrolimus/mycophenolate 78 (48) 68 (42)
Tacrolimus/azathioprine 54 (33) 56 (35)
Tacrolimus/ mTOR inhibitor 2 (1) 3 (2)
Cyclosporine/mycophenolate 7 (4) 6 (4)
Cyclosporine/azathioprine 3 (2) 13 (8)
Cyclosporine/mTOR inhibitor 5 (3) 4 (3)
Other 13 (8) 12 (8)
TABLE 3 INITIALIMMUNOSUPPRESSION
mTOR: mammalian target of rapamycin.
Death Control
p (N = 162) (N = 162)
Delayed graft function, n (%) 67 (41) 47 (29) 0.012
Treatment for acute rejection, n (%) 62 (38) 47 (29) 0.078
All acute rejection treated with r-ATG, n (%) 22 11
eGRF, mean ± DP (n)
Day 1 12.3 ± 11.6 (161) 13.3 ± 12.1 (162) 0.307
Month 3 50.8 ± 25.1 (118) 56.7 ± 20.7 (157) 0.137
Month 6 50.8 ± 21.6 (102) 58.4 ± 20.8 (154) 0.839
Month 12 55.8 ± 25.3 (91) 61.4 ± 20.4 (148) 0.1
Month 24 49.9 ± 21.9 (67) 59.8 ± 20.5 (148) 0.669
Month 36 50.3 ± 23.8 (43) 60.2 ± 20.3 (141) 0.162
Month 48 45.9 ± 23.8 (20) 58.5 ± 20.2 (137) 0.368
Month 60 - 58.1 ± 21.3 (137)
r-ATG: rabbit anti-thymocyte globulin; eGRF: estimated glomerular filtration rate using the modification of diet in renal disease formula (mL/ min/1.73 m2).
TABLE 4 CLINICALOUTCOMESDURINGTHE 5-YEARFOLLOW-UP
and number of days in hospital. After multivariable analysis only time on dialysis, visits to center, and days in hospital were still associated with death (Table 7).
DISCUSSION
In this cohort of 1873 adult recipients of first kidney transplant, the 5-year patient (91.4%), graft (82.9%), and death-censored graft (90.7%) survivals are in agreement with other larger registry analyses.9,10 This
case control study showed that infection is the most prevalent cause of death during the first 5 years after
transplantation. Remarkably, 25% of all deaths oc-curred during the first 3 months after transplantation, a period of higher risk of mortality compared with patients on dialysis.11,12 At the end of the first year,
44% of all deaths had occurred. Cardiovascular dis-ease was the second most prevalent cause of death in the sample. However, most of these deaths (64.3%) were in the first year post-transplantation, charac-terizing the high cardiovascular risk of the patients before transplantation.13 In the United States14 and
Australia15 the main cause of death is cardiovascular
disease, followed by infection and malignancy. Yet, in developing countries, the leading cause of death following renal transplant is infectious, followed by cardiovascular.16-18 The low incidence of death due to
malignancy is perhaps associated with the still limited follow-up time of 5 years.
The difference in the primary cause of death is due to a complex interplay of donor, recipient and environmental factors. Time on dialysis is associ-ated with increased risk and severity of infections, cardiovascular diseases, and malnutrition, which are comorbidities known to be associated with death af-ter transplant.19,20Diabetes mellitus is a well-known
demographic characteristic associated with increased risk of mortality after kidney transplantation.14,21 The
death (N = 162)
control
(N = 162) p
Visits to the transplant center, n/month, mean ± SD 1.5 ± 1.3 0.8 ± 0.4 < 0.001
Number of patients hospitalized, N (%) 139 (86) 107 (66) < 0.001
Rehospitalizations, N 446 294
Rehospitalizations per patient, mean ± SD 2.7 ± 2.7 1.8 ± 2.1 0.058
Days in hospital (n/month), mean ± SD 12.7 ± 32.7 2.8 ± 16.3 < 0.001
Adverse events, N 704 408
Adverse events per patient, mean ± SD 5.1 ± 3.8 3.8 ± 2.9 0.194
TABLE 5 VISITS, HOSPITALIZATIONS, ANDADVERSEEVENTSDURINGTHE 5 YEARSOFFOLLOWUP
up. While a similar prevalence of 23% is observed in Europe,22 in the USA this prevalence is as high as
40%.23
The combination of inadequate deceased donor maintenance, the use of kidneys from expanded cri-teria, and the long cold ischemia time are known risk factors associated with the observed high incidence of delayed graft function. While a meta-analysis showed no significant relationship between delayed graft function and patient survival at 5 years,24 more
recent registry analyses have shown an influence on long-term mortality.25 Furthermore, patients who
de-velop delayed graft function are at higher incidence for acute rejection,26 inferior graft function,27-29 and
patient survival.27,30,31
Patients who died had a higher prevalence of hos-pitalizations, hospitalization density, and visits to the transplant center than patients in the control group, perhaps due to higher number of comorbidities, com-plications after the transplant surgery, and worse transplant outcome. Hospitalizations are six times higher among kidney transplant recipients than the general population.32 While hospitalizations due to
cardiovascular and infectious diseases are associated with higher mortality rate in the general population ,33 there is no such evidence among kidney transplant
recipients.32,33
Sociodemographic characteristics of the transplant population such as education, profession, income, and development index are associated with transplant outcomes.34 Lower income was identified as a factor
related to poor graft and patient survival in the United States.4 Woodward et al. showed that even in the first
3 years after transplant, when Medicare guarantees access to immunosuppression in the United States,
patients with lower income present lower patient and graft survival.4 Also, access to health care is another
key variable influencing transplant outcomes,4,35as
evidenced when comparing 5-10 survivals in the USA and Europe.35 Limitations in access to health care and
medication, with consequent negative influence on adherence to treatment, are key drivers of this obser-vation. Despite the fact that access to health care is universal and free of charge in Brazil, patients with lower income share other difficulties such as financial burden with transportation to attend appointments and seek prompt care and purchase of concomitant drugs that are not provided by the government. Also, lack of health-related knowledge is associated with difficulties in understanding the beneficial effects of a balanced diet, physical activity, and adherence to treatment.4,36,37
Mortality in the general population is associ-ated with HDI.38 Interestingly, HDI has also been
correlated with transplant rates across countries.6
Remarkably, more than 95% of the patients included in this analysis were living in cities with high or very high HDI, with no difference between groups. Yet, the HDI of a city does not capture disparities within cities, such as highly developed regions surrounded by areas of significant poverty.
Variables
Univariable analysis
Multivariable analysis
Hazard Ratio
(95% CI) p
Hazard Ratio
(95% CI) p
Recipient age, per year 1.001 (0.988 - 1.013) 0.943
Recipient with history of diabetes 1.473 (1.049 - 2.068) 0.025 1.058 (0.734 - 1.526) 0.763
Renal replacement therapy
Preemptive (ref)
Hemodialysis 4.515 (1.118 - 18.227) 0.034 2.177 (0.524 - 9,040) 0.284
Peritoneal 6.028 (1.369 - 26.534) 0.018 4.348 (0.972 - 19.456) 0.055
Dialysis time, months 1.008 (1.004 - 1.012) < 0.001 1.005 (1.001 - 1.009) 0.019
Education
Secondary or higher (ref)
Secondary incomplete or lower 1.339 (0.961 - 1.865) 0.085
Profession
Employed (ref)
Unemployed 1.609 (1.182 - 2.190) 0.003 1.340 (0.966 - 1.858) 0.079
Distance to center 1.000 (0.999 - 1.000) 0.324
Donor age 1.002 (0.999 - 1.014) 0.790
Donor type
Living (ref)
Deceased 1.023 (0.704 - 1.487) 0.905
Delayed graft function, yes 1.473 (1.077 - 2.014) 0.015 1.029 (0.730 - 1.451) 0.868
Treated acute rejection, yes 1.246 (0.907 - 1.713) 0.175
Number of visits to the center, visits/month 1.743 (1.568 - 1.938) < 0.001 1.750 (1.574 - 1.946) < 0.001
Hospitalizations, yes 2.046 (1.315 - 3.184) 0.002 1.527 (0.947 - 2.463) 0.083
Days in hospital, days/month 1.011 (1.007 - 1.014) < 0.001 1.015 (1.011 - 1.018) < 0.001
TABLE 7 RISKFACTORSASSOCIATEDWITHDEATHDURINGTHE 5 YEARSOFFOLLOWUP
Period (months) 0-3 4-6 7-12 13-24 25-36 37-48 49-60 Total
Patients at risk 162 118 102 91 67 43 20
Deaths, n (%) 40 16 15 24 24 23 20 162
Cause, n (%)
Infection 20 (50) 9 (56) 9 (60) 9 (38) 16 (67) 10 (44) 12 (60) 85 (53)
Cardiovascular 14 (35) 6 (38) 2 (13) 7 (29) 2 (8) 5 (21) 4 (20) 40 (24)
Hemorrhagic shock 5 (13) 0 (0) 1 (7) 1 (4) 1 (4) 0 0 8 (5)
Malignant neoplasm 0 0 1 (7) 3 (12) 1 (4) 4 (18) 1 (5) 10 (6)
Nervous system 0 0 1 (7) 1 (4) 1 (4) 0 3 (2)
Undetermined 1 (2) 1 (6) 1 (7) 4 (17) 3 (13) 3 (13) 3 (15) 16 (10)
TABLE 6 DISTRIBUTIONOFTHECAUSESOFDEATHOVERTHE 5 YEARSOFFOLLOWUP
CONCLUSION
In summary, this analysis confirmed that infection is the leading cause of mortality over the first 5 years after kidney transplantation. Several demographic and socio-economic risk factors were associated with death, most
ABBREVIATIONS
4. Woodward RS, Page TF, Soares R, Schnitzler MA, Lentine KL, Brennan DC. Income-related disparities in kidney transplant graft failures are eliminated by Medicare’s immunosuppression coverage. Am J Transplant 2008;8:2636-46.5. Taber DJ, Hamedi M, Rodrigue JR, Gebregziabher MG, Srini-vas TR, Baliga PK, et al. Quantifying the Race Stratified Impact of Socioeconomics on Graft Outcomes in Kidney Transplant Recipients. Transplantation 2016;100:1550-7.
6. Garcia GG, Harden P, Chapman J. The global role of kidney transplantation. J Bras Nefrol 2012;34:1-7.
7. Canning D. Progress in Health Around the World. Human De-velopment Research Paper. New York: United Nations Develo-pment Programme; 2010. 61 p.
8. Office for National Statistics (ONS). Standard Occupational Classification 2010. Volume 3. The National Statistics Socio--economic Classification: (Rebased on the SOC2010); User Manual. London: ONSCrown copyright 2010. 79 p.
9. Opelz G, Döhler B, Ruhenstroth A, Cinca S, Unterrainer C, Stricker L, et al. The collaborative transplant study registry. Transplant Rev (Orlando) 2013;27:43-5.
10. Annual Data Report of the US Organ Procurement and Transplan-tation Network (OPTN) and the Scientific Registry of Transplant Recipients (SRTR). Introduction. Am J Transplant 2013;13:8-10. 11. Wolfe RA, Ashby VB, Milford EL, Ojo AO, Ettenger RE, Agodoa
LY, et al. Comparison of mortality in all patients on dialysis, pa-tients on dialysis awaiting transplantation, and recipients of a first cadaveric transplant. N Engl J Med 1999;341:1725-30.
12. Gill JS, Tonelli M, Johnson N, Kiberd B, Landsberg D, Perei-ra BJ. The impact of waiting time and comorbid conditions on the survival benefit of kidney transplantation. Kidney Int 2005;68:2345-51.
13. Lentine KL, Brennan DC, Schnitzler MA. Incidence and pre-dictors of myocardial infarction after kidney transplantation. J Am Soc Nephrol 2005;16:496-506.
14. El-Zoghby ZM, Stegall MD, Lager DJ, Kremers WK, Amer H, Gloor JM, et al. Identifying specific causes of kidney allograft loss. Am J Transplant 2009;9:527-35.
15. McDonald SP, Russ GR. Australian registries-ANZDATA and ANZOD. Transplant Rev (Orlando) 2013;27:46-9.
16. Linares L, Cofán F, Cervera C, Ricart MJ, Oppenheimer F, Cam-pistol JM, et al. Infection-related mortality in a large cohort of renal transplant recipients. Transplant Proc 2007;39:2225-7. 17. Harada KM, Mandia-Sampaio EL, de Sandes-Freitas TV,
Feli-pe CR, Park SI, Pinheiro-Machado PG, et al. Risk factors as-sociated with graft loss and patient survival after kidney trans-plantation. Transplant Proc 2009;41:3667-70.
18. Oliveira MI, Santos AM, Salgado Filho N. Survival analysis and associated factors to mortality of renal transplant recipients in a University Hospital in Maranhão. J Bras Nefrol 2012;34:216-25. 19. McIntyre CW, Rosansky SJ. Starting dialysis is dangerous: how
do we balance the risk? Kidney Int 2012;82:382-7.
20. Rabbat CG, Thorpe KE, Russell JD, Churchill DN. Comparison of mortality risk for dialysis patients and cadaveric first renal transplant recipients in Ontario, Canada. J Am Soc Nephrol 2000;11:917-22. 21. Cosio FG, Hickson LJ, Griffin MD, Stegall MD, Kudva Y. Pa-tient survival and cardiovascular risk after kidney transplanta-tion: the challenge of diabetes. Am J Transplant 2008;8:593-9. 22. ERA-EDTA Registry. ERA-EDTA Registry Annual Report
2015. Amsterdam: Academic Medical Center, Department of Medical Informatics; 2017.
23. United States Renal Data System. 2016 USRDS Annual Data Report: Epidemiology of kidney disease in the United States. Bethesda: National Institutes of Health, National Institute of Diabetes and Digestive and Kidney Diseases; 2016.
24. Yarlagadda SG, Coca SG, Formica RN Jr, Poggio ED, Parikh CR. Association between delayed graft function and allograft and patient survival: a systematic review and meta-analysis. Nephrol Dial Transplant 2009;24:1039-47.
25. Nashan B, Abbud-Filho M, Citterio F. Prediction, prevention, and management of delayed graft function: where are we now? Clin Transplant 2016;30:1198-208.
BLSD: Blood and lymphatic system disorders
BPAR: Biopsy proven acute rejection
CD: Cardiac disorders
CMV: Cytomegalovirus
CTCAE: Common terminology criteria for adverse events
DGF: Delay graft function
DE: Endocrine disorders
eGRF: Estimated glomerular filtration rate
GD: Gastrointestinal disorders
GDASC: General disorders and administration site condition
HD: Hepatobiliary disorders
HDI: Human development index
HLA: Human leukocyte antigen
I: Investigation
IID: Infections and infestation disorders
IPPC: Injury, poisoning and procedural complications
MCTD: Musculoskeletal and connective tissue disorder
MND: Metabolism and nutrition disorders
mTor: Mammalian target of rapamycin
NBMU: Neoplasms benign, malignant and unspecified (incl cysts and polyps)
NS: Nervous system
NS-SEC: National socio-economic classification
PD: Psychiatric disorders
r-ATG: Rabbit antithymocyte globulin
RTMD: Respiratory, thoracic and mediastinal disorders
RUD: Renal and urinary disorders
SAE: Serious adverse event
VD: Vascular disorderw
REFERENCES
1. de Castro Rodrigues Ferreira F, Cristelli MP, Paula MI, Proen-ça H, Felipe CR, Tedesco-Silva H, et al. Infectious complica-tions as the leading cause of death after kidney transplantation: analysis of more than 10,000 transplants from a single center. J Nephrol 2017;30:601-6.
2. Karim A, Farrugia D, Cheshire J, Mahboob S, Begaj I, Ray D, et al. Recipient age and risk for mortality after kidney trans-plantation in England. Transtrans-plantation 2014;97:832-8. 3. Gusukuma LW, Silva HT Jr, Pestana JO. Risk assessment score in
26. Al Otaibi T, Ahmadpoor P, Allawi AA, Habhab WT, Khatami MR, Nafar M, et al. Delayed Graft Function in Living-Donor Kidney Transplant: A Middle Eastern Perspective. Exp Clin Transplant 2016;14:1-11.
27. Ounissi M, Cherif M, Abdallah TB, Bacha M, Hedri H, Abder-rahim E, et al. Risk factors and consequences of delayed graft function. Saudi J Kidney Dis Transpl 2013;24:243-6.
28. Sáinz MM, Toro JC, Poblete HB, Perez LF, Nicovani VH, Car-rera MG. Incidence and factors associated with delayed graft function in renal transplantation at Carlos Van Buren Hospital, January 2000 to June 2008. Transplant Proc 2009;41:2655-8. 29. Shoskes DA, Halloran PF. Delayed graft function in renal
trans-plantation: etiology, management and long-term significance. J Urol 1996;155:1831-40.
30. Morales JM, Marcén R, del Castillo D, Andres A, Gonzalez-Moli-na M, Oppenheimer F, et al. Risk factors for graft loss and mortali-ty after renal transplantation according to recipient age: a prospec-tive multicentre study. Nephrol Dial Transplant 2012;27:iv39-46. 31. Moreso F, Alonso A, Gentil MA, González-Molina M,
Cap-devila L, Marcén R, et al. Improvement in late renal allograft survival between 1990 and 2002 in Spain: results from a multi-centre case-control study. Transpl Int 2010;23:907-13.
32. Jiang Y, Villeneuve PJ, Schaubel D, Mao Y, Rao P, Morrison H. Long-term follow-up of kidney transplant recipients: compari-son of hospitalization rates to the general population. Trans-plant Res 2013;2:15.
33. Moghani Lankarani M, Noorbala MH, Assari S. Causes of re--hospitalization in different post kidney transplantation perio-ds. Ann Transplant 2009;14:14-9.
34. Schold JD, Phelan MP, Buccini LD. Utility of Ecological Risk Factors for Evaluation of Transplant Center Performance. Am J Transplant 2017;17:617-21.
35. Gondos A, Döhler B, Brenner H, Opelz G. Kidney graft survi-val in Europe and the United States: strikingly different long--term outcomes. Transplantation 2013;95:267-74.
36. Miller TA. Health literacy and adherence to medical treatment in chronic and acute illness: A meta-analysis. Patient Educ Couns 2016;99:1079-86.
37. Pleasant A. Advancing health literacy measurement: a pathway to better health and health system performance. J Health Com-mun 2014;19:1481-96.