ABSTRACT:Objectives: To analyze the mortality trend in the Brazilian population aged between 5 and 69 years old, using the “Brazilian List of Causes of Preventable Deaths”. Methods: This is an ecological study that uses a time-series analysis of the standardized mortality rate for preventable and unpreventable causes in the period from 2000 to 2013, with corrections for ill-defined causes and the under-reporting of informed deaths. Results:
There was a decline in the mortality rate in the Brazilian population aged 5 to 69 due to preventable causes (1.6% per year) and unpreventable causes (1.4% per year), in addition to a decrease among all of the groups of causes of preventable deaths in the period from 2000 – 2013. The study draws attention to the increase in deaths from specific causes such as pneumonia (1.9% per year) and transportation accidents (0.6% per year), as well the stability in the number of deaths from aggression and intentional self-harm. Deaths from noncommunicable diseases fell by 2.2% per year and were highest in the age group of 60 – 69 years old in 2013 (209.9/100,000 inhabitants for ischemic heart disease deaths, 157.2/100,000 inhabitants for cerebrovascular diseases and 116.8/100,000 inhabitants for diabetes). Conclusion: The rates of preventable deaths are still high, especially for noncommunicable diseases and external causes. These causes of death are sensitive to health promotion interventions and, therefore, this study reinforces the need to remain focused on these causes of illness and death, as well as their risk factors.
Keywords: Premature Mortality. Causes of Death. Chronic Disease. External Causes. Public Health System. Prevention & Control.
Preventable deaths within Brazil’s
Public Health System in a population
from 5 to 69 years old, 2000 – 2013
Mortes evitáveis no Sistema Único de Saúde na
população brasileira, entre 5 e 69 anos, 2000 – 2013
Deborah Carvalho MaltaI, Rafaela Magalhães Fernandes SaltarelliII,
Rogério Ruscitto do PradoIII, Rosane Aparecida MonteiroIV, Márcia Furquim de AlmeidaIII ORiginAl ARTiCle / Artigo originAl
ISchool of Nursing, Universidade Federal de Minas Gerais – Belo Horizonte (MG), Brazil. IIDepartment of Medicine and Nursing, Universidade Federal de Viçosa – Viçosa (MG), Brazil. IIISchool of Public Health, Universidade de São Paulo – São Paulo (SP), Brazil.
IVSchool of Medicine, Universidade de São Paulo – Ribeirão Preto (SP), Brazil.
Corresponding author: Deborah Carvalho Malta. Universidade Federal de Minas Gerais, Escola de Enfermagem. Avenida Prof. Alfredo Balena, 190, CEP: 30130-100, Belo Horizonte, MG, Brasil. E-mail: dcmalta@uol.com.br
INTRODUCTION
Causes of preventable or reducible deaths are defined as those that can be totally or par-tially prevented by effective health service actions that are accessible in a given place and time1. Based on the studies of Ruststein et al.1, different authors used the concept of
pre-ventable deaths in developed countries in the 1980s and 1990s, establishing methodologies that are most appropriate for the classification of causes of preventable death. This, con-sidering that it is possible to prevent a premature death by preventing the onset of a disease or adequately treating it when it occurs2-5.
Over the years, the lists of causes of preventable deaths has changed depending on how health care practices and technologies available have evolved from changes in morbidity and mortality indicators and the life expectancy of populations5,6 .
In Brazil, in 2007, the first version of the “List of Causes of Preventable Deaths within the Public Health System (SUS)”, which resulted from the consensus of experts from vari-ous areas, was published7. This list used the studies of Rutstein et al.1, Tobias and Jackson4
and Ortiz8 as theoretical references. In addition, from these studies, it adopted the age of
74 as an age limit and the life expectancy of the Brazilian population.
The analysis of preventable death trends has been considered by different authors as a mechanism to evaluate the effectiveness of health care services1-6. There has been a reduction
in preventable deaths in Brasil9-15, however, studies that analyze trends in different age groups
are still rare. Most of them are concentrated on an analysis of death in childhood or death due to specific causes. Thus, this paper aimed to analyze the trend of causes of preventable
ReSUMO:Objetivos: Analisar a tendência da mortalidade na população brasileira de 5 a 69 anos, utilizando a “Lista Brasileira de Causas de Mortes Evitáveis”. Métodos: Trata-se de um estudo ecológico de séries temporais da taxa de mortalidade padronizada por causas evitáveis e não evitáveis no período de 2000 a 2013, com correções para as causas mal definidas e o sub-registro de óbitos informados. Resultados: Evidenciou-se declínio da taxa de mortalidade na população de 5 a 69 anos residente no Brasil por causas evitáveis (1,6% ao ano) e não evitáveis (1,4% ao ano), além de queda em todos os grupos de causas de mortes evitáveis no período 2000 – 2013. O estudo chama atenção para o aumento dos óbitos por causas específicas, como a pneumonia (1,9% ao ano) e os acidentes de transporte (0,6% ao ano), além de estabilidade para óbitos por agressões e lesões autoprovocadas intencionalmente. As mortes por doenças não transmissíveis reduziram 2,2% ao ano e foram mais elevadas na faixa etária de 60 a 69 anos em 2013 (209,9/100.000 hab. para as mortes por doenças isquêmicas do coração; 157,2/100.000 hab. para as doenças cerebrovasculares; e 116,8/100.000 hab. para o diabetes). Conclusão: As taxas de mortes evitáveis ainda são elevadas, principalmente para as doenças não transmissíveis e as causas externas. Essas causas de morte são sensíveis às intervenções de promoção da saúde e, portanto, este estudo reforça a necessidade de manter o foco nessas causas de adoecimento e de morte, além dos seus fatores de risco.
and unpreventable deaths in the Brazilian population and, specifically, in different age groups within the regions of Brazil.
METHODS
This is an ecological study with a time-series analysis regarding the mortality rate trend in the Brazilian population aged from 5 to 69 years old, according to preventability criteria in Brazil and its regions, from 2000 to 2013. The Mortality Information System (Sistema de Informação sobre Mortalidade — SIM) and the Brazilian Institute of Geography and Statistics (Instituto Brasileiro de Geografia e Estatística — IBGE) databases were utilized.
The trend analysis of preventable deaths (2000 - 2013) was performed using the “Brazilian List of Causes of Preventable Deaths” for the population aged 5 to 74 years old 7,14. The deaths
were classified according to the list into:
1. preventable causes and subgroups; and
2. non-preventable causes.
The original list provides for the inclusion of ill-defined causes of death. However, in the present study, these causes have been redistributed proportionally among all the defined causes. The causes of preventable deaths were divided into five subgroups, according to the type of health intervention, which was based on the technology available through SUS:
1. reducible by means of immunoprevention (subgroup 1);
2. reducible by means of health promotion, adequate prevention, control and attention to infectious diseases (subgroup 2);
3. reducible by means of health promotion, prevention, control and attention to non-communicable diseases (subgroup 3);
4. reducible by means of prevention, control and attention to causes of maternal death (subgroup 4);
5. reducible by means of intersectoral actions and health promotion, prevention and appropriate attention to external causes (accidents and violence) (subgroup 5) 14.
Despite the improvement in the quality of SIM data in recent years, there are still problems with under-registration and non-specific registration, such as poorly defined causes. Thus, two techniques were used in the preparation of the database.
The first technique consisted of correcting unrecorded deaths, as recommended by the study entitled “Active Search for Deaths and Births in the Northeast and in the Legal Amazon: an estimate of SIM and SINASC coverage in Brazilian municipalities”, which was developed by Szwarcwald et al.16. These data are available on the DATASUS website of the
Ministry of Health for the period from 2000 to 201317.
assumption that the distribution of poorly defined causes of death is similar to the distribu-tion of well-defined causes10,15. To do this, the methodology proposed by Ducan et al.15 was
adapted, since external causes were included in the redistribution of poorly-defined causes, based on a study by França et al. 8. This study, which analyzed investigations of deaths due
to poorly defined causes, demonstrated that the occurrence of violence and accidents were among the analyzed causes of death18. Thus, the redistribution of deaths within the total
number of ill-defined deaths, including external causes, was considered.
Both corrections were made for year strata (2000 to 2013), age group (5 to 9, 10 to 14, 15 to 19, 20 to 29, 30 to 39, 40 to 49, 50 to 59 and 60 to 69 years old) and region (North, Northeast, Southeast, South and Midwest). The corrected final mortality rate was standardized using the direct method, by gender and age, using the World Health Organization’s (WHO) standard world population.19
Defining the age limit at 69 years old was another methodological change, since the pre-vious list was set at 74 years old7,14. The conceptual basis aims to maintain comparability with
the goals of the WHO20, the Plan to Tackle Non-Communicable Diseases (NCDs)21 and the
Sustainable Development Objectives (Objetivos de Desenvolvimento Sustentável ODS) 22, which
establish 30 to 69 years old as the age group for indicating a premature death from NCDs. The Simple Linear Regression method was used to analyze the trend of mortality rates due to preventable causes and their subgroups, and the trend of mortality rates due to unpreventable causes. Data were presented in Excel spreadsheets for the years 2000, 2007 and 2013, but the regres-sion analysis was calculated using all of the years of the series (2000 to 2013). A residue analysis was used to evaluate the suitability of the model. The software used was the Statistical Package for Social Sciences - SPSS (Statistics Base), version 17. The level of statistical significance of 5% was accepted.
The average annual percentage reduction in mortality rate was calculated by the difference between consecutive year rates and then divided by the rate from the first year of the calcu-lation (multiplied by 100). The mean of the values found was defined as the annual reduc-tion in the period. The percentage of total reducreduc-tion for the period was calculated by sub-tracting the mortality rate for the year 2013 from the mortality rate of 2000, and dividing it by the 2000 year rate (multiplied by 100). The values of the mean annual reduction percent-age of the period were presented in the tables. The negative value represented the increase in the mortality rate and the positive value represented the decrease in the mortality rate.
This study followed ethical recommendations. A Free and Informed Consent Term (ICF) was not necessary, since secondary data was used that was available on the Ministry of Health’s official website. On the website, there is no information that can identify individuals.
RESULTS
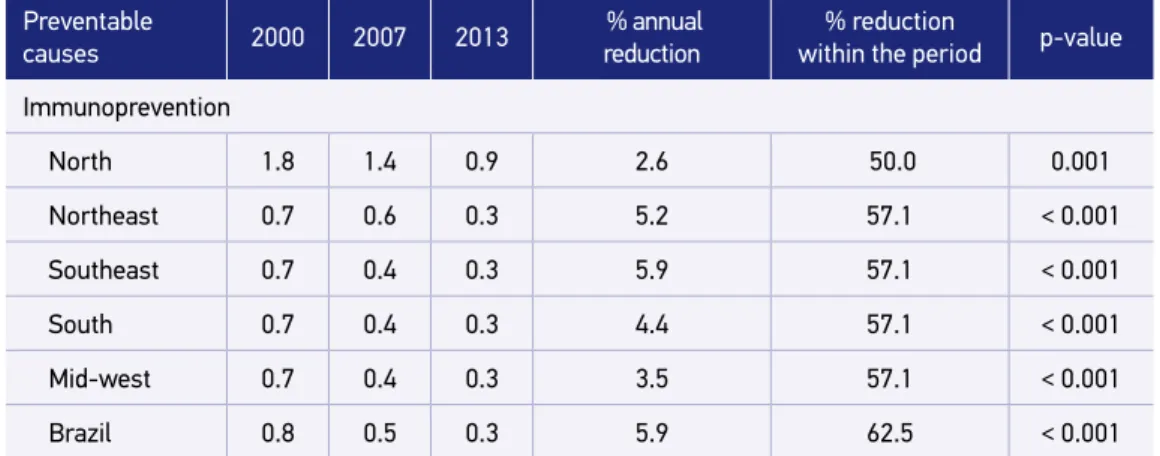
Table 1. Mortality rate, annual reduction and reduction percentage in the period from 2000 to 2013, per 100 thousand inhabitants, in the population aged 5 to 69 years old. Brazil and its regions, 2000, 2007 and 2013.
Continue... Preventable
causes 2000 2007 2013
% annual reduction
% reduction
within the period p-value
Immunoprevention
North 1.8 1.4 0.9 2.6 50.0 0.001
Northeast 0.7 0.6 0.3 5.2 57.1 < 0.001
Southeast 0.7 0.4 0.3 5.9 57.1 < 0.001
South 0.7 0.4 0.3 4.4 57.1 < 0.001
Mid-west 0.7 0.4 0.3 3.5 57.1 < 0.001
Brazil 0.8 0.5 0.3 5.9 62.5 < 0.001
Appropriate actions to promote health, prevention, control and attention to infectious diseases
North 39.7 38.9 37.9 0.2 4.5 0.002
Northeast 33.0 28.6 31.4 0.3 4.8 0.008
Southeast 40.2 36.2 36.7 0.7 8.7 0.001
South 28.4 28.3 29.0 -0.2 -2.1 0.227
Mid-west 28.0 28.3 26.7 0.3 4.6 0.600
Brazil 35.8 32.7 33.6 0.4 6.1 0.003
Appropriate actions to promote health, prevention, control and attention to non-communicable diseases
North 222.6 200.1 176.1 1.8 20.9 < 0.001
Northeast 226.3 213.8 192.2 1.2 15.1 < 0.001
Southeast 257.5 212.1 179.9 2.7 30.1 < 0.001
South 247.5 202.5 175.2 2.6 29.2 < 0.001
Mid-west 236.2 206.7 181.0 2.0 23.4 < 0.001
Brazil 244.8 210.1 182.1 2.2 25.6 < 0.001
Appropriate actions for the prevention, control, and attention to the causes of maternal death
North 2.4 1.8 1.8 1.7 25.0 0.001
Northeast 2.1 1.6 1.5 2.2 28.6 < 0.001
Southeast 1.0 0.8 0.9 0.6 10.0 0.752
South 1.1 0.9 0.7 3.3 36.4 < 0.001
Mid-west 0.9 0.9 1.1 -2.7 -22.2 0.225
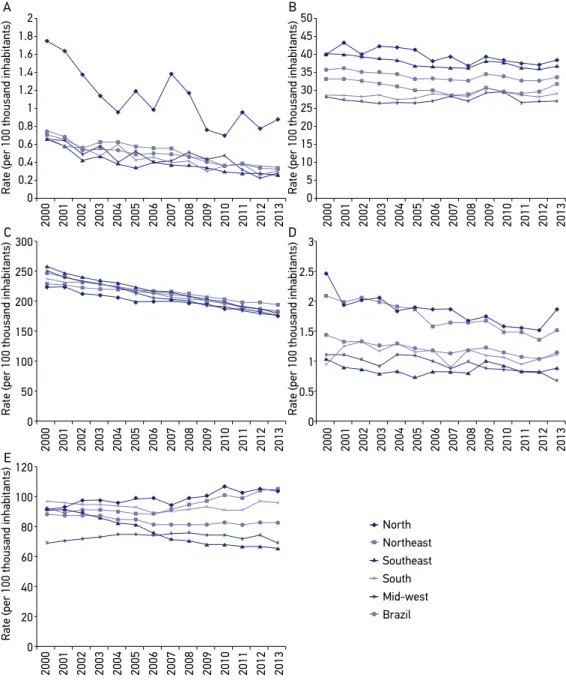
The mortality rate for the causes that could be reduced by appropriate actions promoting health, prevention, control and attention to infectious diseases in Brazil was 35.8 deaths per 100,000 inhabitants in 2000 and 33.6 in 2013, with a mean annual reduction of 0.4% and in the period, 6.1% (p = 0.003). Insignificant declines were observed in the Midwest and South regions (Table 1 and Figure 1B).
Deaths from preventable causes that could be reduced by appropriate actions promoting health, prevention, control, and attention to noncommunicable diseases ranked first in the causes of death in Brazil, with 244.8 deaths per 100,000 inhabitants in 2000 and 182.1 in 2013. There was an average annual reduction of 2.2% and 25.6% within the period (p <0.001). Decline trends occurred in all of the regions (Table 1 and Figure 1C).
The mortality rate for the causes that could be reduced by appropriate actions promot-ing prevention, control and attention to maternal diseases in Brazil were reduced 1.6% per year and 21.4% within the period (p <0.001). It went from 1.4 deaths per 100,000 inhabi-tants in 2000 to 1.1 deaths per 100,000 inhabiinhabi-tants in 2013. There was a downward trend in the South, Northeast and North regions, and a stable trend in the Midwest and Southeast. (Table 1 and Figure 1D).
In the group of causes that could be reduced by appropriate intersectoral actions aimed to promote health, prevention and attention to external causes, there was a small reduction of 0.5% per year and 6.4% within the period, with a mortality rate that changed from 87.9 deaths per 100,000 inhabitants in 2000 to 82.3 deaths per 100,000 inhabitants in 2013, and was ranked second in terms of magnitude (p = 0.001). Only in the Southeast was there a significant decline of 2.5% per year (p <0.001). On the other hand, the Northeast and North regions had a significant average annual increase of 1.1% and 1.0%, respectively (p <0.001). The South and Midwest regions remained stable (Table 1 and Figure 1E).
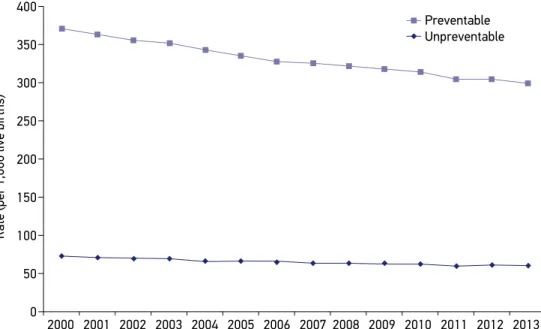
The mortality rate due to preventable causes in Brazil declined in the period from 2000 to 2013, from 370.6 / 100,000 inhabitants in 2000 to 299.5 / 100,000 inhabitants in 2013, with
Preventable
causes 2000 2007 2013
% annual reduction
% reduction
within the period p-value
Appropriate intersectoral actions for health promotion, prevention, and attention to external causes
North 91.8 94.2 103.3 -1.0 -12.5 < 0.001
Northeast 91.4 91.5 105.4 -1.1 -15.3 < 0.001
Southeast 90.8 73.0 65.0 2.5 28.4 < 0.001
South 70.0 74.7 69.2 0.1 1.1 0.682
Mid-west 95.6 89.5 96.6 -0.1 -1.0 0.587
Brazil 87.9 81.1 82.3 0.5 6.4 0.001
Table 1. Continuation.
an average reduction percentage of 1.6% per year and 19.2% within the period (p <0.001). Non-preventable causes of death diminished from 73.2 to 61.2 / 100,000 inhabitants in the same period, 1.4% per year and 16.4% within the period (p <0.001) (Figure 2).
2000 2001 2002 2003 2004 2005 2006 2007 2008 2009 2010 2011 2012 2013 2 1.8 1.6 1.4 1.2 1 0.8 0.6 0.4 0.2 0 300 250 200 150 100 50 0 120 100 80 60 40 20 0 3 2.5 2 1.5 1 0.5 0 50 45 40 35 30 25 20 15 10 5 0
2000 2001 2002 2003 2004 2005 2006 2007 2008 2009 2010 2011 2012 2013
2000 2001 2002 2003 2004 2005 2006 2007 2008 2009 2010 2011 2012 2013
2000 2001 2002 2003 2004 2005 2006 2007 2008 2009 2010 2011 2012 2013
2000 2001 2002 2003 2004 2005 2006 2007 2008 2009 2010 2011 2012 2013
North Northeast Southeast South Mid-west Brazil
Rate (per 100 thousand inhabitants)
Rate (per 100 thousand inhabitants)
Rate (per 100 thousand inhabitants)
Rate (per 100 thousand inhabitants)
Rate (per 100 thousand inhabitants)
A B
C D
E
Source: Mortality Information System – General Coordination of Epidemiological Information and Analysis/Department of Health Surveillance/Ministry of Health (SIM-CGIAE/SVS/MS).
Figure 2 (A - E) shows the evolution of mortality in Brazil and its regions during the period from 2000-2013, for the population aged 5 to 69 years old, according to a group of preventable causes. In most groups, the rate in Brazil and its regions declined, except with regard to external causes, which increased in the North and Northeast regions.
The standardized mortality rates for the main causes of specific deaths in each group of preventable deaths for the age range of 5 to 69 years are shown in Table 2. Behavior significantly decreased for all of them except pneumonia and transportation accidents, which had a mean annual increase of 1.9% (p <0.001) and 0.6% (p = 0.009), respectively. Mortality remained stable in the period for aggression (p = 0.256) and intentionally self-inflicted injuries (suicide) (p = 0.194) (Table 2).
Table 3 presents the specific mortality rate in 2013 for the main causes of preventable deaths in each age group of the Brazilian population. The rates for preventable causes of immunoprevention actions (miliary tuberculosis, acute hepatitis B and tetanus) in all age groups are low. Among the causes of attention to infectious diseases, pneumonia occurred more in the age group of 60 - 69 years old. HIV (Human Immunodeficiency Virus) occurred more often in the age group between 40 and 49 years old, and intestinal infectious diseases occurred more often in the age group between 60-69 years old. Non-communicable diseases were the greatest in number. They increased during life, and especially after 40 - 49 years old, reaching higher rates between 60 - 69 years old: 209.9/100,000 inhabitants for ischemic heart diseases, 157.2/100,000 inhabitants for cerebrovascular diseases, and 116.8/100,000 inhabitants for diabetes. The causes of death that are preventable by attention actions aimed at external causes also present high rates. Aggressions predominated in the age group of 15
Preventable Unpreventable
Rate (per 1,000 live births)
400
350
300
250
200
150
100
50
0
2000 2001 2002 2003 2004 2005 2006 2007 2008 2009 2010 2011 2012 2013
to 39 years old, transport accidents, between 15 and 69 years old, and intentionally self-in-flicted injuries (suicide), in the range of 20 to 69 years old (Table 3).
DISCUSSION
The study showed a decline in the mortality rate from preventable and unpreventable causes in the Brazilian population aged 5 to 69 between 2000 and 2013. In 2013, a total of 588,675 deaths was recorded in all SIMs in the mentioned population, of which 431,930 (73.4%) were due to preventable causes. The percentage of decline was similar for preventable and
Table 2. Standardized and corrected mortality rates and the percentages of average annual reduction per 100,000 inhabitants, in the population aged 5 to 69 years old, according to the main specific basic causes of death that are preventable by the Public Health System. Brazil and its regions, 2000, 2007 and 2013.
Preventable causes 2000 2007 2013 % average
annual reduction p-value
Immunoprevention
Miliary tuberculosis 0.3 0.1 0.1 4.2 < 0.001
Acute hepatitis B 0.3 0.2 0.1 4.2 0.003
Tetanus 0.2 0.1 0.1 7.1 < 0.001
Attention actions for infectious diseases
Pneumonia 10.1 10.7 12.6 -1.9 < 0.001
Diseases from HIV 8.6 7.9 7.5 1.0 < 0.001
Intestinal infectious diseases 1.3 1.0 0.8 3.3 < 0.001
Other infections 5.5 4.4 4.4 1.5 < 0.001
Attention actions for non-communicable diseases
Ischemic heart diseases 44.2 37.6 32.8 2.2 < 0.001
Cerebrovascular diseases 43.3 31.5 24.0 4.4 < 0.001
Diabetes 20.7 18.2 16.1 1.9 < 0.001
Attention actions for maternal causes of death 1.4 1.1 1.1 1.6 < 0.001
Attention actions for external causes of death
Aggressions 33.7 31.6 34.7 -0.3 0.256
Transport accidents 23.6 25.0 25.1 -0.6 0.009
Self-inflicted injuries 5.5 5.9 6.1 -0.9 0.194
HIV: Human Immunodeficiency Virus
non-preventable causes, however, preventable mortality rates were five times higher than non-preventable mortality rates. In addition, there was a decline within all of the groups with regard to causes of preventable deaths, which reflects an improvements in the services offered by SUS that contribute to the prevention of these deaths.
The number of preventable deaths within the group of non-communicable diseases stands out. It had the highest rates throughout the analyzed period in Brazil and all of its regions. NCDs are one of the greatest public health problems because they cause a high
Table 3. Specific mortality rate for the main specific basic causes of death that are preventable by the Public Health System, per 100 thousand inhabitants, according to the age range in the population aged 5 to 69 years old. Brazil, 2013*.
Preventable causes
2013
Age range (years)
05 – 09 10 – 14 15 – 19 20 – 29 30 – 39 40 – 49 50 – 59 60 – 69
Immunoprevention
Miliary tuberculosis 0.0 0.0 0.0 0.1 0.1 0.2 0.4 0.3
Acute hepatitis B 0.0 0.0 0.0 0.0 0.1 0.2 0.3 0.4
Tetanus 0.0 0.0 0.0 0.0 0.0 0.1 0.1 0.3
Attention actions for infectious diseases
Pneumonia 1.4 1.3 2.1 2.8 5.9 13.3 28.2 69.3
Diseases from HIV 0.1 0.1 0.8 5.3 12.5 16.4 11.6 7.1
Intestinal infectious
diseases 0.3 0.2 0.2 0.2 0.4 0.8 1.9 4.0
Other infections 0.9 0.6 1.1 1.2 2.0 4.4 10.1 22.7
Attention actions for non-communicable diseases
Ischemic heart diseases 0.0 0.2 0.8 1.9 7.2 30.5 89.7 209.9
Cerebrovascular
diseases 0.3 0.6 1.2 1.9 6.3 22.6 58.8 157.2
Diabetes mellitus 0.1 0.2 0.5 1.2 3.2 11.5 38.4 116.8
Attention actions for external causes of death
Aggressions 0.7 4.9 63.6 69.9 44.5 28.1 17.9 11.8
Transport accidents 3.7 5.1 23.2 34.7 30.1 30.3 28.8 31.2
Self-inflicted injuries 0.0 0.8 4.4 7.3 7.9 8.7 8.3 8.0
HIV: Human Immunodeficiency Virus; *The maternal mortality rate is not included, since it is a specific rate for the female population.
number of premature deaths, a diminished quality of life with many limitations, an inca-pacity for activities of daily living, as well as economic impacts for families, communities and society as a whole23,24.
Faced with this worldwide problem, in 2011 the United Nations (UN) established commitments to address NCDs, and in 2012, the WHO approved a global action plan for the prevention and control of these diseases20. This global plan defined a priority goal to reduce the
prema-ture mortality rate for NCDs between the ages of 30 and 70 years old by 25% until 202520.
This global goal is in line with the national goal defined by the 2011-2022 Plan to Tackle Non-communicable Diseases, which aims to reduce premature mortality rates (for people 30 to 69 years of age) by 2% per year by 202221.
Studies demonstrate Brazil’s ability to achieve this goal and reducing this indicator, since they deal with diseases that are easily effected by health promotion interventions and assis-tance25,26. The current study corroborates this data, as it also found a reduction of deaths due
to preventable non-communicable diseases (2.2% per year) in the population aged 5 to 69 years old. This positive result is directly related to the implementation of highly cost-effective SUS interventions, such as the control of tobacco and the distribution of drugs to the sec-tion of the populasec-tion with a high risk of developing cardiovascular diseases25,26.
On the other hand, the group of preventable deaths due to immunoprevention had the lowest rates compared to the others. In addition, there was a reduction in the num-ber of deaths from these causes in Brazil and all of its federative units (FU). This result demonstrates the advances observed due to the incorporation of numerous vaccines with the implementation of the National Immunization Program (Programa Nacional de Imunização- PNI) calendar27.
Regarding the mortality rate for infectious diseases, there was a significant reduction (0.4%) in Brazil and specifically in the North, Northeast and Southeast regions, while in the South and Midwest, rates stayed the same within the period. Data in Brazil show that, although the proportion of total deaths caused by infectious diseases has dropped from 50% to 5% over the last 80 years, they are still an important public health problem28. This reduction
has been more pronounced in some infectious diseases rather than in others. Data show-ing an increase in pneumonia, with very high rates among 60-69 year olds, are worryshow-ing.
If, on the one hand, the expansion of access to health services can reduce deaths from infectious diseases, on the other hand, greater access to the hospital system, the use of more-advanced technology and the greater frequency of invasive interventions can lead to the increase of deaths from hospital infections, as in the case of pneumonia28.
External causes increased in the North and Northeast regions. First on the list were aggressions, followed by transportation accidents and self-inflicted injuries. The increase in transportation accidents, especially motorcycle accidents in the Northeast region and in small towns, has been highlighted in other studies that analyzed the deaths reported in SIM31,32.
These deaths have been attributed to the increase in motor vehicles, the lack of inspec-tion, the precariousness of public transport, and infrastructure problems, among others33.
The country’s results differ from those in other countries, such as Australia, France, Japan, Sweden, Canada and the United States33.
In general, the studies show that deaths due to external causes, aggressions and traffic injuries, predominantly affected black males aged between 20 and 39 years31. This can be
attributed to the young men’s exposure to situations of great risk, such as alcohol con-sumption, drugs, trafficking, aggressive behavior, urban violence, laborious work activities, and the dangerous driving of motor vehicles. With regard to race, there is a relationship between the higher number of deaths and the vulnerability of black people living within adverse social conditions31.
The present study considered the age limit of preventability at 69 years old, which is in line with the Action Plan Strategies for Tackling Non-Communicable Diseases20,21,24 and the
ODS’ goals for reducing premature mortality – between 30 and 69 years of age for NCDs - by 30 % before 203022. Defining the age limit for the analysis of preventable causes is
par-tially arbitrary as it is motivated in part by the average life expectancy of the population, and cannot be interpreted as the absence of preventable events outside the defined age range6,7.
Previous studies defined 65 years old to be the upper limit of preventability,1,2 while others
adopted 75 years old4,5.
Within the limits of this study, the use of preventability lists should be considered. The lists may vary according to advancements in knowledge and the use of new technologies, in addition to the need to answer if, in fact, the proposed causes can be impacted by effective health measures. Another limit refers to the use of SIM data that, even if they are corrected, may still be subject to under-registration.
The study found similar reductions in preventable and unpreventable deaths even though a more expressive reduction of only preventable deaths was expected2. This may be due to
the general decline in mortality trends in the country, stemming not only from causes of death related to health services, or conditions included on the preventability list, but also from the increase of general improvements in life, such as better economic and social con-ditions, the reduction of inequality, the investment in social programs related to income distribution, and the decline in fertility, all of which affect causes of death30. As such,
eco-logical studies may not explain all social phenomena6.
CONCLUSION
of ill-defined causes, and the alteration of the age limit for the analysis of preventable deaths, following NCD tackling goals, all of which can be considered methodological improvements.
In Brazil, there was a decline in mortality rates in the age range between 5 and 69 years old in all groups of preventable causes of death related to SUS interventions. There has been a significant decline in non-communicable diseases, which have been the main cause of pre-ventable deaths. This demonstrates the likelihood of achieving global targets set for tackling NCDs. However, the adverse trends of most risk factors present a major challenge and require additional and timely actions and policies, especially legislative and regulatory ones, in addition to those that provide cost-effective attention to chronic conditions for individuals with NCDs25.
External causes of death present a great challenge and their complexity involves the phe-nomenon of external causes, which demands joint actions among various sectors (health, education, judiciary, transit services, and social services, among others).
The preventability of deaths due to immunoprevention revealed the advances achieved by the PNI and the improvement in basic care. Preventable death trend studies are a useful methodology for the planning of public policies.
ACKNOWLEDGEMENTS
Deborah Carvalho Malta is thankful for the productivity grant from the National Council for Scientific and Technological Development (Conselho Nacional de Desenvolvimento Científico e Tecnológico — CNPq) and the Foundation for Research Support of the State of Minas Gerais (Fundação de Amparo à Pesquisa do Estado de Minas Gerais — FAPEMIG) for the financial support on the preventable deaths project, Researcher Mineiro grant (PPM) 2016 / 2, Case No. 00095-2016.
1. Rutstein DD, Berenberg W, Chalmers TC, Child CG, Fishman AP, Perrin EB. Measuring quality of medical care: a clinical method. N Engl J Med 1976; 294(11): 582-8. DOI: 10.1056/NEJM197603112941104 2. Charlton JR, Velez R. Some international comparisons
of mortality amenable to medical intervention. Br Med J 1986; 292(6516): 295-301.
3. Holland WW, Fitzgerald AP, Hildrey SJ, Phillips SJ. Heaven can wait. J Public Health Med 1994; 16: 321-30. 4. Tobias M, Jackson G. Avoidable mortality in New
Zealand, 1981-97. Aust N Z J Public Health 2001; 25(1): 12-20. DOI: 10.1111/j.1467-842X.2001.tb00543.x 5. Nolte E, Mckee M. Does health care save lives? Avoidable
mortality revisited. London: Nuffield Trust; 2004. 6. Malta DC, Duarte EC. Causas de mortes evitáveis por
ações efetivas dos serviços de saúde: uma revisão da
literatura. Ciênc Saúde Coletiva 2007; 12(3): 765-76. DOI: 10.1590/S1413-81232007000300027
7. Malta DC, Duarte EC, Almeida MF, Dias MA, Morais Neto OL, Moura L, et al. Lista de causas de mortes evitáveis por intervenções do Sistema Único de Saúde do Brasil. Epidemiol Serv Saúde 2007; 16(4): 233-44. DOI: 10.5123/S1679-49742007000400002
8. Ortiz LP. Agrupamento das causas evitáveis de morte dos menores de um ano segundo critério de evitabilidade das doenças. São Paulo: Fundação SEADE 2000. 9. Malta DC, Duarte EC, Escalante JJ, Almeida MF,
Sardinha LM, Macário EM, et al. Mortes evitáveis em menores de um ano, Brasil, 1997 a 2006: contribuições para a avaliação de desempenho do Sistema Único de Saúde. Cad Saúde Pública 2010; 26(3): 481-91. DOI: 10.1590/S0102-311X2010000300006
10. Soares GP, Brum JD, Oliveira GM, Klein CH, Silva NA. Mortalidade por todas as causas e por doenças cardiovasculares em três estados do Brasil, 1980 a 2006. Rev Panam Salud Publica 2010; 28(4): 258-66. DOI: 10.1590/S1020-49892010001000004
11. Malta DC, Moura L, Prado RR, Escalante JC, Schmidt MI, Duncan BB. Mortalidade por doenças crônicas não transmissíveis no Brasil e suas regiões, 2000 a 2011. Epidemiol Serv Saúde 2014; 23(4): 599-608. DOI: 10.5123/S1679-49742014000400002
12. Villela LM, Gomes FE, Meléndez JG. Tendência da mortalidade por doenças cardiovasculares, isquêmicas do coração e cerebrovasculares. Rev Enferm UFPE 2014; 8(9): 3134-41. DOI: 10.5205/ reuol.5960-55386-1-ED.0809201423
13. Abreu DM, Drumond EF, França EB, Ishitami LH, Malta DC, Machado CJ. Análise comparativa de classificações de causas evitáveis de morte em capitais Brasileiras: o caso das doenças cerebrovasculares. Rev Bras Estud Popul 2010; 27(2): 447-55. DOI: 10.1590/ S0102-30982010000200014
14. Malta DC, França E, Abreu DX, Oliveira H, Monteiro RA, Sardinha LM, et al. Atualização da lista de causas de mortes evitáveis (5 a 74 anos de idade) por intervenções do Sistema Único de Saúde do Brasil. Epidemiol Serv Saúde 2011; 20(3): 409-12. DOI: 10.5123/S1679-49742011000300016
15. Duncan BB, Stevens A, Iser BP, Malta DC, Silva GA, Schmidt MI. Saúde Brasil 2010: uma análise da situação de saúde e de evidências selecionadas de impacto de ações de vigilância em saúde. Mortalidade por doenças crônicas no Brasil: situação em 2009 e tendências de 1991 a 2009. Brasília: Ministério da Saúde; 2011. p. 119-33.
16. Szwarcwald CL, Morais Neto OL, Frias PG, Souza Junior PR, Escalante JJ, Lima RB, et al. Saúde Brasil 2010: uma análise da situação de saúde e de evidências selecionadas de impacto de ações de vigilância em saúde. Busca ativa de óbitos e nascimentos no Nordeste e na Amazônia Legal: estimação das coberturas do SIM e do SINASC nos municípios brasileiros. Brasília: Ministério da Saúde; 2011: 79-97.
17. Brasil. Ministério da Saúde. Secretaria de Vigilância em Saúde. Coordenação-Geral de Informações e Análises Epidemiológicas. Sistema de Informação sobre Mortalidade. Disponível em: http://tabnet. datasus.gov.br/cgi/deftohtm.exe?obitocorr/cnv/ obitocorr.def (Acessado em 28 de outubro de 2017). 18. França E, Teixeira R, Ishitani L, Duncan BB, Cortez-Escalante JJ, Morais Neto OL, et al. Causas mal definidas de óbito no Brasil: método de redistribuição baseado na investigação do óbito. Rev Saúde Pública 2014; 48(4): 671-81. DOI: 10.1590/S0034-8910.2014048005146
19. Ahmad OB, Boschi-Pinto C, Lopez AD, Murray CJ, Lozano R, Inoue M. Age standardization of rates: a new WHO standard. Geneva: WHO; 2001. 20. World Health Organization (WHO). Global action
plan 2013-2020: for the prevention and control of noncommunicable diseases. Geneva: WHO; 2013. 21. Malta DC, Silva Júnior JB. O plano de ações estratégicas
para o enfrentamento das doenças crônicas não transmissíveis no Brasil e a definição das metas globais para o enfrentamento dessas doenças até 2025: uma revisão. Epidemiol Serv Saúde 2013; 22(1): 151-64. DOI: 10.5123/S1679-49742013000100016
22. Nações Unidas no Brasil (ONU-BR). Objetivos de Desenvolvimento Sustentável (ODS): Assegurar uma vida saudável e promover o bem-estar para todas e todos, em todas as idades. [Internet]. Disponível em: https://nacoesunidas.org/pos2015/ods3/ (Acessado em 5 de janeiro de 2016).
23. Brasil. Ministério da Saúde. Saúde Brasil 2013: uma análise da situação de saúde e das doenças transmissíveis relacionadas à pobreza. Brasília: Ministério da Saúde; 2014p. 384. 24. Malta DC, Morais Neto OL, Silva Junior JB.
Apresentação do plano de ações estratégicas para o enfrentamento das doenças crônicas não transmissíveis no Brasil, 2011 a 2022. Epidemiol Serv Saúde 2011; 20(4), 425-38. DOI: 10.5123/S1679-49742011000400002 25. Schmidt MI, Duncan BB, Silva GA, Menezes AM,
Monteiro CA, Barreto SM, et al. Chronic non-communicable diseases in Brazil: burden and current challenges. Lancet 2011; 377(9781): 1949-61. DOI: 10.1016/S0140-6736(11)60135-9
26. Malta DC, Andrade SSCA, Oliveira TP, Moura L, Prado RR, Souza MFM. Probabilidade de morte prematura por doenças crônicas não transmissíveis, Brasil e Regiões, projeções para 2025. Rev Bras Epidemiol 2016. 27. Domingues CM, Teixeira AM. Coberturas vacinais e
doenças imunopreveníveis no Brasil no período 1982-2012: avanços e desafios do Programa Nacional de Imunizações. Epidemiol Serv Saúde 2013; 22(1): 9-27. DOI: 10.5123/S1679-49742013000100002
28. Barreto ML, Teixeira MG, Bastos FI, Ximenes RA, Barata RB, Rodrigues LC. Sucessos e fracassos no controle de doenças infecciosas no Brasil: o contexto social e ambiental, políticas, intervenções e necessidades de pesquisa. Lancet 2011; 377: 1877-89. DOI: 10.1016/S0140-6736(11)60202-X 29. Souza JP, Tunçalp Ö, Vogel JP, Bohren M, Widmer M, Oladapo OT, et al. Obstetric tran sition: the pathway towards ending prevent able maternal deaths. BJOG 2014; 121(Suppl1): 1-4. DOI: 10.1111/1471-0528.12735 30. Victora CG, Aquino EM, Leal MC, Monteiro CA,
31. Brasil. Ministério da Saúde. Saúde Brasil 2014: uma análise da situação de saúde e das causas externas. Brasília: Ministério da Saúde; 2015, p. 462.
32. Morais Neto OL, Montenegro MM, Monteiro RA, Siqueira Júnior JB, Silva MM, Lima CM, et al. Mortalidade por acidentes de transporte terrestre no Brasil na última década: tendência e aglomerados de risco. Ciênc Saúde Coletiva 2012; 17(9): 2223-36. DOI: 10.1590/S1413-81232012000900002
33. World Health Organization (WHO). Global status report on road safety: time for action. Geneva: WHO; 2009. Disponível em: http://www.who.int/violence_ injury_prevention/road_safety_status/2009 (Acessado em 30 de abril de 2012).
Received on: 04/02/2017
Final version presented on: 06/17/2017 Accepted on: 06/25/2017