Trends in corrected lung cancer mortality
rates in Brazil and regions
Deborah Carvalho MaltaI, Daisy Maria Xavier de AbreuII, Lenildo de MouraIII, Gustavo C LanaIV, Gulnar AzevedoV, Elisabeth FrançaVI
I Departamento Materno-Infantil e de Saúde Pública. Escola de Enfermagem. Universidade Federal de Minas
Gerais. Belo Horizonte, MG, Brasil
II Núcleo de Educação em Saúde Coletiva. Faculdade de Medicina. Universidade Federal de Minas Gerais. Belo
Horizonte, MG, Brasil
III Organização Pan Americana de Saúde. Brasília, DF, Brasil
IV Programa de Pós-Graduação em Estatística. Instituto de Ciências Exatas. Universidade Federal de Minas Gerais.
Belo Horizonte, MG, Brasil
V Instituto de Medicina Social. Universidade do Estado do Rio de Janeiro. Rio de Janeiro, RJ, Brasil VI Programa de Pós-Graduação em Saúde Pública. Faculdade de Medicina. Universidade Federal de Minas
Gerais. Belo Horizonte, MG, Brasil
ABSTRACT
OBJECTIVE: To describe the trend in cancer mortality rates in Brazil and regions before and after correction for underreporting of deaths and redistribution of ill-deined and nonspeciic causes. METHODS: he study used data of deaths from lung cancer among the population aged from 30 to 69 years, notiied to the Mortality Information System between 1996 and 2011, corrected for underreporting of deaths, non-registered sex and age , and causes with ill-deined or garbage codes according to sex, age, and region. Standardized rates were calculated by age for raw and corrected data. An analysis of time trend in lung cancer mortality was carried out using the regression model with autoregressive errors.
RESULTS: Lung cancer in Brazil presented higher rates among men compared to women, and the South region showed the highest death risk in 1996 and 2011. Mortality showed a trend of reduction for males and increase for women.
CONCLUSIONS: Lung cancer in Brazil presented diferent distribution patterns according to sex, with higher rates among men and a reduction in the mortality trend for men and increase for women.
DESCRIPTORS: Lung Neoplasms, mortality. Mortality, trends. Underregistration. Mortality Registries. Correspondence:
Deborah Carvalho Malta Departamento de Enfermagem Materno-Infantil e de Saúde Pública Escola de Enfermagem – UFMG Av. Alfredo Balena, 190 30130-100 Belo Horizonte, MG, Brasil
E-mail: [email protected]
Received: 21 Feb 2015 Approved: 20 Jul 2015
How to cite: Malta DC, Abreu DMX, Moura L, Lana GC, Azevedo G, França E. Trends in corrected lung cancer mortality rates in Brazil and regions. Rev Saude Publica. 2016;50:33.
Copyright: This is an open-access article distributed under the terms of the Creative Commons Attribution License, which permits unrestricted use, distribution, and reproduction in any medium, provided that the original author and source are credited.
INTRODUCTION
Cancer is a public health issue and ranks second in mortality around the world; in some
developed countries, it has become the irst leading cause of deatha. Among neoplams, lung
cancer has been the most common type worldwide for several decadesb. According to the
World Health Organization (WHO), in 2012 there were approximately 1.8 million new cases of lung cancer, or 13.0% of total cancer, of which 58.0% occurred in developing countries.
It is estimated that growth rates grows 2.0% every yearb.
he ive-year survival rate for this disease ranges from 13.0% to 21.0% in developed countries, and from 7.0% to 10.0% in developing countries. Overall diferences are greater in incidence, mortality and survival, and, in general, geographic patterns of mortality accompany those
related to incidenceb. In Brazil, lung cancer is the leading cause of death from cancer among
men and the second among women. In 2011, it caused 22,424 deaths in all ages, 13,698 among
men and 8,726 among womenc.
he association between smoking and lung cancer was irst suggested in England, in 19274,22.
Later studies showed that the interruption of smoking reduces the risk of lung cancerd.
herefore, studies show that incidence rates of lung cancer in a given country relect the
prevalence of smoking among its populationb,d.
Although it still prevails as the leading cause of deaths by cancer worldwide3,7, lung cancer
mortality rates have decreased. his decrease is heterogeneous and mortality from lung cancer in Eastern Europe, China and other developing countries is still increasing among
both sexes21,b. In Brazil, in 1989, the Pesquisa Nacional em Saúde e Nutrição (National Health and Nutrition Survey) collected nationally representative data on smoking for the irst time and found prevalence of 40.0% among men and 26.0% among women in the population over
15 years of age16. Since 2006, the Brazilian Noncommunicable Diseases Surveillance System
(VIGITEL) has annually monitored the prevalence of smoking in the adult population in state capitals, and the results indicate decreasing trends among men and women, reaching in 2013 the average value of 11.3%, higher among men (14.4%) than women (8.6%). However, in some capitals in the South and Southeast regions, prevalence of smoking among women
is already approaching the rates observed among men13,e.
At the World Health Assembly in 2014, WHO endorsed the Global Action Plan for the
Prevention and Control of Noncommunicable Diseasese, which establishes a commitment
among countries to reduce mortality in the four groups of noncommunicable diseases
(NCD) to 25.0% by 2025, and to continuously monitor trends and improve data quality. Data improvement is especially relevant for Brazil, since, despite the consolidation of the Mortality Information System (SIM), there is still underreporting of deaths and a high proportion of deaths recorded with ill-deined causes in some regions of the country. herefore, analysis
of the magnitude of mortality rates must consider the underreporting of deaths and the
occurrence of ill-deined or garbage codes, as they introduce a bias in comparisons between areas with diferences in quality of information on deaths and in time trend studies.
Considering the importance of lung cancer in the epidemiological proile of the Brazilian
population18 and the persisting problems regarding the quality of death reports in the country,
mortality analyses should incorporate methods to correct underreporting of deaths and
redistribute ill-deined and nonspeciic causes of death. Following such adjustments, time analyses aimed at determining the existence of signiicant increasing or decreasing trends are important to assess whether mortality rate reduction targets are being met. Diferent results over the years may be merely the result of random luctuation, and not of actual improvements or setbacks.
he aim of this study was to describe the trends in lung cancer mortality in Brazil and regions before and after correction for underreporting of deaths and redistribution of ill-deined and nonspeciic causes.
a World Health Organization.
Global status report on
noncommunicable diseases 2010 [Internet]. Geneva: World Health Organization; 2011 p. 176.
b International Agency for
Research on Cancer. Lung Cancer: estimated incidence, mortality and prevalence worldwide in 2012. Lyon: International Agency for Research on Cancer; 2012 [cited 14 Nov 2014]. Available from: http://globocan.iarc.fr/Pages/fact_ sheets_cancer.aspx?cancer=lung
c Ministério da Saúde. SIM -
Sistema de Informação sobre Mortalidade. Brasília (DF); 2008 [cited 14 Nov 2014]. Available from: http://www2. datasus.gov.br/DATASUS/index. php?area=060701
d World Health Organization.
WHO report on the global tobacco epidemic, 2011: warning about the dangers of tobacco. Geneva: World Health Organization; 2011 [cited 14 Nov 2014]. Available from: http://www.who.int/tobacco/ global_report/2011/en
e World Health Organization.
METHODS
his study is a time series analysis of mortality based on deaths reported to SIM between 1996 and 2011, available online from the Brazilian Uniied Health System Information Department
(DATASUS)b. he age group from 30 to 69 years was selected for the study, due to the priority
given to monitoring deaths considered premature, as recommended by WHO in the Global
Action Plan for the Prevention and Control of NCDe and the strategic action plan for the
prevention and control of noncommunicable diseases in Brazil12,f.
he codes of the International Classiication of Disease (ICD-10) considered for trachea, bronchus and lung cancer were: C33-C34.9, D02.1-D02.2, D38.1. Raw data of deaths reported to SIM were corrected according to the following methodological procedures:
• Step 1: imputation of deaths with non-registered sex or age;
• Step 2: redistribution of some nonspeciic causes allocated in the chapters of deined causes
of ICD-10 (all chapters except Chapter XVIII), here called “garbage” codes, by sex and region;
• Step 3: redistribution of death causes allocated in Chapter XVIII of ICD-10 of ill-deined
causes (IDC), by sex, age group and region;
• Step 4: correction of underreporting of deaths, with computation of total deaths corrected
for underreporting in each ive-year age group of 30 to 69 years by sex, and allocation of the proportion of the speciic causes corrected in the previous steps.
he speciic rates by cause were calculated in the ive-year age groups by sex and region for the data corrected in the described steps above. To analyze the rates of the total 30-69 age group, standardization was carried out using the direct method of speciic rates by cause (corrected) of the age groups for Brazil and the diferent regions, by sex. hese rates were then used for the analysis of time trends from 1996 to 2011.
Following the evaluation of the list of causes and the garbage code list of the Global Burden
of Disease 2010 Study (GBD-2010)10,17, speciics ICD-10 codes were deined to be included in
each grouping of garbage codes, with redistribution criteria for the target diseases or target codes. Table 1 details the ICD-10 codes that were included in each group of garbage codes.
In this study, however, IDC (ICD-10 R codes) were redistributed according to the methodology proposed by França et al.5, which considers the availability of information on death certiicate investigationsof IDC carried out by Brazilian state and municipal health departments since 2006. he procedure of redistributing IDC according to investigation results was used for the period 2006-2011, based on percentages of NCD found among the reclassiied IDC from each year. Given that these investigations were not initiated before 2006, the average redistribution values for the period 2006-2011 were used for the period 1996-2005.
Correction of underreporting of deaths in Brazil and regions was carried out using the estimates provided by the Health Interagency Information Network (RIPSA) for Brazil and regions of total deaths for the period 1996-2011, for both sexesg. For the period 1996-1999, RIPSA used the
underreporting correction factors based on the ratio between the number of deaths reported to SIM and the number of deaths estimated by IBGE. Between 2000 and 2011, the correction factors were based on the number of deaths estimated by an active search for unreported
deaths and births20. Although the factors estimated through active searching are considered more reliable, this method had only been applied as of 2000. herefore, for the period between 1996 and 1999, the correction factors provided by RIPSAf were used. As RIPSAf has no coverage
by sex, the mean estimates presented by Agostinho and Queirozh were used.
For the standardization of mortality rates, the study used as the standard population the
Brazilian population of 2010, since this is the most recent Censusi, being close to the age
distribution of the current population, which is still in the process of demographic transition. f Ministério da Saúde. Secretaria
de Vigilância em Saúde. Departamento de Análise de Situação de Saúde. Plano de ações estratégicas para o enfrentamento das Doenças Crônicas Não Transmissíveis (DCNT) no Brasil 2011-2022. Brasília (DF): Ministério da Saúde; 2011 [cited 2012 Jun 17]. Available from: http://portal. saude.gov.br/portal/arquivos/ pdf/cartilha_dcnt_pequena_ portugues_espanhol.pdf
g Ministério da Saúde. Ficha de
qualificação da RIPSA-2012. Demográficos. Razão entre óbitos informados e estimados - A.18 – 2012. Brasília (DF); 2012 [cited 2014 Aug 4]. Available from: http://fichas.ripsa.org. br/2012/a-18/?l=pt_BR
h Agostinho CS. Estudo sobre
mortalidade adulta, para o Brasil entre 1980 e 2000 e unidades da Federação em 2000: uma aplicação dos métodos de distribuição de mortes [these]. Belo Horizonte (MG): Universidade Federal de Minas Gerais; 2009.
i Ministério da Saúde. DATASUS.
Following the corrections, the study used the regression model for the time series analyses
of each region and Brazil by sex1. he trend was deined as µ
t = ß0 + ß1t, implying a growth
(if the ß1 slope is positive) or decrease (if the slope is negative) in a straight line over time. he
ß1slope informs by how many units the expected value of this series increases or decreases
each year. Moreover, since the data indicated a sign of autocorrelation in the irst order, it was
assumed that the model’s residuals (the diference between µt and the observed value) follow
the autoregressive model of order one. Hypothesis testing deines whether the slope value is signiicantly diferent from zero or not. he regression model has the function of clearly indicating the nature of the trend and whether it is signiicant or not.
his study was prepared with aggregate secondary data of deaths and populations, obtained from the Brazilian Ministry of Health databases published on the Internet. he consulted databases did not include sensitive information such as names and addresses, therefore approval by an ethics research committee was not required for the study.
RESULTS
Among the steps of correction and redistribution of garbage codes, IDC and underreporting of deaths, the latter was the largest contributor to the total number of deaths for both men Table 1. List of garbage codes and redistribution percentage for lung cancer according to the Global Burden of Disease 2010 (GBD-2010) Study.
Garbage codesa Garbage codes(ICD-10 codes)b Redistribution (%)
Disseminated intravascular coagulation, acute respiratory failure,
cardiac arrest D65, I46, J96.0, J96.9 3.31
Cerebral palsy and other paralytic syndromes G80-G83 0.79
Embolism and thrombosis I74, I81 0.56
Ill-defined of A00-B99
A59-A60.0, A60.9, A63-A64, A71-A74, B07-B09, B35-B36, B74.4-B74.8, B75,
B85-B88, B95-B97
2.89
Ill-defined of F30 F99 F30-F33, F34.1, F40-F48, F51-F53, F60-F99 4.80 Ill-defined of G43-G58.9 G43-G44, G47-G52, G54, G56-G58 4.89
Ill-defined of H00-H99
H00-H02, H04-H05, H10-H11, H15-H18, H20-H21, H25-H26, H30-H31, H33-H35,
H43-H47, H49-H57, H60-H61, H69, H71-H74, H80-H81, H83-H93
2.69
Ill-defined of J30-J35.9 J30, J33, J34.2, J35 2.31
Ill-defined of K00-K14.9 K00-K11, K14 3.61
Ill-defined of L01-L98.9 L3.1, L4, L20-L30, L45, L50, L52-L68,
L70-L85, L90-L92, L98 4.13
Ill-defined of M09-M99
M10-M11, M15-M25, M40, M45, M47-M48, M50-M60, M65-M67, M70-M71, M75-M79, M95-M99
4.42
Ill-defined of N39.3-N97.8 N39.3, N40, N45-N46, N60, N84-N92,
N95, N97 4.46
J81 Pulmonary edema J81 0.04
N17-N19 Renal insufficiency N17-N19 0.01
Non-specified liver diseases K71.0-K71.6, K71.8-K72.0, K75.0-K75.1 0.21
Ill-defined of D10-D36.9 D10-D24, D26-D31, D35-D36 4.86
Ill-defined of Q10-Q84.9 Q16-Q18, Q36, Q54, Q65, Q67-Q68,
Q72-Q74, Q82-Q83 1.53
Pleural and chest diseases J86-J90, J93.8-J94 0.67
Neoplasm of uncertain or unknown behavior not otherwise specified
D00.0, D01.7-D01.9, D02.3-D02.9, D07.3, D07.6, D09.7-D09.9, D37.9, D38.6,
D39.9, D40.9, D41.9, D48.9
5.52
C39.0-9, Malignant neoplasm of other sites and of ill-defined sites
in the respiratory system and intrathoracic organs C39 80.83
C76.0-9, Malignant neoplasm of other sites and of ill-defined sites C76 3.86
C80.0-9, Malignant neoplasm with no specific site C80 2.57
and women in the two years analyzed. At the end of all correction steps, the number of deaths among men increased by 20.4% in 1996 and 10.1% in 2011. he same was observed for women, ranging from 34.2% in 1996 to 10.0% in 2011 (Table 2).
Deaths and standardized death rates from lung cancer showed signiicant variation following correction and redistribution of deaths for men and women in the North and Northeast regions in 1996. his efect was smaller in 2011 for both sexes in these and the other regions (Table 3).
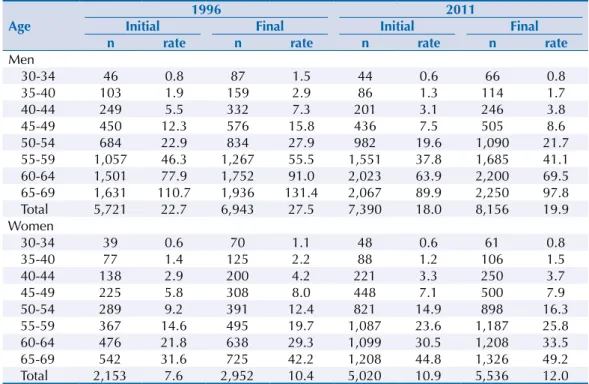
Following the correction and redistribution of deaths, death rates from lung cancer among the population aged 30-69 years were higher for men in 1996 and 2011. he South region had the highest rate for men and women. he lowest rates were observed for men in the Northeast region in the two years analyzed and for women in the Southeast (1996) and North (2011) regions. For women, there was increased risk in the Southeast, South and Midwest regions and in the country as a whole. his also caused a convergence trend of mortality rates between regions for women (Table 3). Mortality rates for lung cancer increase in risk according to age. his was observed for men and women in 1996 and 2011. Men have higher mortality rates than women, particularly over 55 years of age. his phenomenon is common to all regions and the country as a whole. However, the diference decreased in 2011 (Table 4).
Table 2. Participation of each redistribution step in the total number of deaths for lung cancer, according to sex. Brazil, 1996 and 2011.
Men Women
1996
1st position
(%)
2nd position
(%)
3rd position
(%)
1st position
(%)
2nd position
(%)
3rd position
(%) Absolute
number before correction
Absolute number
after correction
Under-reporting Ill-defined causes
Garbage codes
Absolute number
before correction
Absolute number
after correction
Under-reporting Ill-defined causes
Garbage codes
5,722 6,943 12.0 5.8 2.6 21,353 2,951 17.9 11.0 5.3
2011 1st position
(%)
2nd position
(%)
3rd position
(%)
1st position
(%)
2nd position
(%)
3rd position
(%) Absolute
number before correction
Absolute number
after correction
Under-reporting Garbage codes
Ill-defined causes
Absolute number
before correction
Absolute number
after correction
Under-reporting Garbage codes
Ill-defined causes
7,390 8,157 4.8 2.8 2.5 5,020 5,536 5.5 2.8 1.7
Table 3. Lung cancer deaths and standardized mortality rates* among ages 30 to 69 by region. Brazil, 1996-2011.
Region
1996
Rate % variation
2011
Rate % variation
Initial Final Initial Final
n rate n rate n rate n rate
Men
North 198 14.4 397 28.5 97.9 310 12.0 400 15.4 28.3
Northeast 553 8.6 1,261 19.5 126.7 1,204 11.9 1,461 14.4 21.0
Southeast 1,518 36.6 1590 38.3 4.6 1,966 29.3 2,072 30.8 5.1
South 3,154 27.0 3,329 28.5 5.6 3,426 18.3 3,691 19.7 7.7
Midwest 299 19.6 366 23.9 21.9 484 17.2 533 18.9 9.9
Brazil 5,722 22.7 6,943 27.5 21.1 7,390 18.0 8,157 19.9 10.6
Women
North 74 5.5 164 12.2 121.8 206 8.1 250 9.8 21.0
Northeast 270 3.7 763 10.3 178.4 986 8.5 1,185 10.2 20.0
Southeast 569 12.5 620 13.6 8.8 1,170 15.7 1,230 16.5 5.1
South 1,116 8.3 1,240 9.3 12.0 2,338 10.8 2,519 11.7 8.3
Midwest 123 8.0 164 10.6 32.5 320 10.5 351 11.5 9.5
Brazil 2,152 7.6 2,951 10.4 36.8 5,020 10.9 5,535 12.0 10.1
For uncorrected data, all regions showed a downward trend for men, signiicant or not, except for the Northeast region, which showed a signiicant increasing trend. After correction, all regions showed a signiicant downward trend for men (Figure).
Table 4. Lung cancer deaths and standardized mortality rates before and after correction according to age and sex. Brazil, 1996 and 2011.
Age
1996 2011
Initial Final Initial Final
n rate n rate n rate n rate
Men
30-34 46 0.8 87 1.5 44 0.6 66 0.8
35-40 103 1.9 159 2.9 86 1.3 114 1.7
40-44 249 5.5 332 7.3 201 3.1 246 3.8
45-49 450 12.3 576 15.8 436 7.5 505 8.6
50-54 684 22.9 834 27.9 982 19.6 1,090 21.7
55-59 1,057 46.3 1,267 55.5 1,551 37.8 1,685 41.1 60-64 1,501 77.9 1,752 91.0 2,023 63.9 2,200 69.5 65-69 1,631 110.7 1,936 131.4 2,067 89.9 2,250 97.8 Total 5,721 22.7 6,943 27.5 7,390 18.0 8,156 19.9 Women
30-34 39 0.6 70 1.1 48 0.6 61 0.8
35-40 77 1.4 125 2.2 88 1.2 106 1.5
40-44 138 2.9 200 4.2 221 3.3 250 3.7
45-49 225 5.8 308 8.0 448 7.1 500 7.9
50-54 289 9.2 391 12.4 821 14.9 898 16.3
55-59 367 14.6 495 19.7 1,087 23.6 1,187 25.8 60-64 476 21.8 638 29.3 1,099 30.5 1,208 33.5 65-69 542 31.6 725 42.2 1,208 44.8 1,326 49.2 Total 2,153 7.6 2,952 10.4 5,020 10.9 5,536 12.0
20
Men - Uncorrected
Women - Uncorrected
Men - Correcteda
Women - Correctedb
10 0 30 40 1 9 9 6 1 9 9 7 1 9 9 8 1 9 9 9 2 0 0 1 2 0 0 0 2 0 0 2 2 0 0 3 20 0 4 2 0 0 5 2 0 0 6 2 0 0 7 2 0 0 8 2 0 0 9 2 0 1 0
201
1 20 10 0 30 40 1 9 9 6 1 9 9 7 1 9 9 8 1 9 9 9 2 0 0 1 2 0 0 0 2 0 0 2 2 0 0 3 2 0 0 4 2 0 0 5 2 0 0 6 2 0 0 7 2 0 0 8 2 0 0 9 2 0 1 0 2 0 1 1 12 8 4 0 16 a) c) b) d) 1 9 9 6 1 9 9 7 1 9 9 8 1 9 9 9 2 0 0 1 2 0 0 0 2 0 0 2 2 0 0 3
200
4 2 0 0 5 2 0 0 6 2 0 0 7 2 0 0 8 2 0 0 9 2 0 1 0 20 1 1 10 5 0 15 20 1 9 9 6 1 9 9 7 1 9 9 8 1 9 9 9 2 0 0 1 2 0 0 0 2 0 0 2 2 0 0 3 2 0 0 4 2 0 0 5 2 0 0 6 2 0 0 7 2 0 0 8 2 0 0 9 2 0 1 0 2 0 1 1
North Northeast Southeast South Midwest
a Slope and p (in parentheses) value for corrected data: North: -0.706 (0.000), Northeast: -0.325
(0.016), Southeast: -0.531 (0.000), South: -0.607 (0.000), Midwest: -0.204 (0.002).
b Slope and p (in parentheses) value for corrected data: North: -0.213 (0.000), Northeast: -0.022
(0.726), Southeast: 0.175 (0.000), South: 0.177 (0.002), Midwest: 0.041 (0.207).
For women, all regions showed a signiicant increase for uncorrected data (Figure). After correction, the South and Southeast regions maintain the same pattern, but the North region has shown a signiicant downward trend.
DISCUSSION
Distribution patterns of lung cancer in Brazil difer according to sex, with higher rates among men than women, and reduced mortality trends for men and increased rates for women.
he diference in the occurrence of lung cancer according to sex is related to the distinct
characteristics of exposure to smoking among men and women3. he analysis of the variation
in mortality trends according to sex and geographical distribution is based on the diferent behaviors in tobacco use by sex over time.
Studies show increased mortality from lung cancer since the 1940s. In Europe, mortality has
stabilized or decreased among men and increased among women in the last decades2,8,15.
Most studies attribute this variation to changes in smoking habits, with trends declining
among men and rising among women in most countries2,6,8,15.
Diferences in smoking habits in the past have shown a much lower risk of lung cancer
among women22. Women used to start smoking later and smoked fewer cigarettes per day.
As the prevalence of smoking among women increased in many countries, mortality by sex tends to equalize2,6,8,15.
Malta et al.11 analyzed the trend in mortality from lung cancer between 1980 and 2003 for
Brazil and selected states. he authors observed a reduction among men up to 59 years of age and an increase among women of all age groups from 30 years on. he maintenance of
high mortality rates in older populations is due to smoking habits prevalent in the past9.
Silva et al.18, analyzing mortality from lung cancer in Brazil over the period 1979-2003,
identiied an increase of 29.0% among men and 86.0% among women. Analysis by region showed that in the Southeast region, between 1996 and 2003, the youngest age group (40-59 years) showed a decrease in mortality among men and an increase among women. Analysis by age showed the same pattern for this age group.
herefore, the results of this study follow the same trend observed in Brazil and other
countries, with declining mortality among men and an increasing trend among women2,6,8.
Despite the recent decline , the higher rates observed among men relect past habits, i.e., a higher prevalence of smoking among the male population, whose smoking habit precedes
that of women22. In Brazil, women began using tobacco later, with smoking promoted as a
desired behavior in movies and the media, alongside the strong cultural appeal of assertion
of independence and women’s liberation13. Studies indicate that the peak of tobacco
consumption will impact mortality rates approximately 30 years later9,19. Besides smoking,
genetic, hormonal and physiological factors, and also interaction between them, may have
a speciic impact on the lung carcinogenesis process among women3.
he attributable risk of smoking as a causative agent of lung cancer is higher than 90.0%22.
Other factors also participate in the etiology of this disease22, but with substantially lower attributable risk, ranging from 1.0% to 10.0% with environmental pollution. For example,
radon gas has an attributable risk of about 1.0%22; asbestos and other mineral ibers, about
4.0%; chromium, nickel and arsenic, about 4.0%; and exposure to silica, 1.5%22.
Brazil has a strong tradition in confronting smoking. With the 2011-2022 Strategic Action
Plan the Prevention and Control of NCD12, the country committed itself to reducing mortality
from NCD, among them cancer, and reducing smoking by 30.0% within a decade. hese goals have been achieved thanks to regulatory, educational and health promotion measures
Tobacco Control. In 2011, tobacco legislation was improved with Law 12,546/2011. In 2014, Presidential Decree 8,262/2014 on smoke-free environments was approved, banning indoor smoking, as well as all cigarette advertising. he Decree additionally expanded the space occupied by health warnings on cigarette packs by 30.0% and increased tobacco taxation,
besides setting a minimum price for cigarettes14.
he trends observed in this study (population from 30 to 69 years), however, may not occur among the older population. In addition, correction of death underreporting considered the whole population aged ive and over, including the elderly, who are more prone to death undercounting. his strategy may overestimate mortality, since death records of the younger population tend to be more precise compared to the older population.
Mortality analyses using methods to redistribute garbage codes and correct underreporting of deaths reduce problems of underestimation of mortality rates by speciic cause, in addition to being more appropriate for comparative analyses between regions and time trend analysis. he contribution of each stage in the process of correcting raw death data enables the establishment of strategies to improve information sources and build analysis proposals. In addition, mortality indicators with better quality of information can be more adequately used in public administration.
Lung cancer has a long latency period; therefore, the reduced trend in early mortality rates among men identiied in this study results from national eforts to reduce the prevalence of smoking in the country in recent decades. hese results indicate the importance of public health measures in protecting life and in reducing preventable deaths.
REFERENCES
1. Bowerman BL, O’Connell RT. Forecasting and time series: an applied approach. 3rd. ed. Belmont: Duxbury; 1993.
2. Crocetti E, Capocaccia R, Casella C, GuzzinatI S, Ferretti S, Rosso S et al. Population-based incidence and mortality cancer trends (1986-1997) from the network of Italian cancer registries. Eur J Cancer Prev. 2004;13(4):287-95. DOI:10.1097/01.cej.0000136719.42948.5a
3. Devesa SS, Bray F, Vizcaino AP, Parkin DM. International lung cancer trends by histological type: male: female differences diminishing and adenocarcinoma rates rising. Int J Cancer. 2005;117(2):294-9. DOI:10.1002/ijc.21183
4. Doll R, Hill AB. Smoking and carcinoma of the lung. BMJ. 1950;2(4682):739-48. DOI:10.1136/bmj.2.4682.739
5. França E, Teixeira R, Ishitani L, Duncan BB, Cortez-Escalante JJ, Morais Neto OL et al. Causas mal definidas de óbito no Brasil: método de redistribuição baseado na investigação do óbito. Rev Saude Publica. 2014;48(4):671-81. DOI:10.1590/S0034-8910.2014048005146
6. Fu JB, Kau TY, Severson RK, Kalemkerian GP. Lung cancer in women: analysis of the national surveillance, epidemiology, and end results database. Chest. 2005;127(3):768-77. DOI:10.1378/chest.127.3.768
7. Giovino GA, Mirza SA, Samet JM, Gupta PC, Jarvis MJ, Bhala N et al. Tobacco use in 3 billion individuals from 16 countries: an analysis of nationally representative cross-sectional household surveys. Lancet. 2012;380(9842):668-79. DOI:10.1016/S0140-6736(12)61085-X
8. Levi F, Lucchini F, Negri E, Zatonski W, Boyle P, La Vecchia C. Trends in cancer mortality in the European Union and accession countries. Ann Oncol. 2004;15(9):1425-31. DOI:10.1093/annonc/mdh346
9. Lopez AD, Collishaw NE, Piha T. A descriptive model of the cigarette epidemic in developed countries. Tob Control. 1994;3(3):242-7. DOI:10.1136/tc.3.3.242
11. Malta DC, Moura L, Souza MFM, curado MP, Alencar AP, Alencar GP. Tendência da
mortalidade por câncer de pulmão, traquéia e brônquios no Brasil, 1980-2003. J Bras Pneumol. 2007;33(5):536-43. DOI:10.1590/S1806-37132007000500008
12. Malta DC, Morais Neto OL, Silva Junior JB. Apresentação do plano de ações estratégicas para o enfrentamento das doenças crônicas não transmissíveis no Brasil, 2011 a 2022. Epidemiol Serv Saude. 2011;20(4):425-38. DOI:10.5123/S1679-49742011000400002
13. Malta DC, Iser BPM, Sá NNB, Yokota RTC, Moura L, Claro RM et al. Trends in tobacco consumption from 2006 to 2011 in Brazilian capitals according to the VIGITEL survey. Cad Saude Publica. 2013;29(4):812-22. DOI:10.1590/S0102-311X2013000800018
14. Malta DC, Silva MMA, Albuquerque GM, Lima CM, Cavalcante T, Jaime PC et al . A implementação das prioridades da Política Nacional de Promoção da Saúde, um balanço, 2006 a 2014. Cienc Saude Coletiva. 2014;19(11):4301-12. DOI:10.1590/1413-812320141911.07732014
15. Mesle F. [Gender gap in life expectancy: the reasons for a reduction of female advantage]. Rev Epidemiol Sante Publique. 2004;52(4):333-52. French.
16. Monteiro CA, Cavalcante TM, Moura EC, Claro RM, Szwarcwald CL. Population-based evidence of a strong decline in the prevalence of smokers in Brazil (1989-2003). Bull World Health Organ. 2007;85(7):527-34. DOI:10.2471/BLT.06.039073
17. Naghavi M, Makela S, Foreman K, O’Brien J, Pourmalek F, Lozano R. Algorithms for
enhancing public health utility of national causes-of-death data. Popul Health Metr. 2010;8:9. DOI:10.1186/1478-7954-8-9
18. Silva GA, Noronha CP, Santos MO, Oliveira JFP. Diferenças de gênero na tendência de mortalidade por câncer de pulmão nas macrorregiões brasileiras. Rev Bras Epidemiol. 2008;11(3):411-9. DOI:10.1590/S1415-790X2008000300008
19. Silva VL, Koifman S. Smoking in Latin America: a major public health problem. Cad Saude Publica. 1998;14(suppl 3):99-108. DOI:10.1590/S0102-311X1998000700010
20. Szwarcwald CL, Morais Neto OL, Frias PG, Souza Jr. PRB, Cortez-Escalante JJ, Lima RB et al. Busca ativa de óbitos e nascimentos no Nordeste e na Amazônia Legal: estimação das coberturas do SIM e do SINASC nos municípios brasileiros. In: Ministério da Saúde. Saúde Brasil, 2010: uma análise da situação de saúde e de evidências selecionadas de impacto de ações de vigilância em saúde. Brasília (DF): Ministério da Saúde; 2011. p.79-98.
21. Yang L, Parkin DM, Li L, Chen Y. Time trends in cancer mortality in China: 1987-1999. Int J Cancer. 2003;106(5):771-83. DOI:10.1002/ijc.11300
22. Zamboni M. Epidemiologia do câncer do pulmão. J Pneumologia. 2002;28(1):41-7. DOI:10.1590/S0102-35862002000100008
Funding: Health Surveillance System of the Brazilian Ministry of Health (Process 25000214175/2012-75 – Cooperation Term 248/2012). Conselho Nacional de Desenvolvimento Cientiico e Tecnológico (CNPq - Process 307865/2014-2 – Productivity grant for DCM).
Authors’ Contribution: Study design and plan: DCM, DMXA, EF. Data collection: DMXA, EF. Data analysis and interpretation: DCM, DMXA, EF, GA, GCL, LM. Manuscript drafting: DCM, EF, DMXA, GA. Critical review of manuscript: DCM, DMXA, EF, GA, GCL, LM. All authors have approved the inal version to be published. Acknowledgments: To Dr. Mohsen Naghavi from the Institute for Health Metrics and Evalution-IHME/University of Washington, for kindly providing the detailed list of garbage codes used in the GBD 2010 Study.