ECSE Research project: “Educational Challenges in Southern Europe.
Equity and Efficiency in a Time of Crisis” (2013-2015): National
Reports
University Institute of Lisbon
Contents of the document Four National Reports
Portugal (from page 1 to 75 of the document) Spain (from page 76 to 120 of the document) Italy (from page 121 to 190 of the document) Greece (from page 191 to 258 of the document)
Research teams Portuguese team:
CIES-IUL / ISCTE-IUL, Coordinator: João Sebastião
Researchers: João Sebastião; Luís Capucha, Susana da Cruz Martins Ana Raquel Matias; Ana Rita Capucha, Sofia Amândio; Maria Álvares; Patrícia Ávila; Pedro Abrantes; Pedro Estevão; Alexandre Calado; Collaborator: Ana Rita Matias.
International teams:
Spain - Universidad Complutense, Head Researcher: Rafael Feito Alonso; Italy - Università Cattolica del Sacro cuore, Milan, Head Researcher: Maddalena Colombo, Researchers: Mariagrazia Santagati, Marta Cordini; Greece - Panteion University of Social and Political Sciences, Head Researcher: Vasiliki Kantzara.
Research lines Line II - Knowledge society and patterns of competencies Beginning date 01/06/2013
End Date 31/12/2015
Project type Funded research
Funding entities Fundação para a Ciência e a Tecnologia (FCT)
1
National Studies
Country Report: Portugal
CIES-IUL
Research team: João Sebastião (Coordinator),
Luís Capucha, Susana da Cruz Martins, Ana Raquel Matias, Ana Rita Capucha, Sofia Amândio Maria Álvares, Patrícia Ávila, Pedro Abrantes, Pedro Estêvão, Alexandre Calado
2 Contents
LIST OF TABLES AND FIGURES ... 3
A1. NATIONAL CONTEXT DESCRIPTION ... 5
Annexes ... 10
A2. EDUCATIONAL SYSTEM ... 16
Annexes ... 25
A3. PROCESSES AND MECHANISMS OF MONITORING AND EVALUATING THE EDUCATIONAL SYSTEM ... 39
B1. EQUITY SECTION ... 48
Participation and access ... 50
Adult’s education initiatives ... 52
School population diversity – ethnical background, immigrants and special education ... 53
Attainment and schools results – levels of success and failure... 55
Describing the population attainment ... 55
Retention rates ... 55
PISA Results and ESL Rate ... 58
Strategies for promoting success and equity ... 59
Educational expenditure /funding ... 60
Annexes ... 64
B2. CONCLUSIVE NOTES ... 69
3 List of tables and figures
Tables
A1. National context description
Table A1.1 Gini Coefficient, in EU27 and Portugal (2000-2012)
Table A1.2. Risk of poverty rate (%), by sex, in Europe 27 and Portugal, 2000-2012
Table A1.3 State Expenditure on Education, as a % of GDP A2. Description of the educational system
Table A2.1 Annual change rates in the number of enrolled young secondary
Table A2.2 Number of Resource Centres for Inclusion, in Mainland Portugal, between 2009 and 2014
Table A2.3 Number of Resource Centres for Inclusion, by NUTS 2 regions. 2013/2014 Table A2.4 Applicants and holders (No.) of financial support (subsídio) for special education
B1. Equity: Policies and achievements
Table B1.1 - Pre-School Enrolment - Pre-primary education (level 0), % in relation to the same age total population and in relation to the same age total population
Figures
A1. National context description
Figure A1.1 Men and women at risk of poverty rate, in EU-27 and Portugal (2000-2012).
Figure A1.2 Evolution of educational attainment (%), by sex Figure A1.3 Evolution of educational attainment (%), by age groups Figure A1.4. Evolution of the employment rate (%),by sex, age
Figure A1.5. Evolution of the unemployment rate (%),by sex, age
Figure A1.6. Evolution of the employment rate (%), by age groups and ISCED Figure A1.7 Evolution of the unemployment rate (%), by age groups and ISCED
Figure A1.8 Private expenditure on education as % of GDP
A2. Description of the educational system
Figure A2.1. Number of teachers in Portugal, for all educational levels, 2000-2012
4
Figure A2.3 Number of students in Portugal, by educational levels, 2000-2012
Figure A2.4 Evolution of the number of young people enrolled in secondary education and vocational courses, public and private, in mainland Portugal (2000-2012)
Figure A2.5 Evolution of the number of young people enrolled in vocational education Figure A2.6 Trend in percentage of youth enrolled in secondary vocational education
Figure A2.7 Trend in percentage of youth enrolled in secondary vocational education Figure A2.8 Financial support for special education (in EUR, mainland Portugal (2009-2014)
Figure A2.9 Evolution of the number of students with SEN, by cycles and levels of education, Mainland Portugal (2009-2014)
Figure A2.10 Participants in early education - as % of inhabitants of the corresponding age group, in Portugal, (2000-2012)
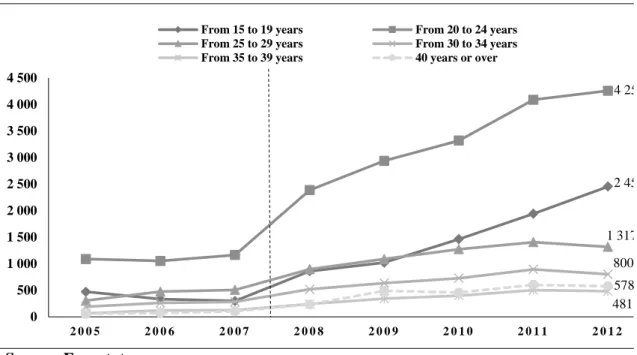
Figure A2.11 Participants post-secondary non-tertiary education- as % of inhabitants of the corresponding age group, in Portugal, (2005-2012)
Figure A2.12 Participants first and second stage of tertiary education- as % of inhabitants of the corresponding age group, in Portugal, (2000-2012)
Figure A2.13 Participation/ Enrolment in education by sex age ranges, all ISCED (1-6) - as % of corresponding age population
B1. Equity: Policies and achievements
Figure B1.1 - Financial aid to pupils as % of total public expenditure on education, by ISCED level, in Portugal and EU-27 (2000-2010)
Figure B1.2 - Annual expenditure on public and private educational institutions per pupil/student compared to GDP per capita, based on full-time equivalents, in Portugal (2000-2010)
Figure B1.3 Early School Leaving by gender and labour status (%), in Portugal
Figure B1.4 Percentage of total population aged between 15 and 74 with Upper Secondary and Post-Sec
Figure B1.5 Participation/ Enrolment in education, by sex, of students at ISCED level 3-GEN - as % of all students at ISCED level 3, in Portugal ondary attainment, in Portugal
Figure B1.6 Percentage of total population aged between 15 and 74 with tertiary attainment, in Portugal
Figure B1.7 Percentage of population aged 25-64 below secondary attainment, in Portugal (2002-2012)
5 A1. National context description
While making an effort to join the euro zone and participating in the process of the new currency, Portugal featured among countries with the lowest levels of growth, productivity and competitiveness, besides expressing historical structural problems. The qualification structure of the population, maintaining great shares of individuals with lowest levels of qualification, along with a progressive retraction in the demographic configuration - less younger population and increase of the older ones, with direct effects on the structure of the labor market and also pressing our activities rates.
Even before the crisis of 2007/2008, international financial agencies such as IMF argued that Portuguese economy had an anemic productivity and a low economic growth, with a large budget deficit and likely prospect of competitive disinflation (Blanchard, 2006 quoted by Pedroso 2014). We are now testifying that, after the austerity imposed by the Memorandum of Understanding, the above mentioned problems were aggravated, launching the country into recession, with devastating consequences both to economic and social conditions (ibidem). With the outcome of the crisis in 2008, Portuguese banks were majorly affected and levels of external debt increased dramatically, as pursuing credits became extremely difficult. Since the first negatives evaluations made by the rating agencies – such as the ones of Moody´s agency, marking Portugal with a “junk status” at 2011 – Portugal entered in a vicious cycle, with the growth of public debt and of the deficit , a fragile balance trade, which were already fragile since the euro adhesion, incapable to uphold a return to growth, and the austerity adopted as the main path to overcome the crisis, compromising Portuguese families and workers. What was considered to be a financial crisis quickly become an economic crisis bursting into an ongoing socioeconomic crisis.
In the period considered, Portugal had two centre-left governments formed by the Socialist Party (XVIInd Constitutional Government 2005-2009 and XVIIIrd Constitutional
Government 2009-2011) which were followed by a centre-right coalition government (XIXth Constitutional Government, 2011 - until present). These offices worked alongside with the EU implementing policies and adjusting programs. In 2010, they searched for troika assistance [European Commission (EC), European Central Bank (ECB), and International Monetary Fund (IMF)]. The late austerity measures affected mainly the working classes, with massive dismissal in public and private sector as well as cuts on public policies (salaries, allowances, pensions and other social benefits) (Abrantes, 2014).
6 In general terms, national reports consider unemployment to be one of the major negative consequences of the crisis, with no impression of what is to be expected from social protection policies. Unemployment rates increased considerably - especially youth unemployment - leading to an increase in social inequality. According to Eurostat data, long-term unemployment represented 63,5% of all unemployment in early 2014. Ongoing impoverishment, job insecurity and deprivation acute of materials among families (Cantante, Carmo, 2014; Obervatório das Desigualdades) are the main consequences.
Education was not exception, considering the funding policy and specific educational sectors, such as adult’s education. On the contrary. Although Portugal has a non-linear trend in the evolution of its education indicators and outcomes, we can highlight the effort to enter a pathway of recovering in the last decades, particular since 2001 with the Lisbon Agenda advent. More recently, in the period of 2005-2009, we can observe important signs of progress and convergence toward European standards, mostly in Adults education, the Vocational Education, the development of Science and the tertiary education and attainment.
In the national context, income inequalities are changing the country’s social structure and creating relatively enduring gaps in the social tissue.
Considering the present-day context, the scenario becomes alarming as the austerity policies are having impacts on redistributive schemes and national wages. An analysis of the "Gini Coefficient" for the last 12 years shows improvements in the income inequality levels for all income groups (from 36% in 2000 to 34,5% in 2012). Nevertheless, with the peak of the economic crisis 2009/2010 and the implementation of the austerity package in 2011/2012 we observe a slight increase in the Gini coefficient (Table A1.1). We may assume, however, that the level of income inequality and distribution among all income groups has always been more significant in Portugal then in the EU 27 average. Similar conclusions can be drawn when analyzing the “At-risk-of-poverty rate”, showing a decrease between 2000 (21%) and 2012 (17,9%), though remaining higher when compared to EU 27 average (17.1%), and higher among women (18,2% against 17,5% for men); in 2012 these rates demonstrate Portugal’s higher risk of poverty compared to the EU27, even if both have been progressively approaching (Table A1.2 and Figure A1.1).
Media and Portuguese agencies of statistics studies and inequalities studies have been reporting, in a regular everyday basis, poverty and social inequalities as a major concern in Portuguese society, as the indicators are reaching “historical” levels. For
7 instance, late INE´s report (2014) stated that one in five Portuguese is at risk of poverty, 2 million Portuguese living below poverty line and more than a quarter living in great material deprivation (INE, Rendimento e Condições de Vida, 2014). Recent OCDE’s reports (OECD, "Doing Better for Family", 2011) showed that Portugal was the 8th OECD´s country to have the highest rate of “child poverty risk”. Except for a decrease between 2004 and 2007 (from 24,2% to 20,8%), Eurostat data shows a relatively persistent high rate which has been increasing ever since, up to (21% in 2012), remaining closer to the EU27 average (Figure A1.2).
Social inequality levels are related with the education context. In a long term, education has its impacts in social and economic context of a country, for instance considering poverty and the possibility of overcoming the familiar background, but, on the other hand, we can assume that poverty has almost an immediately impact in Education – for instance, in relating the scholar results with social background or, the levels of resources, family´s income.
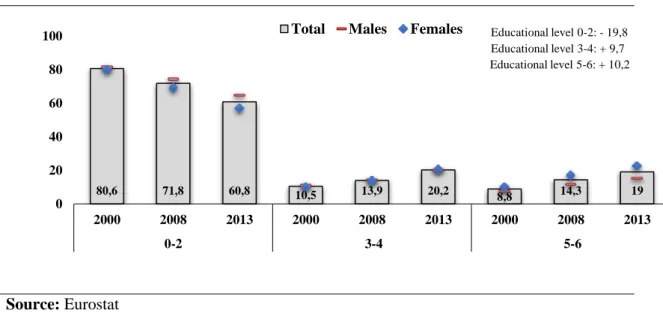
As we have seen, despite the significant improvements in educational results and in the education system´s performance (eg., Early School Leaving results) an educational deficit persists since the policies that produced the good results of the last decades were reversed. it is predictable that the low levels of educational attainment among Portuguese population are continuing to be particularly onerous for the persistence of social inequalities. Even if we detected improvements between 2000-2012 (Figure A1.2) considering the population aged between 25-64 -the numbers of those with lower secondary (0-2 ISCED) attainment decreased 19,8 p.p, while those with higher education (5-6 ISCED level) increased 12,5 p.p), - data stills shows a significant proportion of this segment – 25-64 - with only the primary or basic educational attainment (ISCED 1) - 60.8% in 2012; or the secondary or post-secondary non-tertiary education (ISCED 3-4) 20,2% in 2012; and 19% with higher education (ISCED 5-6) in 2012. Moreover, for those with higher education aged between 25-64 years old, women are clearly more predominant (22,5% against 15,3% of men) (Figure A1.2).
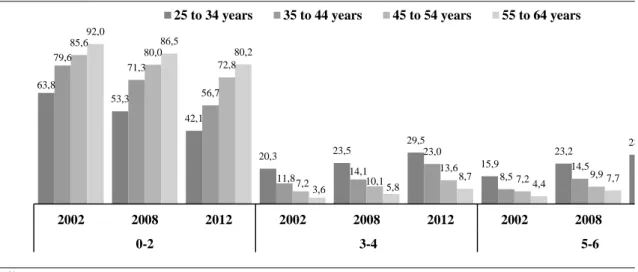
Considering the smaller range of age groups, we observe, on one hand, that primary or basic is more significant in oldest age groups with 55-64 and 45-64 (80,2% and 72,8% respectively); while youngsters (25-34) are the more representatives in higher education attainment (28,8% ISCED 5-6). Nevertheless, these younger groups still present considerable proportion (42,1%) of individuals with only the primary or basic level (Figure A1.3). This is a structural problem linked with the historical expansion and
8 dynamics of our schooling process. Even though this is a diminishing tendency, we are still facing the early school leaving problem, which stands as one of the highest of the EU, as well as with a labor market structure that absorbs low qualified youngsters. However, we may assume that this relation, between labor market and low qualified people, may be different in this recent context of crisis where major unemployment rates are mostly affecting the youngest.
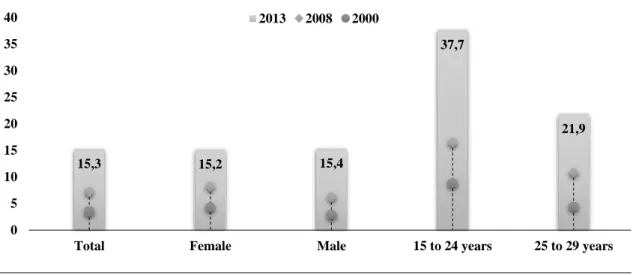
The employment for the same period indicates a considerable decrease during the last 13 years. For 25-64 year old, employment rate decreased from 75,5% in 2000 to 68,3% in 2013, with 2008 representing the most evident phase of this appalling change. Generally, women were the most affected (64,9% in 2013), though gender differences were already observed in 2000 (66,9% against 84,5% for men) (Figure A1.4). On the course of this decrease, we sign a sharp rise in unemployment rates: for the same age group the figures were 3,6% in 2000 reaching an astonishing 15,3% in 2013 (increased by 11,8%) (Figure A1.5.). Here, the youngest ones were the most affected: for those aged between 15-24 there was an increase of 28,9 %, with a current rate of 37,7%; while for those aged 25 -29 there was a climb of 17,5 %, with a rate of 21,9% in 2013 (Figure A1.5.).
When analyzing the employment and unemployment rates by individuals’ educational attainment, we can confirm, on the one hand, that younger individuals (aged 30-34) were strongly affected by the decline in employment rates, particularly when holding a higher educational level - showing a decline in the employment rate of 15,3%; while this was of 10,9% for those who held basic education. Nevertheless, and on the other hand, qualification and education remains an important tool for preventing employment decline and unemployment: for individuals aged 25-29 with basic and primary education, employment rate dropped significantly (23,1% less), while those holding a higher education diploma decreased slightly less (16,5 %) (Figure A1.6.). Even though unemployment rates became high among youngers with highest qualifications (20,6% of those aged 25-29 having higher educational attainment are unemployed, compared to 37,8% of those aged 15-24 with the same education degree), the lowest educated individuals tend to be more critical for maintaining unemployment rates, meaning that more education still prevents job loss. For instance, considering those aged between 25-29, unemployment rates increased about 12,1% when having higher education, while significantly more (about 21,5%) for those with primary education (Figure A1.7).
9 Since 2005, Portuguese educational policies invested in the increase of school attendance and attainment, as well as in the improvements of the schooling results and the education system performance. Portugal had been following a path of convergence towards European standards, where policy was marked by traces of continuity in the demand for these results and consequent convergences. This occurred also despite some differences seen in domestic policy-making, characterized by two main periods: From 2000-2004, a stage mostly marked by significant legislative production and the expansion of schooling; from 2005-2010, a stage marked by policies targeting the increasing of school success and the modernization of schools’ infrastructures, and respective results. During the last decade, we may highlight the increase of compulsory education to 12 years of schooling; results in fighting against early school dropouts; the reinforcement of adults’ education and training options and adult’s educational attainment; and the development of the vocational and training courses.
Entering in the crisis period, several signs of reversal can be noticed, not only due to the financial retraction, but also due to the recent political choices. The withdrawal of the existing program qualifying adults, “Novas Oportunidades” leaving the system without any valid option; the introduction of “curricular learning goals” in specific school subjects; the disappearance, or restructuring, of measures supporting students’ success (eg. National Plans for reading and teachers training in math); and a shift in the educational paradigm characterized by the introduction of a teaching-learning system based on more selective exams at all levels and on the gradual depreciation of competences in the learning processes.
Nevertheless, the most prominent impacts of the crisis are yet to be understood, specifically, when analyzing the public expenditure on education (analyzed further on section 2). Expenditure on education as a percentage of GDP remained approximately the same until 2010, with a slight increase on the private expenditure (0,45% in 2012) (Figure A1.8). However, national data sources indicate a tendency of significant cuts: National Statistical Institute (INE) showed a decrease of 1,2% p.p. on educational public expenditure between 2000 and 2012 (representing a negative growth on expenditure of 20%); National Budget Direction (PORDATA/DGO) showed a decrease of 1,1% for the same years (representing a negative growth on expenditure of 22%),. The decline is explained mostly by the expenditure retrenchment: decrease of employed teachers (Table A1.3), together with the salary reduction in public administration along with other current
10 expenses and the restrictions implemented in national programs like “Parque Escolar”, particularly responsible for the renovation and modernization of secondary schools.
By pointing out clear signs of regression in Portugal, we argue that budget cuts and recent political choices may jeopardize some of the previous achievements (eg., increase of adult’s qualification and training and decrease of early school dropouts). Lastly, taking into account the effects education has on overcoming crisis, this should be a highly protected sector.
Annexes
Table A1.1 Gini Coefficient, in EU27 and Portugal (2000-2012)
2000 2001 2002 2003 2004 2005 2006 2007 2008 2009 2010 2011 2012
EU27 : : : : : 30,6 30,2 30,6 30,8 30,4 30,4 30,7 30,5
Portugal 30 37 : : 37,8 38,1 37,7 36,8 35,8 35,4 33,7 34,2 34,5
Source: Eurostat Note: : = Not available
Table A1.2. Risk of poverty rate (%), by sex, in Europe 27 and Portugal (2000-2012)
Total Males Females
EU 27 Portugal EU 27 Portugal EU 27 Portugal
2000 : 21 : 19 : 22 2001 : 20 : 20 : 20 2002 : 20 : : : : 2003 : 19 : : : : 2004 : 20,4 : 19,2 : 21,6 2005 16,4 19,4 15,6 18,7 17 20,1 2006 16,5 18,5 15,7 17,7 17,2 19,1 2007 16,5 18,1 15,7 17,2 17,3 19,0 2008 16,4 18,5 15,5 17,9 17,4 19,1 2009 16,3 17,9 15,4 17,3 17,1 18,4 2010 16,4 17,9 15,6 17,3 17,0 18,4 2011 16,9 18 16,1 17,6 17,6 18,4 2012 17,1 17,9 16,5 17,5 17,8 18,2
11 80,6 71,8 60,8 10,5 13,9 20,2 8,8 14,3 19 0 20 40 60 80 100 2000 2008 2013 2000 2008 2013 2000 2008 2013 0-2 3-4 5-6
Total Males Females Educational level 0-2: - 19,8 Educational level 3-4: + 9,7 Educational level 5-6: + 10,2
Source: Eurostat Note: : = Not available
Figure A1.1 Men and women at risk of poverty rate (60% of median equivalised income after social transfers), and youth age less than 16 years old, in EU-27 and Portugal (2000-2012).
Source: Eurostat
Note: Data for EU27 for 2000 is not available
Figure A1.2 Evolution of educational attainment (%), by ISCED and sex, between 2000 and 2013, in Portugal Source: Eurostat 5 10 15 20 25 30
Total Male Female Pop. <16 Total Male Female Pop. <16
EU-27 Portugal
12 Figure A1.3 Evolution of educational attainment (%), by ISCED and age groups, between 2000 and 2013, in Portugal
Source: Eurostat
Figure A1.4. Evolution of the employment rate (%), by sex, age (25-64 years) and among youth (15-29 years), between 2000 and 2013, in Portugal
Source: Eurostat 63,8 53,3 42,1 20,3 23,5 29,5 15,9 23,2 28,3 79,6 71,3 56,7 11,8 14,1 23,0 8,5 14,5 85,6 80,0 72,8 7,2 10,1 13,6 7,2 9,9 92,0 86,5 80,2 3,6 5,8 8,7 4,4 7,7 2002 2008 2012 2002 2008 2012 2002 2008 0-2 3-4 5-6
25 to 34 years 35 to 44 years 45 to 54 years 55 to 64 years
68,3 64,9 71,8 22,3 68,0 0 10 20 30 40 50 60 70 80 90 100
Total Female Male 15 to 24 years 25 to 29 years 2013 2008 2000
13 Figure A1.5. Evolution of the unemployment rate (%), by sex, age (25-64 years) and among youth (15-29 years), between 2000 and 2013, in Portugal
Source: Eurostat
Figure A1.6. Evolution of the employment rate (%), by age groups and ISCED, between 2000 and 2013, in Portugal Source: Eurostat 15,3 15,2 15,4 37,7 21,9 0 5 10 15 20 25 30 35 40
Total Female Male 15 to 24 years 25 to 29 years 2013 2008 2000 4 4 ,4 3 4 ,1 1 6 ,2 8 3 ,8 7 9 ,4 6 3 ,3 8 2 ,2 8 2 ,0 7 1 ,3 3 3 ,2 3 2 ,6 2 7 ,5 7 7 ,6 7 4 ,9 7 0 ,9 9 0 ,9 8 6 ,6 8 0 ,6 7 3 ,3 5 6 ,1 3 6 ,0 7 0 ,9 81 ,2 7 0 ,5 80 ,6 9 2 ,0 2 0 0 0 2 0 0 8 2 0 1 3 2 0 0 0 2 0 0 8 2 0 1 3 2 0 0 0 2 0 0 8 2 0 1 3 1 5 T O 2 4 Y E A R S 2 5 T O 2 9 Y E A R S 3 0 T O 3 4 Y E A R S 0-2 3-4 5-6
14 Figure A1.7 Evolution of the unemployment rate (%), by age groups and ISCED, between 2000 and 2013, in Portugal
Source: Eurostat
Figure A1.8 Private expenditure on education as % of GDP
Source: Eurostat 0,08 0,08 0,08 0,09 0,13 0,41 0,43 0,44 0,49 0,38 2000 2001 2002 2003 2004 2005 2006 2007 2008 2009 2010 1 0 ,5 1 6 ,2 4 0 ,6 4 ,2 1 0 ,7 2 5 ,7 4 ,4 8,0 1 8 ,9 9 ,5 1 4 ,4 3 6 ,0 8 ,3 8,8 1 9 ,0 7 ,3 6,2 1 4 ,1 2 1 ,2 3 0 ,4 3 7 ,8 8 ,5 1 2 ,9 2 0 ,6 6 ,3 5,8 2 0 0 2 2 0 0 8 2 0 1 3 2 0 0 2 2 0 0 8 2 0 1 3 2 0 0 3 - 0 5 2 0 0 8 2 0 1 3 1 5 T O 2 4 Y E A R S 2 5 T O 2 9 Y E A R S 3 0 T O 3 4 Y E A R S 0-2 3-4 5-6
15 Table A1.3 State Expenditure on Education, as a % of GDP
2000 2001 2002 2003 2004 2005 2006 2007 2008 2009 2010 2011 2012 Eurostat 5,4 5,4 5,3 5,4 5,1 5,2 5,1 5,1 4,9 5,8 5,6 : :
INE 6,1 6,2 6,3 6,2 6,4 6,5 6,2 5,7 5,6 6,0 6,3 5,7 4,9
Pordata/DGO 5,1 5,2 5,4 5,1 4,9 4,9 4,7 4,4 4,3 5,0 5,0 4,6 4,0
Source: Eurostat Note: : = Not available
16 A2. Educational system
Compulsory education
Since 2009 compulsory education corresponds to free education, from age 6 to 18, divided between basic and upper secondary education1. Basic education lasts for 9 years and is divided into three cycles. The 1st cycle with four years of schooling from 6 to 10 modal ages; the 2nd cycle with two years of schooling from 10 to 12 modal ages; and lastly, the 3rd cycle with three years of schooling from 12 to 15 modal ages (corresponding to the end of lower education, ISCED 2). Upper secondary education comprises three academic years (including 10th to 12th grades), from 15 to 18 modal ages, combining different curricular routes which in general converge in accessing to tertiary education plans (see
Portuguese diagram in appendix).
Currently, the last two stages of compulsory education, namely the 3rdcycle of basic education and upper secondary, include dual certification and courses geared towards further study. This means that vocational education and training cycles may last 1-6 years, beginning at 15 years old and are organized in school networks including both general and vocational education (either in private vocational schools or in consortium of public and private entities). The guidance of students foresees the choice between vocational and general courses (from 3rd cycle to upper secondary)2, a transition implying tracking
though with some degree of permeability. In general, the existing options allow to complete compulsory education and to access tertiary education.
To put in a nutshell, all compulsory education stages provide general courses (for basic level)/scientific and humanistic (for upper secondary), Artistic Courses (for all levels), and training through a dual regime (school and work context). Students risking to overcome compulsory educational maximal age at each stage have second further specific opportunities. For instances, for those dropping out, having drop out or needing requalification may complete compulsory or further education through Education and Training Courses (ETC) from 3rd cycle to upper secondary; students under 15 years old or overcoming compulsory education maximal age, with learning difficulties, risking social exclusion and/or school dropout, have Alternative Curriculum Paths (PACs) for
1 Law no. 85/2009, August 27. This educational level is expected to cover all pupils in 2014-15, Since the entrance of Portugal in the European Economic Community (CEE) in 1986 and the new LBSE, until 2009, compulsory education was at lower secondary education level(e ainda é. Isso não mudou),, i.e., nine years of schooling, and reintroduced vocational routes into the education system (extinct since 1977). (não percebo…
2 The guidance of students always implies the parents’ agreement though it may be suggested by the class council or director, knowing that in practice vocational guidance has usually followed a path of continued school failure
17 basic education levels; students aged 15 – 18 who are early school leavers or risking delinquent behavior, have the Integrated Program for Education and Training3 for the 2nd
and 3rd cycle of basic education (PIEF) with adjusted schedules and curricula to
individuals’ skills and proficiencies, relational and citizenship skills and labour market demands; those under 25, who completed lower secondary or equivalent, dispose of an educational provision for upper secondary education including Technological courses (currently residual), Professional and Apprenticeship courses (initial professional training courses taught on the Vocational Training Centre Network4). Finally, to tackle school drop-outs or retentions for youth aged 13 or more, a very recently pilot experience foresees the possibility for vocational Courses during compulsory education and starting from the 3rd cycle of basic education, allowing progression to post-secondary non-tertiary professional education (a pilot-project from 2013/2014).
For the period in analysis (2000-2012) teachers’ and academic staff (Figure A2.1 and Figure A2.2) show an important decrease. After increasing from 2000 to 2010 – until 2005 for primary education and for 2009 for lower secondary education – since 2012 that the number of teachers has decreased significantly. This loss was more significant for primary education (about 11 000 teachers less), followed by those in lower secondary (about 8 000 teachers less). Teachers’ numbers in upper secondary fluctuated significantly more (with key variation years: 2004, 2007, 2012), with a recent loss of about 2000 teachers less.
The number of students for both public and private sectors (Figure A2.3) diminished also for primary education (about 12% less students between 2000 and 2012), while swaging for lower and upper secondary -- observing almost the same number of students when comparing 2000 to 2012. However, this apparent stability hides two different periods for these educational levels: if first students´ numbers decreased significantly from 2000 to 2005/6 (about 10% loss for lower secondary, and 17% for upper secondary), in a second moment their numbers exploded, between 2005/6 to 2009 (38% more in lower secondary, 44% more in upper secondary), decreasing again until 2012 (about 16-17% less students for both educational levels).
3 Programa Integrado de Educação e Formação, PIEF
4 Under the responsibility of the Employment and Vocational Training Institute (Instituto do Emprego e Formação Profissional (IEFP ).
18 A more detailed analysis indicates further that, for upper secondary education, the number of students between 2000-2012 shows a moment of significant decrease for the general track (from about 300 000 to 200 000). The opposite is observed for the professional/vocational courses (from less than 50 000 to slight more than 100 000) -- showing the main growth of students in upper secondary. Indeed, the annual rates of students in upper secondary indicate a decreasing rate when referring to the general academic track (varying between -0,2% and -10%, though decreasing less since 2009/10), while a growing rate for the professional/vocational tracks (varying between 1% and 50%, particularly high from 2006/07 and 2009/10), though in 2010/11 and 2011/12 decreasing drastically their variation to 3% (Figure A2.4 and Table A2.1).
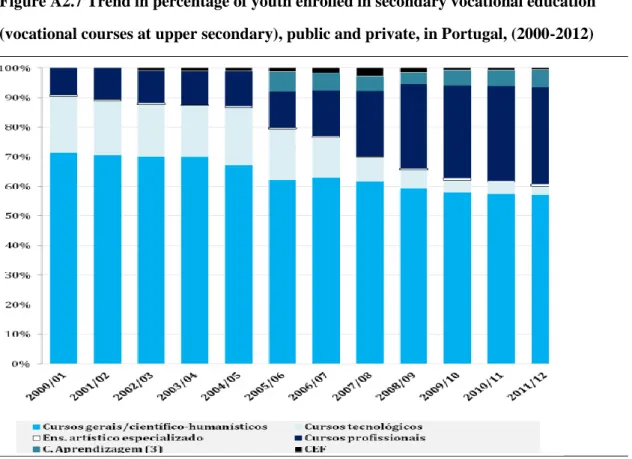
In sum, the general picture of students in upper secondary from 2000/01 to 2011/12 shows that: those in general education have decreased significantly, representing in a first moment more than 70% of total students and currently less than 60%5; those in technologic courses were 20% before but represent currently very residual numbers (around 2%); those in Apprenticeship, Education and Training Courses and Specialized Artistic have maintained their very residual proportions (less than 10% for the first, less than 5% for the second, and extremely residual for the latter); and differently from all the previous, those in professional courses increased significantly from less than 10% of total students in this educational level to more than 30%6 (Figure A2.5, Figure A2.6, Figure
A2.7).
Special Educational Needs
Since 1996/97 pupils with Special Educational Needs benefit from specific support once integrated in regular and compulsory education – currently from 6 to 18 years old. During the last 10 years, there was indeed an increasing law regulation7, fruitful in creating the conditions for universal access and support for the public with specific needs as well as for the professionalization of the staff and teachers. From 2008 onwards, the already existing teachers in special education were able to create a network of expertise for
5 Total numbers: decreasing from almost 300 000 students to almost 200 000 students, i.e., around 100 000 students less between 2000/01 to 2011/12, source: DGEEC (GEPE) (2000-2012).
6 Total numbers: increasing from less 40 000 students to almost 120 000 students, i.e., around 80 000 students more between 2000/01 to 2011/12, source: DGEEC (GEPE) (2000-2012)
7 In 2004, the General Legal Basis of the Regime for Prevention, Schooling, Rehabilitation and Participation of Individuals with Disabilities (Bases Gerais de Regime Jurídico da Prevenção, Habilitação, Reabilitação e Participação da Pessoa com Deficiência), based on the International Classification of Functioning, Disability and Health (ICF, ONU); in 2006, the decree for the Special Education Framework (Quadro da Educação Especial);
19 Special Education through the Resource Centers for Inclusion8(CRI) and in all schools
-- for all levels of compulsory education and pre--school in public and private institutions, social solidarity and specialized resource centers. Since then it has been possible to develop sustainable Individual Education Plans9 (PEI) and Specific Individual Curriculum10(CEI), compulsory in all schools. With the National Strategy for Disability for 2011-201311(ENDEF) there is a regulation concerning students’ post-schooling transition, i.e., covering the last three years of upper secondary and, in 2014, the current government created a working group to review the regulatory framework for special education.
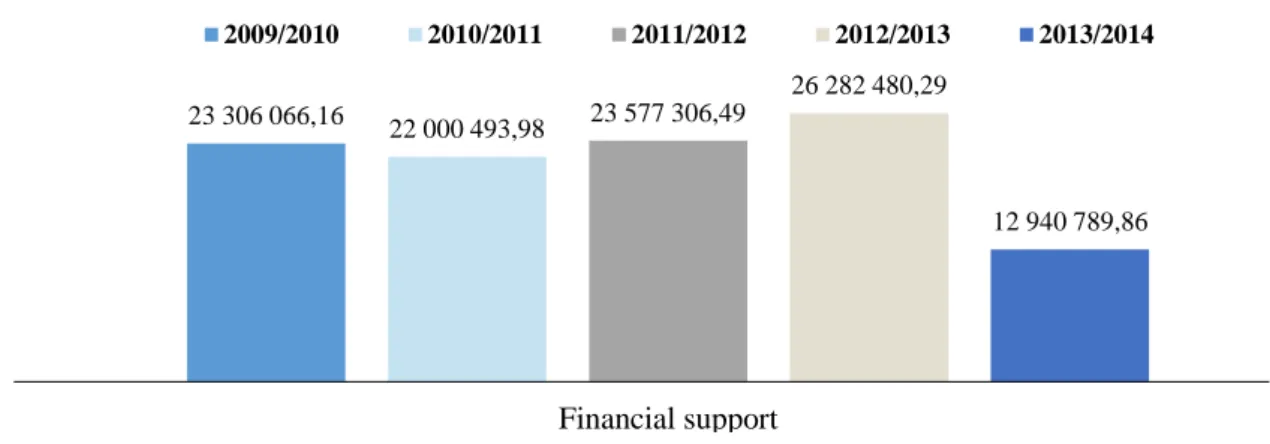
The numbers of applicants and holders for special education monthly allowance (for those aged 24 or less, integrated in special needs education training in schools), varied from 2009/10 to 2013/14. After increasing until 2011/12 there was a radical decrease to about half from 2012/13 to 2013/14 (from 13 015 applicants and 11 480 holders to 7 165 and 6 560, respectively). Similarly, the number of teachers trained for Special Education, after increasing since 2009/10, has diminished substantially from 2012/2013 to 2013/14, with 507 teachers less. Similar radical cuts are observed for global available allowances for special education (independently from being or not granted) – after some stabilization between 2009/10 to 2011/12, and a growth during 2012/13, it decreased radically in 2013/14 from 26 million to 13 million (Table A2.4, Figure A2.8). In addition, the number of CRI has continuously dropped between 2009/2010 to 2013/2014 from 132 to 89, the supported organic unities from 637 to 571, and private special education colleges from 17 to 15 (Table A2.2, Table A2.3)
However, students engaged in CRI have in general increased (from 13 000 to 15 000), contrary to the decrease of students in colleges (from 884 to 677). When analyzing the number of students having access to special needs services from 2009/10 to 2013/14 by educational level, this general growth varies by school level: three times more in pre-school, two times more in primary education, between three to four times more in lower education, and about five times more in secondary education. However, specifically for primary education these numbers decreased recently of 1 283 students less in 2013/14 (Figure A2.9). Moreover, exception within this disinvestment has been also the early
8 Centros de Recursos para a Inclusão -- CRI 9 Planos Educativos Individuais, PEI 10 Currículo Específico Individual, CEI 11 Estratégia Nacional para Deficiência, ENDEF
20 childhood intervention for special needs: teachers’ numbers have been continuously increasing (more 34 teachers in 2013/14), together with the stabilization of the reference clusters for early childhood intervention (about 136 in 2012/13), and the growth of children’s target (up to almost ten thousands, Table A2.1, Figure A2.9).
Non-compulsory education
Pre-primary education is the first step of the Portuguese Education System in a lifelong learning process, being an optional cycle for children from 3 to 5 year-olds, wherein the universality is enforced as a State guarantee for those 5 years or older12. The public network is composed of education institutions under the Ministry of Education and Science and the Ministry of Solidarity, Employment and Social Security, while the private network is composed of for-profit and non-profit education institutions.
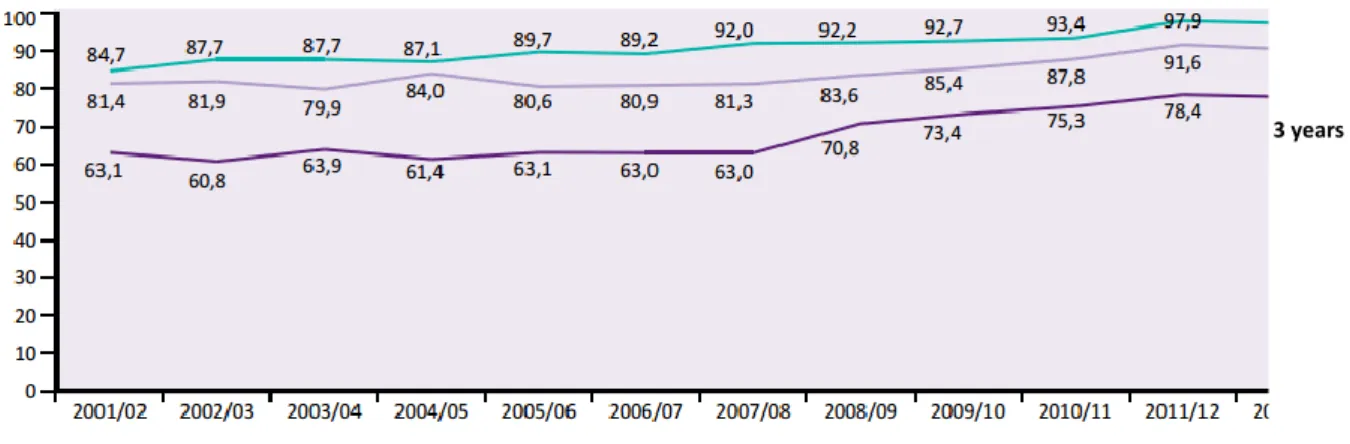
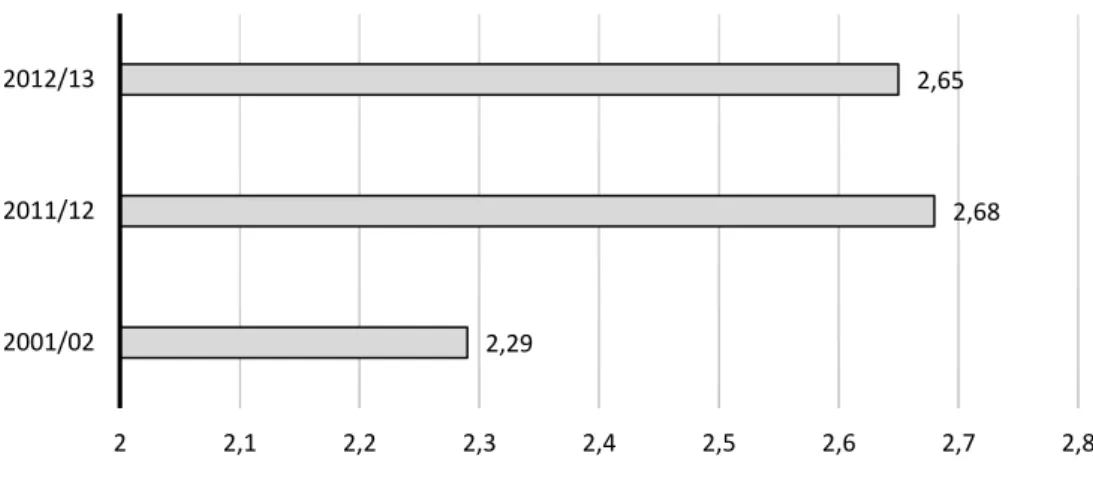
As referred previously, the number of pre-school teachers increased between 2000 and 2011 (Indicator 1 see appendix, from about 12000 to 17000), decreasing slightly in 2012. Similarly, the number of enrollments in pre-school (Figure A2.10) has continuously increased from 2000 to 2011 in about 47 000 more pupils (from 228 459 to 276 125), though with a slight decrease in 2012 to 272 547. Although the majority is aged 5, when analyzing by specific ages the growth is more significant among 3 years pupils between 2000 and 2012, followed by those aged 4 and 5 (though decreasing from 2011 onwards). The participation rate in pre-school has continuously increased from 2000 to 2012 -- from 77% to current 95% for all ages, being in 2012 78% for those aged 3; 92% for those aged 4; and above 97% for those aged 5 (Figure A2.10). However, like for the absolute numbers of pupils, 2012/13 indicates a slight decrease in these rates (and by age) as well as for the average length of pre-schooling from 2.68 years-length in 2011/12, to 2,65 in 2012/13 (Figure A2.10, A2.11, A2.12).
Post-secondary non-tertiary education13 is taught in higher education and non-higher
education establishments, offering Technological Specialization Courses14(CET). These are mainly provided by higher polytechnic institutions, in upper-secondary teaching establishments (autonomous schools, either public and private or cooperative), in vocational training centers (network coordinated by the Employment and Vocational Training Institute, IEFP), in technological schools (set up under joint ministerial
12 Law no. 85/2009, August 27
1313 Portaria nº989/99, Portaria nº392/2002, Decreto-Lei nº 88/2006 e Portaria nº782/2009 14 Cursos de Especialização Tecnológica - CET
21 dispatch), and other training institutions accredited by the Ministry of the Economy. They are designed for those aged 18 to 19 years and 23, awarding a qualification for levels 4 and 5 on the National Qualifications Framework (NQF). Data is available from 2003 onwards (Indicator 6 see appendix), showing increasing numbers from 638 attendances in 2003 to more than 9 000 in 2012, twice the number of men compared to women, the majority aged 20-24, followed by those 18-19 and those aged 25-29.
A diachronic reading of higher education indicators reveals an expansion of enrollments and graduations, resulting from an institutional diversification with the increase of public universities, polytechnics, from both public and private sectors. Overall, the evolution was not linearly and showing more oscillations concerning female students and the private sector: growing from 1990 until 2002/03 (from 150 000 to 400 000), decreasing until 2012 to 390 000 (Figure A2.15). Currently, higher education (ISCED 5-6) is divided in cycles: three years courses for the 1st cycle (bachelor degree); two years courses for the 2nd cycle (master degree); four years courses for the 3rd cycle (Doctoral degree). The latest figures released by the Agency for Assessment and Accreditation of Higher Education give an account of 5 128 accredited courses of which about half are from the 2nd cycle (master) and 696 PhDs.
The higher educational system includes university and non-university sectors (137 universities – 58% public sector; and 161 polytechnic – 60% public sector, see in appendix, Table A2.5). The main access of students has been centered in the public system, reinforced during the last 10 years, with the university sector being dominant compared to the polytechnics, the latter representing one third of the tertiary education’s enrolment (with slight inflections in the growth of this subsystem in 2008 and again in 2011).The number of vacancies has decreased in almost 4% during 2011-2013, while the number of inscriptions decreased in about 11% less (Table A2.6).
The Agenda 2020 – the European strategy for overcoming the economic and financial crisis -- imposes demanding goals with regard to the certification of the younger generation at the higher education level: at least 40% in the age group between 30 and 34 until 2020, already in EU with 37% in 2013, and in Portugal with almost 29%. However, a counter fact is the current public expenditure on higher education in relation to GDP and the annual expenditure in higher education institutions per student – both indicating a wider gap between Portugal and the whole of the EU, breaking deeper from 2007, and again in 2011. In addition, since 2010/2011 there is a potential reversal of the
22 expansionary demand for higher education, given the decline of first registers and the widening gap between the numbers of those who are able to attend a degree and enrolling effectively (Table A2.6).
Data on tertiary education teachers indicates, contrary to compulsory education, a singular stability of about 37 078 teachers within time (Figure A2.2). And differently from compulsory education, students’ numbers (Figure A2.3) increased though at a significant lower rate, growing between 2002 and 2004 followed by a break during 2006 and 2007, and again in 2012. Thus, even if from 2000 and 2012 there was a general growth of about 16 000 more students, a detailed analysis shows that from 2011 to 2012 tertiary education has, in reality, lost about 6 000 students. When analyzing these numbers by different age ranges, we can confirm that the main growth in tertiary education students is observed among the oldest students, i.e., for those aged 30 or older whose numbers have, in general, continuously increased from 51 251 to about 94 102 from 2000 to 2011. However, both the oldest (30 or more) and the youngest (less than 20) students do reverse from 2011 and 2012 (when tertiary education lost 5 869 students aged 30 or more, and 3 372 students aged less than 20). For the other age ranges, for instance aged 25-29, the decrease of students’ participation occurs in a long run -- after a significant growth from 67 754 to 77 398 students between 2000 and 2003, there is a main loss of students to 57 894 until 2012. Similarly, there was a net loss of students aged between 20 and 24 from 2000 and 2012 (from 19 7092 to 174 489 students), though occurring during an early period (between 2005 and 2010).
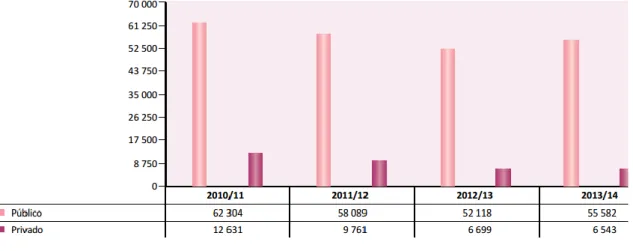
Last but not the least, tertiary education maintains a higher participation of women compared to men during all the period in analysis, and gender gap decreasing significantly within time (from about 30% difference to 15%). Indeed, it was among female students that the loss of students in tertiary education was the most important – while the balance for the number of male students resulted in a increase from 2000 to 2012 (from 162 524 to 181 515), the balance for number of female students during the same period decreased (from 211 221 to 208 758). Concomitantly, we have observed a decrease of 17% in the total number of students benefiting from social support: from about 74 000 in 2010/11 to about 62 000 in 2013/14 – meaning a decrease of total students covered from 19% to
23 17%, and affecting particularly the students in the private sector (from 14% to 10% of total students in the later sector, compared to 20% to 17% in the public sector) (see in appendix, Figure A2.17).
The most longstanding measure for adults’ education has been the recurrent education (since the Education Act 1986 - LBSE). It has been an educational offer framed as a special provision not integrated in the main educational system and mimetizing the educational, curricular and pedagogic programmes frammed for children and youth in school age and daily school. After a period of discussion around the design and operation of this system (2000-2005), there was a new period of significant growth in terms of network Centres (2006-2008), followed by the stabilization of new operational structures (2009-2011). This process started with the creation of the National Agency for Education and Training of Adults in 1999 (ANEFA), the Adults’ Education and Training courses in 2000 (EFA, with dual certification -- academic and professional); the creation of the Centers for Recognition, Validation and Certification of Competences 2000-2001; and, finally, the New Opportunities Initiative and the NO centers, substituting the main recurrent education offers in schools’ clusters and training institutions between 2005-2011. As a result, recurrent education was reduced to a minimum since 200515, when educational policies presented a significant effort to improve the qualifications of the Portuguese adult population.
The above mentioned measures allowed to promote the access to the 4th, 6th, 9th or 12th
grades for adults, resulting in a significant growth of adults’ education and training between 2007 and 2011 (from 4,4% to 11,6%, and to 10% in 2013). (Rodrigues et al, 2014). Indeed, students’ number by age groups (Indicator 8 see appendix) clear indicate that the period of significant students’ growth for lower and upper secondary education occurred between 2007 – 2010, overlapping the increase of students over 20 years old, with the highest growth for those 40 or older. These figures reveal the impact of last ten years adults’ education. However, we can also confirm a reversing trend from 2010-2011
15 A significant decrease on recurrent education can be observed from 2007/08 onwards, and particularly radical for 2011/12 (the most recent data available). If in 2001/02 adults engaging this education were 50 218 in basic education and 79 806 in upper secondary, in 2011/12 they have radically declined to 80 and 6 068 (respectively) – being true for both and public offers, and women and men alike (see in appendix tables 3.2.18 and 3.2.19, and figures 3.2.11 and 3.2.12, CNE Estado de Educação 2013, pp.151).
24 onwards, a trend that will be even more evident from 2013. This is due to the interruption of NO process since 2013, and adults’ education taken on by the Qualification and Vocational Training Centres and the National Agency for Qualification and Vocational Training (Agência Nacional para a Qualificação e Ensino Profissional, ANQEP) – more focused on employability and less on education, thus, less present in schools and more in professional training centers.
National sources (CNE) show clearly these evolutions: if for basic education adults´ enrolment jumped from 14 811 in 2006/07 to 43 641 in 2007/08, and again to 159 149 in 2008/09 (mainly due to RVCC offers), it started to decreased since 2010/11 to 104 793 but most significantly in 2012/13 to 25 325 (see in appendix table 3.2.16, CNE Estado de Educação 2013, pp.149). A similar trend was observed when analyzing adults’ participation in upper secondary education and training: from 47 177 in 2007/08 to 169 190 in 2008/09, and later 36 615 in 2012/13 (see in appendix table 3.2.17, CNE Estado de Educação 2013, pp.149). More recently, between 2012 and 2013, the number of EFA, RVCC and CNO promoters decreased to half or even less: a) EFA in basic education was reduced from 46 to 28 (existing mainly in professional training centers and not in public schools), while in upper secondary from 30 to 10 (in general) (see in appendix tables 3.2.21 and 3.2.22., CNE Estado de Educação 2013, pp.153); b) RVCC and CNO centers from 424 to 203 (see in appendix, Figure A2.18).
Last but not least, enrolment rates for the population aged between 15 and 24 for the period under analysis (Figure A2.16) confirm previous studies conclusions of improvement, and for all levels of education (ISCED 1-6, from 51% in 2000 to 62% in 2012). This improvement is, as expected also, more significant if individuals are aged 16-18 compared to older ones (from 72% in 2000 to 89% in 2012). Gender differences indicate that since 2000, female enrolment is higher for those between 16 and 22 years old, while for the older population gender differences are either smaller or more unstable, but the improvement on population coverage observed from 2000 onwards has affected more the men compared to women.
25 12,559 16,995 16,892 61,506 66,956 59,955 38,587 48,953 42,183 46,638 46,343 47,718 36,187 35,178 37,078 10 20 30 40 50 60 70 80 2 0 0 0 2 0 0 1 2 0 0 2 2 0 0 3 2 0 0 4 2 0 0 5 2 0 0 6 2 0 0 7 2 0 0 8 2 0 0 9 2 0 1 0 2 0 1 1 2 0 1 2 T h o u san d s
Pre-primary education (level 0) Primary education or first stage of basic education (level 1) Lower secondary or second stage of basic education (level 2) Upper secondary education (level 3)
First and second stage of tertiary education (levels 5 and 6)
Annexes
Figure A2.1. Number of teachers in Portugal, for all educational levels, 2000-2012
Source: Eurostat
Figure A2.2 Number of teachers in Portugal, by all educational levels, 2000-2012
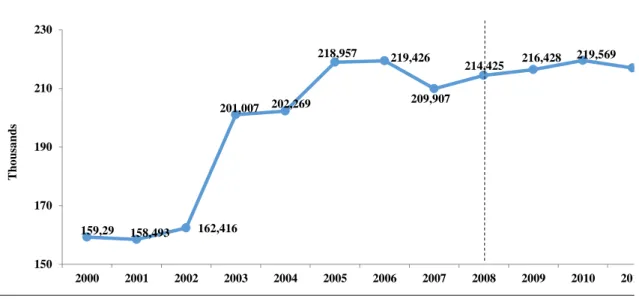
Source: Eurostat 159,29 158,493 162,416 201,007 202,269 218,957 219,426 209,907 214,425 216,428 219,569 216,939 150 170 190 210 230 2000 2001 2002 2003 2004 2005 2006 2007 2008 2009 2010 2011 T h o u sa n d s
26 Figure A2.3 Number of students in Portugal, by educational levels, 2000-2012
Source: Eurostat
Note: ISCED 0 (Pre-primary education); ISCED 1 (Primary education or first stage of basic education); ISCED 2 (Lower secondary or second stage of basic education); ISCED 3 (Upper secondary education); ISCED 4 (Post-secondary non-tertiary education); ISCED 5-6 (First and second stage of tertiary education).
Figure A2.4 Evolution of the number of young people enrolled in secondary education and vocational courses, public and private, in mainland Portugal (2000-2012)
228459 272547 816472 720098 424364 437713 417705 411238 638 9887 373745 390273 0 200000 400000 600000 800000 1000000 1900000 2000000 2100000 2200000 2300000 2400000 2500000 2000 2001 2002 2003 2004 2005 2006 2007 2008 2009 2010 2011 2012 T OT A L
All levels (Total) ISCED 0 ISCED 1 ISCED 2
ISCED 3 ISCED 4 ISCED 5-6
Upper secondary education
Regular upper secondary (in walf-way)
Vocational courses at upper secondary
27 Source: DGEEC (GEPE) (2000-2012) - Adapted from CNE Technical report Ensino e Formação Profissional Dual (2014), pp.16, Figure 2 (Gráfico 2)
http://www.cnedu.pt/content/noticias/CNE/RelatorioTecnico_profdual.pdf
Table A2.1 Annual change rates in the number of enrolled young secondary, via education, public and private, in mainland Portugal 2001-2012 (%)
2001/0 2 2002/0 3 2003/0 4 2004/0 5 2005/0 6 2006/0 7 2007/0 8 2008/0 9 2009/1 0 2010/1 1 2011/1 2 Upper secondar y -6,5 -4,2 -0,4 0,6 -8,3 4,7 3,2 9,2 3,8 0,9 1,1 Regular upper secondar y -8,1 -5,3 -0,9 -0,2 -9,6 -0,2 -7,3 -3,9 -1,9 -0,5 -0,9 Vocation al courses 10,3 -1,9 1,8 7,3 -0,8 33,4 49,5 34,6 15,3 3 2,7
Source: DGEEC (GEPE) (2000-2012) - Adapted from CNE Technical report Ensino e Formação Profissional Dual (2014), pp.16, Table 1 (Quadro I)
http://www.cnedu.pt/content/noticias/CNE/RelatorioTecnico_profdual.pdf
Figure A2.5 Evolution of the number of young people enrolled in vocational education (vocational courses at upper secondary), public and private, in mainland Portugal (2000-2012)
28 Source: DGEEC (GEPE) (2000-2012) - Adapted from CNE Technical report Ensino e Formação Profissional Dual (2014), pp.17, Figure 3 (Gráfico 3)
http://www.cnedu.pt/content/noticias/CNE/RelatorioTecnico_profdual.pdf
29 Figure A2.6 Trend in percentage of youth enrolled in secondary vocational education (vocational courses at upper secondary), public and private, in Portugal, (2000-2012)
Source: DGEEC (GEPE) (2000-2012) - Adapted from CNE Technical report Ensino e Formação Profissional Dual (2014), pp.18, Figure 4 (Gráfico 4)
30 Figure A2.7 Trend in percentage of youth enrolled in secondary vocational education (vocational courses at upper secondary), public and private, in Portugal, (2000-2012)
Source: DGEEC (GEPE) (2000-2012) - Adapted from CNE Technical report Ensino e Formação Profissional Dual (2014), pp.19, Figure 5 (Gráfico 5)
http://www.cnedu.pt/content/noticias/CNE/RelatorioTecnico_profdual.pdf
Table A2.2 Number of Resource Centres for Inclusion (CRI - Centro de Recursos para a Inclusão), supported organizational units (UO – Unidades orgânicas apoiadas) and number of students with SEN covered, in Mainland Portugal, between 2009 and 2014
CRI UO Students 2009/2010 132 (*) 637 13 211 2010/2011 129 (*) 637 14 099 2011/2012 109 (*) 551 12 868 2012/2013 107 (*) 558 13 696 2013/2014 89 571 15 041
Source: Adapted from CNE Estado de Educação (2013), pp.125, Table 3.2.1. (Tabela 3.2.1.) http://www.cnedu.pt/content/edicoes/estado_da_educacao/Estado-da-Educacao-2013-online-v4.pdf
Note: (*) Inclui projetos de parceria ao abrigo da Portaria nº 1102/97, de 3/11
Translation (from left to right): General courses /scientific-humanistic; Specialized artistic education; learning courses;tech studies;occupational courses;
31 Table A2.3 Number of Resource Centres for Inclusion (CRI - Centro de Recursos para a Inclusão), supported organizational units (UO – Unidades orgânicas apoiadas) and number of students with SEN covered, by NUTS 2 regions. 2013/2014
CRI UO Students Mainland portugal 89 571 15 041 Alentejo 14 67 2 015 Algarve 1 7 125 Centro 32 151 4 737 Lisboa 19 159 5 383 Norte 23 187 2 781
Source: Adapted from CNE Estado de Educação (2013), pp.125, Table 3.2.2. (Tabela 3.2.2.) http://www.cnedu.pt/content/edicoes/estado_da_educacao/Estado-da-Educacao-2013-online-v4.pdf
Note: (*) Inclui projetos de parceria ao abrigo da Portaria nº 1102/97, de 3/11
Table A2.4 Applicants and holders (No.) of financial support for special education, by NUTS 2 regions, between 2009 and 2014
Source: Adapted from CNE Estado de Educação (2013), pp.129, Table 3.2.5
(Tabela 3.2.5)
http://www.cnedu.pt/content/noticias/CNE/RelatorioTecnico_profdual.pdf
Figure A2.8 Financial support for special education (in EUR, mainland Portugal (2009-2014)
32 Source: Adapted from CNE Estado de Educação (2013), pp.129, Figure 3.2.4 (Figura 3.2.4)
http://www.cnedu.pt/content/noticias/CNE/RelatorioTecnico_profdual.pdf
Figure A2.9 Evolution of the number of students with SEN, by cycles and levels of education, Mainland Portugal (2009-2014)
Source: DGESTE, 2014. Adapted from CNE Technical report Políticas Públicas de Educação Especial, pp.27, Table IV (Tabela IV).
Figure A2.10 Evolution of pre-school enrollment rate (%) by age (5, 4 ad 3 years) Portugal 23 306 066,16 22 000 493,98 23 577 306,49 26 282 480,29 12 940 789,86 Financial support 2009/2010 2010/2011 2011/2012 2012/2013 2013/2014 2992 16873 13616 17299 6106 1055 8220 5025 4860 1314 20474 0 10000 20000 30000 40000 50000 Pre-primary Basic education Primary education Lower secondary Upper secondary education
Total 2009/2010 2010/2011 2011/2012 2012/2013 2013/2014 5 years 4 years
33 Source: Data and graph from CNE, Estado da Educação 2013, pp. 117, figures 3.1.4.
Figure A2.11 Evolution of the real rate of pre-school (%), in Portugal
Source: DGEEC / DSEE – DEEBS, graph from CNE, Estado da Educação 2013, pp. 117, figures 3.1.5.
34 Figure A2.12 Evolution of the real rate of pre-school (%), in Portugal
Source: DGEEC / DSEE – DEEBS, graph from CNE, Estado da Educação 2013, pp. 117, figures 3.1.6.
Figure A2.13 Participants in early education - as % of inhabitants of the corresponding age group, in Portugal, (2000-2012)
Source: Eurostat 61 499 78 646 75 214 90 059 86 348 98 925 5 398 4 917 0 20 000 40 000 60 000 80 000 100 000 120 000 2 0 0 0 2 0 0 1 2 0 0 2 2 0 0 3 2 0 0 4 2 0 0 5 2 0 0 6 2 0 0 7 2 0 0 8 2 0 0 9 2 0 1 0 2 0 1 1 2 0 1 2
3 years 4 years 5 years 6 years
2,29 2,68 2,65 2 2,1 2,2 2,3 2,4 2,5 2,6 2,7 2,8 2001/02 2011/12 2012/13
35 Figure A2.14 Participants post-secondary non-tertiary education- as % of inhabitants of the corresponding age group, in Portugal, (2005-2012)
Source: Eurostat
Note: Data before 2004 not available
Figure A2.15 Participants first and second stage of tertiary education- as % of inhabitants of the corresponding age group, in Portugal, (2000-2012)
Source: Eurostat 2 454 4 257 1 317 800 481 578 0 500 1 000 1 500 2 000 2 500 3 000 3 500 4 000 4 500 2 0 0 5 2 0 0 6 2 0 0 7 2 0 0 8 2 0 0 9 2 0 1 0 2 0 1 1 2 0 1 2 From 15 to 19 years From 20 to 24 years
From 25 to 29 years From 30 to 34 years From 35 to 39 years 40 years or over
0 50 000 100 000 150 000 200 000 250 000 2 0 0 0 2 0 0 1 2 0 0 2 2 0 0 3 2 0 0 4 2 0 0 5 2 0 0 6 2 0 0 7 2 0 0 8 2 0 0 9 2 0 1 0 2 0 1 1 2 0 1 2 From 15 to 19 years From 20 to 24 years
From 25 to 29 years From 30 to 34 years From 35 to 39 years 40 years or over
36 Figure A2.16 Participation/ Enrolment in education by sex age ranges, all ISCED (1-6) - as % of corresponding age population
Source: Eurostat
Table A2.5 Establishments (No.) Higher Education (organizational units)
University Polytechnic
Public Private Public Private
80 57 97 64
Total 137 161
Source: DGEEC / DSEE – DEEBS, graph from CNE, Estado da Educação 2013, pp. 93, figures 2.3.2.
Table A2.6 Relationship between supply and demand in the public higher education in the 1st phase of tendering, by areas of education and training
51,1 71,8 44,7 34,1 54,7 76,2 50,2 38,4 47,5 67,6 39,5 29,9 56,2 82,6 47,5 34,3 59,4 86 53,4 37,7 53,2 79,4 41,8 62,1 89,4 55,8 38,7 63,8 91,1 61,1 40,8 60,4 87,8 50,6
15-24 16-18 aged 20 aged 22 15-24 16-18 aged 20 aged 22 15-24 16-18 aged 20 aged 22
Total Female Male
37 Source: DGEEC / DSEE – DEEBS, graph from CNE, Estado da Educação 2013, pp. 103, figures 2.3.11
Figure A2.17 Scholarship holders (No.) of Higher Education, in public (público) and private (private) education.
Source: PORDATA, graph from CNE, Estado da Educação 2013, pp. 105, figures 2.3.3
Figure A2.18 Number of Centers for Recognition, Validation and Certification of Competences (RVCC) and centers of New Opportunities in Portugal, between 2000 and 2013
38 Source: ANQ, I.P, ANQEP graph from CNE, Estado da Educação 2013, pp. 157, figures 3.2.16
39 A3. Processes and mechanisms of monitoring and evaluating the educational system
Southern European countries have always assumed students’ evaluation as a central issue, with a strong ranking and punitive load, while for the teachers and the organizations, a systematic and external evaluation has been scarcer (Veloso, Abrantes & Craveiro, 2011). Within this picture, schools’ evaluation has followed a more formative, participatory, qualitative format, without punitive effects, justified by a need for social certification from the public institutions to its citizens. Nevertheless, it is easy to identify for the last 20 years multiple projects and experiences, underlying a notion of quality pointed by several international entities, but whose duration and scope have still not directly provided an « organizational assessment culture » in the schools and the system itself (Coelho, Sarrico, & Rosa, 2008, citados em Veloso, Abrantes & Craveiro, 2011). Discussing on the quality assessment for the Portuguese educational system implies a reference to the new legislation in terms of teachers’ career status and the management of state schools (in Torres and Palhares 2009, cited in Veloso, Abrantes & Craveiro, 2011). In the new legislation, dimensions of professional hierarchy, discipline, and leadership emerge strengthened, reforming the democratic management of schools and the relationships between the teachers (in Veloso, Abrantes & Craveiro, 2011).The quality assurance of education in Portugal is framed in the basic principles of the educational system, pay rolled in the Constitution, the Basic Education Law, and the fundamental legislation on schools’ evaluation. Within the Portuguese context, we refer to advices and recommendations from the National Education Council (CNE), the General Inspection for Education (IGE), as well as the general trend for the globalization of the educational systems, where international entities, such as the European Union (EU), the OCDE (Organization for Economic Co-operation Development) and the United Nations Educational, Scientific and Cultural Organization (UNESCO) have played their part through studies and recommendations. Moreover, we may say that it was from these international studies and models that the current external evaluation system was built in Portugal (Veloso, Abrantes & Craveiro, 2011; Lemos, 2014).
Briefly, the OCDE, the International Association for the Evaluation of Educational Achievement (IEA) and the European Commission (CE) have promoted international programs evaluating children’s and youth’s performance worldwide, in math’s, sciences, reading and foreign languages. Since 1991, Portugal has participated in
40 comparative studies on educational achievements (the International Assessment of Educational Progress (IAEP I and II); IIEES --‒ International Indicators and Evaluation of Educational Systems; PISA ‒ Program for International Students Assessment; TIMSS - Trends in International Mathematics and Science Study; PIRLS ‒ Progress in International Reading Literacy Study; ESLC - European Survey on Language Competences; IECL; EAG - Education at a Glance, etc…). These participations revealed a major influence in the development of OCDE’s instruments for examining national policies worldwide, focusing in the organization of each educational system and recommending specific public policies. The main aim has been to construct, compile, consolidate and disseminate international comparable indicators, through what later became the IIEES, for further uses on governance mechanisms, standards and benchmarks, and into detail of prescribing behavior and to influence convergence processes between countries.
The Portuguese participation in these international assessments has been coordinated by the national institutions responsible for monitoring education in Portugal ‒ first the Institute for Educational Innovation (IIE) in 1989, replaced by the Office of Educational Assessment (GAVE) in 1997, and currently the Institute of Educational Assessment (IAVE I.P.) since 2012. The main steps for the Portuguese participation in this process can be identified in the following key moments:
1) In 1987, during the OCDE evaluation on Portuguese educational policies, whose main recommendation was on the need to invest more on the initial professional training for youth;
2) In 1989; 1990; 1991 – when large-scale surveys were applied to teenagers aged 14-15 years old, finishing basic education;
3) In 1991, with the first Portuguese participation in a comparative study named the IAEP II ‒ on mathematics and science achievement of 9 and 13 years old students in 10 countries (co-coordinated by the Center of the Assessment of Educational Progress, a division of the Educational Testing Service, ETS, Princeton, New Jersey);
4) In 1995, with the participation in a comparative study named the Trends in International Mathematics and Science Study (TIMSS) ‒ measuring trends in mathematics and science achievement for the pupils attending the fourth and eighth