i i
“main” — 2017/12/26 — 13:53 — page 565 — #1
i i
Revista Brasileira de Geof´ısica (2015) 33(4): 565-578 © 2015 Sociedade Brasileira de Geof´ısica ISSN 0102-261X
www.scielo.br/rbg
THE PALEO-ENVIRONMENTAL SETTING OF SEPETIBA BAY, RIO DE JANEIRO, BRAZIL,
IN THE LATE PLEISTOCENE: INTERPRETATIONS FROM
HIGH-RESOLUTION SEISMIC STRATIGRAPHY
Heloisa Vargas Borges
1and Charles A. Nittrouer
2ABSTRACT.Single-channel high-resolution seismic profiles in Sepetiba Bay, Brazil, were collected to describe the recent geological evolution of this area. The seismic data showed the existence of a discontinuity surface and two seismic units (Top and Bottom). The seismic-data interpretation and radiocarbon dating indicate that before the Holocene transgression (late Pleistocene) Sepetiba Bay was exposed to erosional processes. The paleo-topography consisted of a plain with some higher elevations (now islands of bedrock), a topographic high in the southern part of the bay (now the barrier island) and a sinuous river channel that ran parallel to the topographic high, perhaps exiting near Marambaia Peak. Other nearly coastal environments (e.g., Barra da Tijuca and Recreio dos Bandeirantes) are at various stages of evolution, at present insights to past conditions in Sepetiba Bay.
Keywords: Pleistocene, geological evolution, seismic stratigraphy, radiocarbon dating.
RESUMO.Perfis s´ısmicos de alta resoluc¸˜ao da Ba´ıa de Sepetiba, Brasil, foram coletados com o objetivo de descrever a evoluc¸˜ao geol´ogica recente desta ´area. Os dados s´ısmicos mostraram a existˆencia de uma superf´ıcie de descontinuidade e duas unidades s´ısmicas (topo e base). A interpretac¸˜ao dos dados s´ısmicos e a datac¸˜ao por radiocarbono indicaram que antes da transgress˜ao Holocˆenica (Pleistoceno Superior), a Ba´ıa de Sepetiba foi exposta a processos erosionais. A paleotopografia consistiu de uma plan´ıcie com algumas elevac¸˜oes (atualmente ilhas do embasamento), um alto topogr´afico na parte sul da ba´ıa, (uma ilha barreira no presente) e um canal fluvial sinuoso que flui paralelo ao alto topogr´afico, provavelmente desembocando pr´oximo ao Pico da Marambaia. Outros ambientes costeiros pr´oximos (p.ex. Barra da Tijuca e Recreio dos Bandeirantes), em v´arios est´agios de evoluc¸˜ao, s˜ao exemplos atuais para a compreens˜ao das condic¸˜oes do passado da Ba´ıa de Sepetiba.
Palavras-chave: Pleistoceno, evoluc¸˜ao geol´ogica, estratigrafia s´ısmica, datac¸˜ao por radiocarbono.
1Universidade Federal Fluminense, Geosciences Institute, Geology Department, Av. Gal. Milton Tavares de Souza, s/n, 4◦andar, Campus da Praia Vermelha, Gragoat´a,
24210-310 Niter´oi, RJ, Brazil. Phone: +55(21) 2629-5930; Fax: +55(21) 2629-5931 – E-mail: [email protected] 2University of Washington, School of Oceanography, Box 357940, Seattle, WA, Phone: ++1 206 543-5099; Fax: 1 (206) 6851732 – E-mail: [email protected]
shelves. These changes in sea-level and associated changes in sedimentary processes can be interpreted from seismic-reflection observations and can be used to reconstruct the geological evolution of coastal areas.
The main objectives of the present paper are to reconstruct the depositional environments that existed in Sepetiba Bay, a back-barrier environment in southern Brazil, before the Holocene transgression, and to place its evolution in a regional geologi-cal context. High-resolution seismic profiles and vibracores are used to define depositional units and the unconformity that sepa-rates them.
STUDY AREA
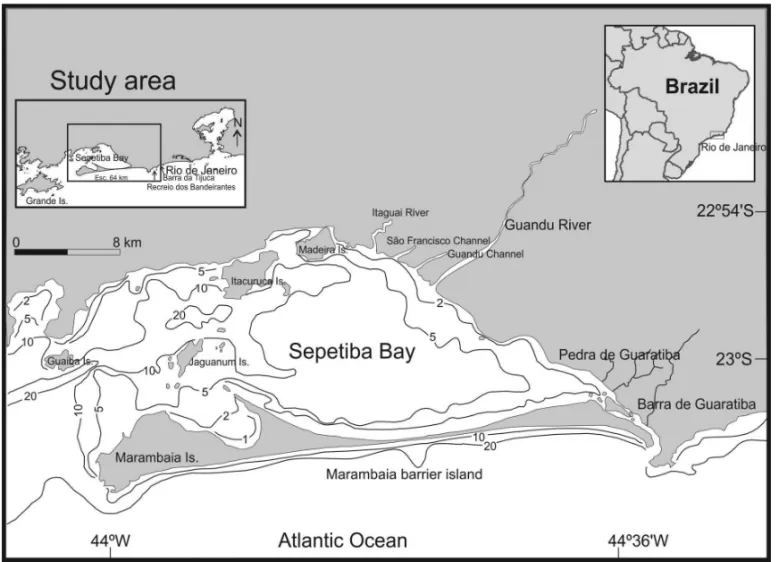
Sepetiba Bay is located in the State of Rio de Janeiro, along the southeastern coast of Brazil (Fig. 1). Sepetiba Bay is an elliptical embayment with an area of∼ 300 km2. It is open to the ocean at two sites: through a tidal channel at Barra de Guaratiba at the east end and through a series of larger channels at the west end (Fig. 1).
The western region is partially closed by a chain of islands including Itacuruc¸´a, Jaguanum and Marambaia, which follow a structural lineation NE/SW of the area. Bathymetry between the islands shows maximum depths of 24-31 m. The bay, itself, is shallow: about 8 m deep in the center with depth decreasing to-ward the coast. A coastal mountain range with elevations from 800-2200 m forms the western limit of the area. The coastal plain adjacent to this mountain range has elevations of less than 100 m. Marambaia barrier island, which encloses the bay, is oriented east-west and is 45 km long. It is attached to Marambaia Is-land, a rock island 640 m high on the west side, and is separated from the mainland in the east by a 300-m wide tidal channel. The continental shelf adjacent to the barrier island is 200 km wide and has a moderate inclination of 1:700 (Zembruscki, 1979).
Granites, gneisses, and migmatites form the Precambrian and Paleozoic basement in the bay region. Basic and alkaline rocks represent the Mesozoic and Tertiary. The coastal plain, composed of mangroves, dunes, beaches, and alluvial plains, was formed in the Quaternary.
of Sepetiba Bay is east-west (Fig. 2). The ocean waves and wind are predominantly east and northeast (US Navy, 1992; Borges, 1990). The tide in the area has a moderate to small amplitude of 110 cm during spring tide and 30 cm during neap tide. There is a difference in tidal phase of about 15 minutes between the en-trances and the far interior of the bay (DHN, 1986; IBGE, 2011). Sepetiba Bay can be divided into three compartments based on its hydrographic and geographic characteristics: brackish (3-18‰, at Guand´u river mouth), hyposaline (18-30‰, most of the bay) and hypersaline (30-40‰, near the islands and northwest and southwest parts of the bay) (Moura et al., 1982).
The fluvial contribution to Sepetiba Bay comes from Guand´u, Itagua´ı, Mazomba, Cabuc¸´u, and Pirac˜ao Rivers (Fig. 2). Two of these rivers, the Itagua´ı and the Guand´u, were modified during the 1940s into artificial, fixed channels. After these changes the largest river, Guand´u, received additional discharge from other small rivers of the region.
BACKGROUNG
A previous study of the geology in Sepetiba Bay, based on a high-resolution seismic survey, was undertaken by the Brazilian oil industry and is limited to a small area at the Guand´u river mouth (Fig. 4) (Figueiredo et al., 1989). The data were collected with a Uniboom system and four seismic units were identified to a subbottom depth of 30 m (Fig. 3). These units are named Verde, Laranja, Roxa, and Azul.
The uppermost unit, Verde, was found throughout the area and is characterized by continuous, long, parallel reflectors. It is thicker to the north (8 m) and thinner to the south, filling depressions and river channels. Sedimentological analyses of samples recovered by drilling show that this unit is composed of fine-grained sediments. The second unit, Laranja, is separated from the upper unit by a strong, continuous and irregular reflector. Drill samples from this unit indicate it consists of sand alternat-ing with fine-grained sediments. Its mean thickness is 5 m. The third unit, Roxa, is separated from the Laranja unit by an undulat-ing continuous reflector. Internal reflectors indicate that this unit is composed of sand. The deepest unit resolved, Azul, underlies
i i
“main” — 2017/12/26 — 13:53 — page 567 — #3
i i
BORGES HV & NITTROUER CA
567
Figure 1 – Sepetiba Bay study area and general bathymetry. Right insert shows the area along the south Brazilian coast. Left insert shows location of Sepetiba
Bay south of Rio de Janeiro City.
the Roxa unit and is limited in places by the crystalline basement. It is characterized by having few internal reflectors. According to Figueiredo et al. (1989), the Verde unit was deposited at the end of the most recent transgressive phase. The lower three units were deposited in terrestrial environments during one or more lower sea-level stages.
The results of the seismic interpretation from Figueiredo et al. (1989) provided a preliminary stratigraphic understanding of the area, but it was based on a limited spatial survey. The present work intends to describe the seismostratigraphy of Sepetiba Bay using a geophysical survey that covers the entire area. The in-terpretation of the seismic data will answer unresolved questions related to evolutionary history of the bay and formative pro-cesses for Marambaia Barrier Island.
METHODS Seismic profiles
The field data for this study consist of 41 single-channel high-resolution seismic-reflection profiles (Fig. 4) collected in 1996 and 1997 with a 200-kHz acoustic source and recorded by analog
techniques (Model SH-20, Senbon Denki Co., Numazu, Japan). The seismic-reflection profiles were plotted on a nautical chart with positions obtained by a Global Positioning System (GPS).
Identification of Seismic Units
Discontinuity-bounded sequences were mapped on all seismic profiles and their distribution in the area was plotted on a seis-mic navigation track. The depositional events and processes were interpreted by analyzing the configuration of these disconti-nuities and the nature of the boundary reflectors.
SEDIMENTOLOGY AND GEOCHRONOLOGY Field
Subsurface sediment samples in Sepetiba Bay were taken from a floating platform using a vibracore system (similar to Lanesky et al., 1979), with 7.5-cm-diameter aluminum vibracore barrels. The core (VC1, Lat. 23◦02.047’S, Long. 43◦38.025’W) was∼ 5 m in length and the station was chosen so as to sample at least two seismically identified units (Fig. 4).
Figure 2 – Current system at Sepetiba Bay. The cold and dense water enters the bay as bottom currents, circulates clockwise through the bay,
becomes warmer, and exits as surface currents.
Figure 3 – Seismic profile from Figueiredo et al. (1989), showing units Verde, Laranja, Roxa and Azul. Profile is marked as ‘5017’ on Figure 4.
Laboratory
Grain-size analyses were performed for surface and subsurface samples, using a SediGraph model 5100ET for the mud fraction (Coakley & Syvitski, 1991), and a 180-cm settling tube for the
sand fraction (Syvitski et al., 1991).
The vibracore liner was cut lengthwise in the laboratory with a circular saw and split in 3 sections with a wire. The central part of the core was divided in 30-cm-long and 1.5-cm-thick sections,
i i
“main” — 2017/12/26 — 13:53 — page 569 — #5
i i
BORGES HV & NITTROUER CA
569
Figure 4 – Ship track of seismic profiles in Sepetiba Bay, collected during 1996 (numbered lines) and 1997 (lettered lines) with
geograph-ical location of vibracore (VC1). Profiles followed lines corresponding to minutes of latitude and longitude, parallel and perpendicular to Marambaia Barrier Island. Line names are shown at the south or east end of each line. Bold lines mark location of illustrated seismic profiles.
placed in Plexiglas trays, photographed, X-rayed and described for stratigraphy. Of the two remaining lengthwise parts, one was subsampled for bulk density, radiocarbon, and grain-size analy-ses, and the other was saved as an archive sample.
RESULTS
Seismic Stratigraphy
Two seismic stratigraphic units were identified in the geophysical survey of Sepetiba Bay: Top and Bottom. These two seismic units are separated by a discontinuity.
The discontinuity surface (i.e., interface with pre-Holocene sediments) is well represented in almost all profiles taken in Sepetiba Bay (Figs. 5, 6, 7 and 8).
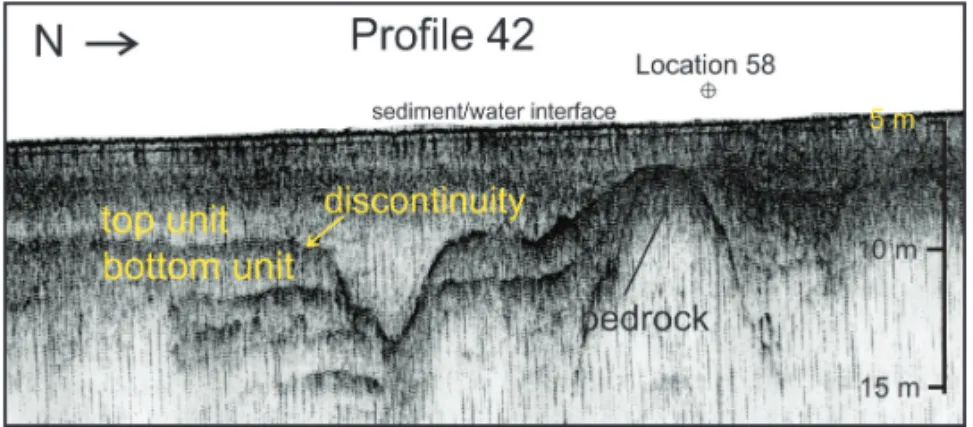
Top unit: The layer represented by the Top unit is distributed throughout the bay (Figs. 5 and 6). The thickness of this unit is 9-11 m in the north, becoming thinner toward Marambaia Barrier Island, where it pinches out. In the northern Bay, at the present location of the Guand´u river mouth (Fig. 1), a deltaic lobe with well defined progradation was identified within the base of Top unit, indicating the existence of a late Holocene delta (Fig. 7). As demonstrated by direct sampling at VC1 where the Top unit is 2.8 m thick (Fig. 4), there are different sedimentary environ-ments within the Top unit, consisting of: a) bioturbated mud with shell fragments on the top, b) a laminated zone, characteristic of a tidal channel, and c) sandy mud to mud in the bottom of the unit (Figs. 9 and 10). These different sedimentary deposits are consis-tent with a marine origin.
Bottom unit: The top of the Bottom unit is defined by a dis-continuity surface present in all profiles. The thickness of this unit is variable and difficult to evaluate from the seismic records in some areas. It is possible to measure its thickness in regions where crystalline bedrock is shallow (Fig. 5). Where sampled, the Bottom unit is composed of medium sand, semi-consolidated with a dark brown color, characteristic of subaerial deposits (VC1, Figs. 9 and 10).
A topographic diagram of each surface (top of the Top unit and top of Bottom unit) was constructed relative to present sea-level. The top of the Top unit (equivalent to the sediment sur-face) slopes toward the southwest with a depression parallel to Marambaia Barrier Island (Fig. 11a). Channels are found near the islands in the western part of the bay. The top of Bottom unit slopes toward the southwest, with an incised river valley along the southern part and a topographic high on the southern bound-ary (Fig. 11b). The channel has two possible paths where it ap-proaches Marambaia peak, one through the depression going south towards Pombeba spit, and the other through a depres-sion westward. A second channel occurs at the northwest of the area, near the modern Guand´u river mouth. This channel runs southwest, between two highs, and exits in the depression be-tween Marambaia and Jaguanum islands. Isolated highs (base-ment outcrops) are found in the northeast part of the bay (pro-files 42 and 43), in the southeast near the topographic high (profile 45), and in northwest area, near the Guand´u river mouth (profile 48).
Figure 5 – Seismic record of Profile 42 showing Top and Bottom units, the discontinuity surface, a small buried channel, and bedrock. Subbottom
depth is measured assuming a seismic velocity of 1500 m/s. “Location 58” marks a navigation fix. Profile is marked as ‘5’ on Figure 4.
Figure 6 – Seismic record of Profile 41 showing, Top and Bottom units; discontinuity surface between the units; and a large buried channel
(7 m deep and 390 m wide). Profile is marked as ‘6’ on Figure 4.
Figure 7 – Seismic record of Profile 51 taken in the northern part of the bay. This profile shows Top and Bottom units, a discontinuity surface,
and buried prograding deltaic foresets. Profile is marked as ‘7’ on Figure 4.
i i
“main” — 2017/12/26 — 13:53 — page 571 — #7
i i
BORGES HV & NITTROUER CA
571
Figure 9 – Sedimentary environments identified along the vibracore, X-rays of sections showing laminations, bioturbation, and shell and wood
fragments. Correlation of seismic units and the sedimentary environments is shown on the left side of the vibracore.
Figure 10 – Profile 58 W-E (Location 44) with vibracore showing the two units and sedimentary
environ-ments associated. The core stratigraphy is projected onto the seismic profile. The actual core position is about 2 km from the profile. The location of the core and profile (marked as ‘10’) is shown on Figure 4.
Radiocarbon dating
A wood fragment was collected from vibracore 1 (VC1) at a depth of 317 cm, just below the discontinuity surface (Fig. 9). The sample was dated by AMS radiocarbon analysis at the NOSAMS
Facility (Woods Hole), and indicated an age of 6890± 40 yr. B.P. The age of the sample was placed in a general sea-level curve for the area (Angulo & Lessa, 1997; Fairbanks, 1989) and this date is interpreted to mark the Holocene transgression at this site (Fig. 12).
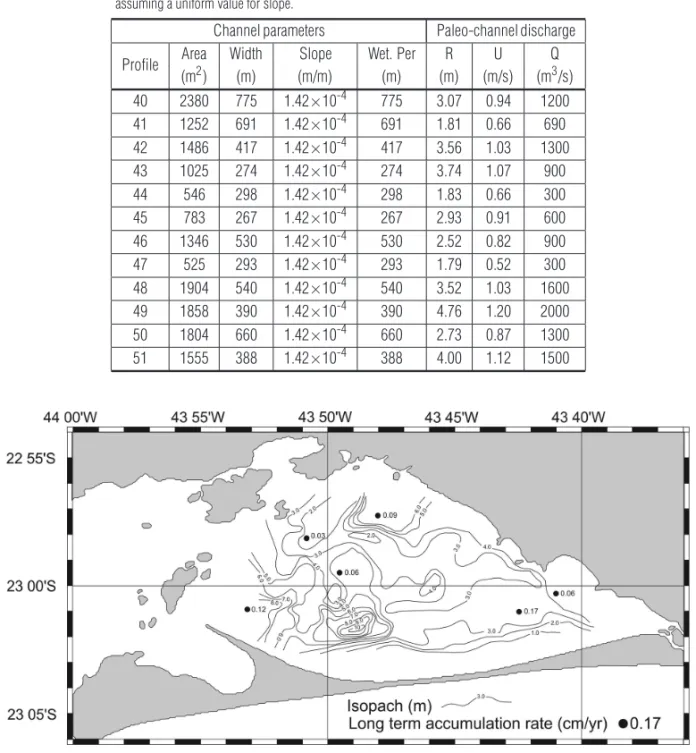
Figure 11 – Bathymetric diagrams of Sepetiba Bay contoured in meters, showing: (a) Holocene topography (top of Top unit); and (b) paleo-topography of Sepetiba
Bay at the end of the Pleistocene (top of Bottom unit) in relation of present sea-level. Top unit thickness in meters and long term sediment accumulation rates in cm/yr.
Paleo-channel
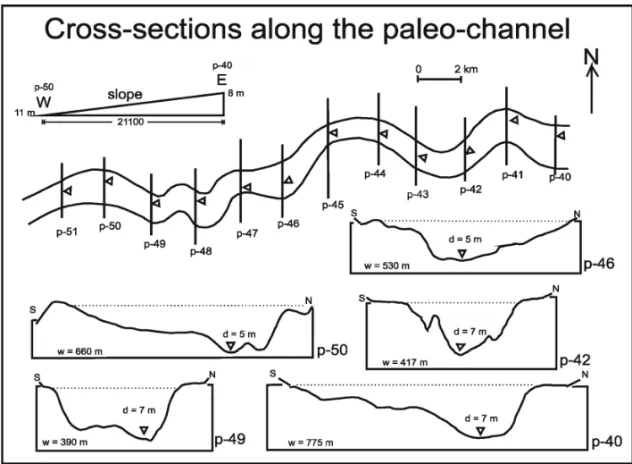
A buried river channel was identified from profiles 40 to 52 (Fig. 4) in an area on the bay side of the modern barrier island. From pro-file 53 west, it is not possible to identify it. This could be because the channel turned and headed seaward east of this line or be-cause the geological record was destroyed, when sea-level was rising, during the Holocene transgression.
It was not possible to correlate this channel with any of the present rivers in Sepetiba Bay although the river most probably entered the region near the Guaratiba region. In order to under-stand the river size, channel cross-sections were drawn from the seismic survey for each profile, and were measured for channel width, depth and slope (Fig. 13). These parameters were used to calculate probable values for mean velocity, hydraulic radius, and water discharge. The discharge allows us to evaluate the approx-imate size of this ancestral river.
Hydrological calculations
a) Manning’s Equation Eq. (1) for broad and shallow channels (Leopold et al., 1992) was used to estimate the likely mean flow velocity of the paleo-channel at bankfull conditions (Table 1).
U = 1.49R2/3ns1/2 (1) were
U = mean flow velocity,
R = hydraulic radius (area/wetted perimeter) s = slope,
n = Manning’s n (0.04 is a reasonable value for a natural chan-nel with rocks, protuberances and irregular alignment).
One value for the river gradient calculation was obtained from buried riverbank depths measured in relation to the present sea-level. Profile 40 (east end of Sepetiba Bay) and Profile 51 (west end of channel) can be compared, as shown on Figure 13, to
i i
“main” — 2017/12/26 — 13:53 — page 573 — #9
i i
BORGES HV & NITTROUER CA
573
Figure 12 – Two sea-level curves were combined, Fairbanks (1989) and Angulo & Lessa (1997), to
recon-struct the local sea-level at Sepetiba Bay for the last 10,000 years. Sea-level rose rapidly from 10,000 to 6,000 when it reached 5 m high. From 5,000 to present sea-level has being dropping slowly to 0 m.
Figure 13 – Seismic profiles crossing the paleo-channel. Lower inserts represent the bottom morphology of the paleo-channel and values of depth and width
obtained from seismic records of profiles 40, 42, 46, 49, and 50. The overall channel slope is also seen. Triangles mark the positions of the channel thalweg.
demonstrate a drop of 3 m over a horizontal distance of 21,100 m. This results in a slope of 1.42× 10⁻⁴. This is characteristic of slopes calculated from other pairs of cross-sections (Figs. 14 and 15). Substituting for n and s in Eq. (1), we get U = 0.4439*R3/2.
b) Water discharge(Q) was estimated by multiplying channel area(A) times calculated mean flow velocity (U) Eq. (2). The
area of the channel correspondent to each profile was calcu-lated plotting cross-sections with a digitizer table and AutoCAD software (Table 1).
Q = AxU (2)
Calculated velocities range from 0.52 to 1.20 m/s and calculated discharges range from 300 to 2000 m3/s (Table 1).
43 1025 274 1.42×10⁻⁴ 274 3.74 1.07 900 44 546 298 1.42×10⁻⁴ 298 1.83 0.66 300 45 783 267 1.42×10⁻⁴ 267 2.93 0.91 600 46 1346 530 1.42×10⁻⁴ 530 2.52 0.82 900 47 525 293 1.42×10⁻⁴ 293 1.79 0.52 300 48 1904 540 1.42×10⁻⁴ 540 3.52 1.03 1600 49 1858 390 1.42×10⁻⁴ 390 4.76 1.20 2000 50 1804 660 1.42×10⁻⁴ 660 2.73 0.87 1300 51 1555 388 1.42×10⁻⁴ 388 4.00 1.12 1500
Figure 14 – Top unit thickness in meters and long term sediment accumulation rates in cm/yr.
DISCUSSION
The two seismic units (Top and Bottom) and the discontinu-ity surface separating them were identified in seismic profiles. These observations revealed the recent geological evolution of Sepetiba Bay. The two units and the discontinuity represent sedi-mentary processes during different sea-level stages. The Top unit, composed largely of fine-grained sediments at VC1, represents a transgressive and a high-stand condition with associated ma-rine sedimentation. The Bottom unit, capped by a medium sand layer at VC1, represents a lower sea-level stage, characterized by terrestrial sedimentation.
Of the four units identified by Figueiredo et al. (1989), only two were similar to the units found in this study. The Top unit is similar to the Verde unit, in sediment composition and spatial distribution. The three other units, Laranja, Roxa and Azul, have sediment composition similar to the presently defined Bottom unit. If they are classified as one unit, it would be correlated to the Bottom unit of the present study.
The age obtained by radiocarbon analysis from a sample collected just below the discontinuity surface, 6890 ± 40 yr. B.P, gives time control of the upper unit. Assuming that this stratigraphic boundary is time-correlative throughout the bay,
i i
“main” — 2017/12/26 — 13:53 — page 575 — #11
i i
BORGES HV & NITTROUER CA
575
Figure 15 – Plot of thalweg and channel bank depths in relation to sea-level versus distance along the
channel. The figure shows the general slope of the area from east to west.
accumulation rate can be determined for sediment above the boundary. The thickness of the layer, determined from high-resolution seismic profiles, divided by its age gives an approx-imate value of accumulation rate. The thickness of the Top unit in Profiles 40, 41, and 42 (Fig. 15) ranges from 3 m to 12 m (maximum values in the thalweg of the buried river channel), with accumulation rates of 0.04 and 0.17 cm/yr.
The discontinuity surface is well represented in all profiles, and delineates the paleo-topography of the bay prior the Holocene transgression. This topography consisted of an incised river val-ley and topographic highs (Fig. 11b), sloping westward as seen in the plot of bank and thalweg depths versus distance along the channel profile (Fig. 14). What is now Sepetiba Bay was a plain that had high bedrock protrusions; some of them presently islands (Fig. 16).
A similar geological setting, presenting essentially the same topographic characteristics as Sepetiba Bay did in the late Pleis-tocene, is found today in Barra da Tijuca and Recreio dos Ban-deirantes, a large coastal plain located in an area east of Sepetiba and west of Rio de Janeiro City (Fig. 1).
The late Pleistocene setting of Sepetiba Bay started to change at 7,800 years B.P. when sea-level reached the –16 m, the en-trance of the present bay (Fig. 12). Based on its subbottom depth, the paleo-delta located near the modern Guand´u river month was deposited from 7,000 to 7,700 years B.P., changing its location eastward with the continuing rising of sea-level. At 6,500 years B.B. sea-level was at –12 m high, drowning the bottom of river channel at the east and of the bay. By 6,400 years B.P. the river channel was completely filed with sediments (from west to east). The present sea-level high was reached at 6,000 years B.P. when the whole bay was drowned, reaching its maximum high of +5 m until 5,000 years. A series of beach ridges 5-7 m high, found at
Sepetiba coastal plain, are evidence of the maximum sea-level high in the Holocene transgression of Sepetiba Bay (Maio, 1985; Pereira et al., 2012). From 5,000 years B.P. to present sea-level has been slowly dropping to its present high.
The topographic high, where Marambaia Barrier Island is now located, certainly was an obstacle to the river channel that flowed westward, parallel to it. Seismic data show that Marambaia bar-rier island probably existed as a terrestrial feature by the end of the Pleistocene because fine-grained sediment deposits on the flank of the ridge. The feature was probably created as a spit dur-ing an earlier high stand of sea-level. The old spit may have been shorter than the modern barrier island. This fact could explain the difference in sedimentary environments in the east and west sections of Marambaia Barrier Island today. The apparently older east section is composed of a large dune field (30-m high) stabi-lized by well-developed vegetation and a mangrove fringe on the bay side of the barrier island. The younger west end of the barrier island is composed of a series of beach ridges 1-m high, forming Pombeba spit, which was formed when Sepetiba Bay reached its modern configuration following the last sea-level rise (Lamego, 1945; Roncarati & Barrocas, 1978; Ponc¸ano et al., 1979; Borges, 1990).
Progradation of the spit by alongshore currents is a likely mechanism for the complete extended of this spit to Marambaia Island (Fig. 2). This hypothesis needs to be tested with further seismic interpretations in a survey offshore of Sepetiba Bay.
The Top unit was deposited during rising sea-level associated with the Holocene Transgression. It is a marine deposit composed of mud and sandy mud with tidal-channel and deltaic sedimtary environments. The tidal-channel deposit is located at the en-trance of a modern channel near Barra de Guaratiba, therefore, it must have been open. The paleo-delta in the northern part of the
Figure 16 – Interpretation of Sepetiba Bay at two different sea-level stages. A) Lowstand sea-level in the late Pleistocene. The
paleo-topography of the Sepetiba Bay area consisted of a plain with high mounds and a topographic high in the southern part of the plain. A sinuous river channel ran parallel to the topographic high at that time, perhaps exiting east Marambaia peak. B) Highstand sea-level. Sepetiba Bay in its present configuration with islands, Guand´u deltaic lobe, and a barrier island enclosing the bay.
bay may represent a modern subaqueous delta of Guand´u River, deposited during the rising sea-level and abandoned before the maximum of the Holocene transgression.
Hydrological calculations for bankfull discharge of the paleo-channel showed values of 300-1700 m3/s. Because we do not know the environmental characteristics surrounding Sepetiba Bay, during the Pleistocene, the bankfull condition for calculations
is used to approximate the maximum value of river discharge. The highest flood discharges documented for the Guand´u River, the largest river in the area, were 190 m3/s in the 1940s (Goes, 1942; Barcellos et al., 1997) to 288 m3/s during the last 20 years (oral communication, Superintendˆencia Estadual de Rios e Lagoas – SERLA, 1997). The bankfull discharge obtained for the paleo-river is equivalent to or larger than the modern values
i i
“main” — 2017/12/26 — 13:53 — page 577 — #13
i i
BORGES HV & NITTROUER CA
577
of Guand´u River. This suggests that the paleo-channel, which ranthrough what is now Sepetiba Bay, was formed by a river similar the modern Guand´u River.
CONCLUSIONS
The geological evolution described by the interpretation of the seismic profiles, hydrological calculations of a paleo-channel, and radiocarbon data, reveal a partial history of Sepetiba Bay during the last 7,000 years.
Interpretations of seismic profiles allowed recognition of two major units, Top and Bottom units. These units are separated by a discontinuity surface well represented in all profiles collected from Sepetiba Bay. The Top unit was deposited during a rising and highstand of sea-level, filling depressions and river channels with local deltas. The average accumulation rate for Sepetiba Bay during the late Holocene was approximately 0.17 cm/yr. The Bot-tom unit, a sandy layer, corresponds to a lowstand of sea-level and was deposited in a terrestrial environment.
The paleo-topography of the Sepetiba Bay area in the late Pleistocene consisted of a plain with high mounds, a topographic high south of the plain, and a sinuous river channel that trended parallel to the topographic high at that time, perhaps turning sea-ward at a location east of Marambaia peak (Fig. 16). The hydrolog-ical calculations for this paleo-channel show that it was equivalent to or possibly larger than the rivers entering the modern Sepetiba Bay. Based on its location and general slope, the paleo-channel could have flowed through the general vicinity of the Pirac˜ao River (Fig. 2), a stream that occurs in Barra de Guaratiba, east end of Sepetiba Bay.
ACKNOWLEDGEMENTS
Financial support for this study was funded by the Brazilian Research Council, Conselho Nacional de Desenvolvimento Ci-ent´ıfico e Tecnol´ogico (CNPq) (Proc. 200473/93-0). Field work was conducted with cooperation from the Environmental Agency of the State of Rio de Janeiro, Fundac¸˜ao Estadual de Engenharia do Meio Ambiente (FEEMA) and the German Agency, Deutsche Gesellschaft f¨ur Technishe Zusammenarbeit (GTZ). Observat´orio Nacional/CNPq provided equipment for the field work in Barra de Guaratiba tidal flat. Thanks are given to Dr. Horst G. Pasenau from GTZ for the geophysical data and his interest in this project. Special thanks are given to Prof. Helio Heringer Villena, and stu-dents Gelcilio C. Barros Filho and Andrei Sales de Barros Ca-valcanti of the Oceanography Department of Universidade do Es-tado do Rio de Janeiro (UERJ) for assistance during the field-sampling program.
REFERENCES
ANGULO RJ & LESSA GC. 1997. The Brazilian sea-level curves: a criti-cal review with emphasis on the curves from the Paranagu´aand Canan´eia regions. Mar. Geol., 140: 141–166.
BARCELLOS C, LACERDA LD & CERADINNI S. 1997. Sediment origin and budget in Sepetiba Bay (Brazil) – an approach based on multiele-mental analysis. Environmultiele-mental Geology, 32(3): 203–209.
BARNHARDT WA, BELKNAP DF & KELLEY JT. 1997. Stratigraphic evolution of the inner continental shelf in response to the late Quater-nary relative sea-level change, northeastern Gulf of Maine. Geol. Soc. Am. Bull., 109: 612–630.
BORGES HV. 1990. Dinˆamica Sedimentar da Restinga da Marambaia e Ba´ıa de Sepetiba. Master Dissertation, Universidade Federal do Rio de Janeiro, Brazil, 82 pp.
BR ¨ONNIMANN P, MOURA JA & DIAS-BRITO D. 1981. Estudos Eco-l´ogicos na Ba´ıa de Sepetiba, Rio de Janeiro, Brasil: Foramin´ıferos. In: Congresso Latino-Americano de Paleontologia, Porto Alegre, RS, Brazil. p. 75–861.
COAKLEY JP & SYVITSKI JPM. 1991. SediGraph technique. In: SYVIT-SKI JPM (Ed.). Principles, Methods, and Application of Particle Size Analysis. Cambridge University Press, 368 pp.
DIAZ JI, NELSON CH, BARBER Jr. JH & GIRO S. 1990. Late Pleis-tocene and Holocene sedimentary facies on the Ebro continental shelf. In: NELSON CH & MALDONADO A (Eds.). The Ebro Margin. Mar. Geol., 95: 333–352.
DHN – Diretoria de Hidrografia e Navegac¸˜ao. 1986. T´abuas das Mar´es para o ano de 1990 – Costa do Brasil e Portos Estrangeiros. DHN, Marinha do Brasil, 255 pp.
FAIRBANKS RG. 1989. A 17,000-year glacio-eustatic sea level record: influence of glacial melting rates on the Younger Dryas event and deep-ocean circulation. Nature, 342: 637–642.
FARR´AN M & MALDONADO A. 1990. The Ebro continental shelf: Quater-nary seismic stratigraphy and growth patterns. In: NELSON CH & MAL-DONADO A (Eds.). The Ebro Margin. Mar. Geol., 95: 289–312. FIGUEIREDO AG, IVO FC, GUIRO PP, GALEA CG, BORGES HV & DUQUE H. 1989. Estratigrafia Rasa, Ba´ıa de Sepetiba – RJ. In: Congresso da Sociedade Brasileira de Geof´ısica, 1., Rio de Janeiro, Brazil, SBGf, pp. 786–791.
GENSOUS B, WILLIAMSON D & TESSON M. 1993. Late-Quaternary transgressive and highstand deposits of a deltaic shelf (Rhˆone delta, France). In: POSAMENTIER HW, SUMMERHAYESCP, HAQ BU & ALLEN GP (Eds.). Sequence Stratigraphy and Facies Associations. Intl. Assoc. Sedimentol., Spec. Pub., No. 18, pp. 197–211.
GOES HA. 1942. A Baixada de Sepetiba. Imprensa Nacional, Rio de Janeiro, Brazil, 378 pp.
HART BS, HAMILTON TS & BARRIE JV. 1995. Seismic stratigraphy and sedimentary framework of a deep-water Holocene delta: The Fraser delta,
proach to portable vibracoring underwater and on land. J. Sediment. Petrol., 48: 654–657.
LEOPOLD LB, WOLMAN MG & MILLER JP. 1992. Fluvial Processes in Geomorphology. Dover, New York, 522 pp.
MAIO CR. 1985. Sepetiba – Contribuic¸˜ao ao estudo dos n´ıveis de ero-s˜ao do Brasil. Revista Brasileira Geogr´afica, 20(2): 315–323. MOURA JA, DIAS-BRITO D & BR ¨ONNIMANN P. 1982. Modelo ambi-ental de laguna costeira cl´astica – Ba´ıa de Sepetiba, RJ. In: Atas do Simp´osio do Quatern´ario no Brasil, pp. 135–152.
OKAMURA Y & BLUM P. 1993. Seismic stratigraphy of Quaternary stacked progradational sequences in the southwest of Japan forearc: an example of fourth-order sequences in active margin. In: POSAMEN-TIER HW, SUMMERHAYES CP, HAQ BU & ALLEN GP (Eds.). Sequence Stratigraphy and Facies Associations. Intl. Assoc. Sedimentol., Spec. Pub., No. 18, pp. 213–232.
PEREIRA E, BRAGA PMC, MENDES CT & BERGAMASHI S. 2012. Sedimentac¸˜ao Quatern´aria na Plan´ıcie Costeira de Jacarepagu´a e Gua-ratiba (Estado do Rio de Janeiro). In: RODRIGUES MAC, PEREIRA S & SANTOS SB (Eds.). Ba´ıa de Sepetiba: estado da arte. Cap´ıtulo I. Rio de Janeiro, Brazil: Cordob˜a, p. 63–82.
PONC¸ANO WL, F ´ULFARO VJ & GIMENEZ AF. 1979. Sobre a origem da Restinga da Marambaia, RJ. In: Simp´osio Regional de Geologia, 2., Rio Claro. Atas. Rio Claro, S˜ao Paulo, Brazil, v. 1: 291–304.
POSAMENTIER HW & VAIL PR. 1988. Eustatic controls on clastic de-position I – conceptual framework. In: WILGUS CK, HASTINGS BS,
design, and calibration of settling tubes. In: SYVITSKI JPM (Ed.). Prin-ciples, Methods, and Application of Particle Size Analysis. Cambridge University Press, 368 pp.
TESSON M, ALLEN GP, RAVENNE C. 1993. Late Pleistocene shelf-perched lowstand wedges on the Rhˆone continental shelf. In: POSAMEN-TIER HW, SUMMERHAYES CP, HAQ BU & ALLEN GP (Eds.). Sequence Stratigraphy and Facies Associations. Intl. Assoc. Sedimentol., Spec. Pub., No. 18, pp. 183–196.
U.S. Navy Marine Climatic Atlas of the World. 1992. United States Naval Oceanography Command Detachment, Asheville, NC, Vol. IV – South Atlantic. NAVAIR 50-1C-531.
VILLENA HH. 2003. Ba´ıa de Sepetiba: Considerac¸˜oes Geol´ogicas e Oceanogr´aficas com Base em Dados Batim´etrico e Sedimentol´ogicos. In: Congresso Brasileiro da Associac¸˜ao de Estudos do Quatern´ario, 9., Pro-ceedings... M´ıdia Digital, (CD-ROM), p. 20–29.
VILLENA HH. 2007. Evoluc¸˜ao sedimentar do cone de deposic¸˜ao do Rio Guandu, Ba´ıa de Sepetiba – RJ. Ph.D. Thesis. Universidade do Estado do Rio de Janeiro, Faculdadede Geologia, Rio de Janeiro, Brazil, 175 pp. ZEMBRUSCKI SG. 1979. Geomorfologia da Margem Continental Leste Brasileira e da Bacia Oceˆanica Adjacente. In: CHAVES HAF (Ed.). Geo-morfologia da Margem Continental Brasileira e das ´Areas Oceˆanicas Adjacentes. PETROBRAS, CENPES, DITEP. S´erie Projeto Remac, 7: 129–177.
Recebido em 15 abril, 2015 / Aceito em 26 fevereiro, 2016 Received on April 15, 2015 / Accepted on February 26, 2016
NOTES ABOUT THE AUTHORS
Heloisa Vargas Borges is a Geologist, M.Sc. in Geosciences at UFRJ and Ph.D. in Coastal Oceanography at SUNY, Stony Brook – USA. Visiting Researcher at
Postgraduate Geology and Geophysics, Institute of Geosciences, UFF. Worked in marine environmental monitoring, exploration, seismic, production permits for oil and natural gas industry at IBAMA, as well as coordination and project management for R&D, development of technology network, including infrastructure and training of human resources in research institutions and Brazilian universities in the areas of marine environmental monitoring and conservation and restoration of ecosystems and impacted areas at Petrobras Research Center. Implementation of Technological Institutes dedicated to Sustainable Development, Mining, and Energy at Vale Tech-nological Institute.
Charles A. Nittrouer is a Professor in Earth & Space Sciences and in the School of Oceanography, and has made a career studying places where terrestrial sediment
sources enter the ocean. These have included some of the biggest rivers (e.g., Amazon, Yangtze, Fly) and smaller systems (e.g., Po, Rhone, Sepik, Columbia, Eel, Copper), as well as tidewater glaciers entering southern and northern hemisphere oceans (e.g., Antarctica, Patagonia, Alaska).