Henrique Kosby Corrêa
Doctor in Environmental Quality at Feevale University – Novo Hamburgo (RS), Brazil.
Roberta Plangg Riegel
Doctor in Environmental Quality at Feevale University – Novo Hamburgo (RS), Brazil.
Darlan Daniel Alves
Doctor in Environmental Quality at Feevale University – Novo Hamburgo (RS), Brazil.
Daniela Montanari
Migliavacca Osório
Professor at Feevale University – Novo Hamburgo (RS), Brazil.
Gustavo Marques da Costa
Doctor in Environmental Quality at Feevale University – Novo Hamburgo (RS), Brazil.
Chaudhery
Mustansar Hussain
Professor at the Institute of Technology – New Jersey, United States.
Daniela Müller de Quevedo
Professor at Feevale University – Novo Hamburgo (RS), Brazil. Correspondence address: Gustavo Marques da Costa – Programa de Pós-graduação em Qualidade Ambiental, Universidade Feevale – Câmpus II, ERS-239, 2.755 – CEP: 93525-075 –
Novo Hamburgo (RS), Brazil – E-mail: [email protected] Received on: 01/11/2019
Accepted on: 07/23/2019
ABSTRACT
This study aimed to apply a methodology for evaluating raw water quality and its relationship with land uses and occupations through multivariate statistical analysis and Geographic Information System. Hydrogenic potential, water temperature, dissolved oxygen, biochemical oxygen demand, chemical oxygen demand, total nitrogen, total phosphorus, and E. coli were monitored from August 2012 until March 2013. The geoprocessing tool enabled delimiting the contribution areas of each sampling site, as well as the individual identification of land use of each area. Principal Component Analysis resulted in: domestic sewage, domestic sewage/agriculture, and industrial discharge. Significant correlations were identified between the variable urban area and hydrogenionic potential (ρ = 0.446; p = 0.049), dissolved oxygen (ρ = -0.625; p = 0.003), total nitrogen (ρ = 0.649; p = 0.002), and E. coli (ρ = 0.932; p < 0.001). The methodology enabled to identify the contribution of land use factors as to water quality.
Keywords: principal component analysis; Spearman’s rank correlation coefficient; water pollution; land use.
RESUMO
Este estudo teve como objetivo aplicar uma metodologia que avalie a qualidade da água bruta e sua relação com usos e ocupações do solo por meio de análise estatística multivariada e do Sistema de Informações Geográficas. Potencial de hidrogênio, temperatura da água, oxigênio dissolvido, demanda bioquímica de oxigênio, demanda química de oxigênio, nitrogênio total, fósforo total e
E. coli foram monitorados de agosto de 2012 a março de 2013. A ferramenta
de geoprocessamento permitiu a delimitação das áreas de contribuição de cada local de amostragem, bem como a identificação individual do uso do solo de cada área. A Análise de Componentes Principais (ACP) resultou em: esgoto doméstico, esgoto doméstico/agricultura e descarga industrial. Correlações significativas foram identificadas entre as variáveis ‘área urbana’ e ‘potencial hidrogeniônico’ (ρ = 0,446; p = 0,049), oxigênio dissolvido (ρ = -0,625; p = 0,003), nitrogênio total (ρ = 0,649; p = 0,002) e E. coli (ρ = 0,932; p < 0,001). A metodologia estabelecida possibilitou identificar a contribuição dos fatores de uso do solo em relação à qualidade da água.
Palavras-chave: análise de componentes principais; correlação de Spearman; poluição da água; uso do solo.
INFORMATION SYSTEMS IN RAW WATER QUALITY ASSESSMENT
ANÁLISE ESTATÍSTICA MULTIVARIADA E USO DE SISTEMAS DEINTRODUCTION
Environmental conditions, especially within hydro-graphic basins, can be assessed employing records of events on the earth surface, using geotechnology tools capable of providing information of the local geography and, together with management processes of urban occupation, bring a new meaning to urban planning. Thus, it is possible to systematically analyze human-en-vironment interaction processes, even if a landscape partition is used as the analysis unit. Hence, geotech-nologies related to remote sensing and geographic in-formation systems (GIS) are increasingly interconnect-ed, considering their applications in different fields of knowledge (FLORENZANO, 2005). Robust data sets, based on technological contributions, allow for the inference on environmental issues, as well as the pro-duction of good quality cartographic material, such as land use maps, occupation and land parceling, defor-estation, agricultural activities, silting and pollution of water bodies and soil erosion losses, which can be the decision-making basis in environmental management processes (PORTO & HARTWIG, 2016).
Adding statistics to this scenario, it is of great value to an-alyze data, to relate them and, if possible, to group them, allowing a more cohesive and punctual interpretation of factors. A comprehensive water quality-monitoring pro-gram encompasses spatial and temporal assessment of many relevant variables, generating a complex and, in most cases, difficult to interpret data matrix. Thus, the application of different multivariate statistical tech-niques, such as Principal Component Analysis (PCA), can facilitate the interpretation of complex data and enable the identification of possible factors that are unfavorably influencing water systems (SINGH; MALIK; SINHA, 2005; PAZ; FREITAS; NICOLA, 2006; DINIZ; SOARES; CABRAL, 2012; FIGUEIREDO FILHO; SILVA JÚNIOR; ROCHA, 2012; SHEELA et al., 2012; RUŽDJAK & RUŽDJAK, 2015). Hence, GIS have been increasingly used in integrated environ-mental assessments (LIU & DE SMEDT, 2005; CARDOSO
et al., 2015, ELLIOTT et al., 2016).
Use of visualization and mapping tools within the GIS platform enables the extraction of georeferenced in-formation from the crossing and analysis of various thematic maps, which provide information on various components of the environment, such as soil type, geol-ogy, geomorpholgeol-ogy, land use, vegetal cover or declivity. Using these tools allows the relationships between
quan-titative and qualitative variables of the environment to be known, which may help in the identification of risk areas and elaboration of zoning plans (FLORENZANO, 2005; CARDOSO et al., 2015; ELLIOTT et al., 2016). Water quality has become an environmental issue of primary concern, mainly due to the vulnerability and increasing pollution of water resources, caused by fac-tors such as rapid and disorderly urban and industrial growth, which end up compromising the restoration capacity of water bodies. The negative impacts caused by pollution promote an imbalance of natural flows and cycles and cause a series of significant environmental impacts. In this perspective, studies focused on the analysis of spatial and temporal transformations occur-ring on the elements and attributes of the environmen-tal system may show many anthropogenic mechanisms capable of causing negative impacts, being able to be used in the planning and conservation of these areas (CHEN et al., 2016; SIMON; TRENTIN, 2009).
In general, studies that establish water quality pro-files related to anthropogenic factors evaluate these relationships considering only a qualitative approach. These studies use data from GIS without establish-ing a statistical relationship with water quality data. However, one can also observe researches that deal with the importance of discussing statistics with other study factors using quantitative methods. Farhan et al. (2017), for instance, used GIS and PCA to assess basins in an integrated manner, determining their prioritiza-tion; Alvarado et al. (2016), whose research presents the use of multi-criteria decision analysis (MCDA), with an integrated discussion of factors, as a decision tool to facilitate the prioritization process of consum-er wells that would need more protection before the risk of contamination. Also doing a connected discus-sion of assessments, Rahman et al. (2016) conducted a study that aimed to determine and evaluate spatial and temporal changes in groundwater using GIS, lin-ear regression, Mann-Kendall Trend Test, and Sen’s slope estimator. Regarding water quality, Bhutiani
et al. (2015) evaluated the environmental impact of
sociocultural practices on the water quality of Ganga River, in India. In this study, the physical-chemical pa-rameters that contributed to the temporal variation and pollution in the river were identified, and the PCA and CA were used to identify anthropogenic factors
(industrial, urban, sewage, agriculture, land use, and mining activities) and natural factors (soil erosion, in-clement weather).
Hence, the development and application of methodol-ogies capable of integrating data from different areas of knowledge are of great value. This study aimed to apply a methodology to evaluate the raw water quality and its relationship with land uses and occupations
(ur-ban use) through multivariate statistical analysis (PCA) and GIS. Thus, the micro basin of Santa Bárbara stream (MSBS) was taken as a case study, due to its importance for the Southern of Brazil, in the state of Rio Grande do Sul, especially in the municipality of Pelotas. Santa Bárbara Dam represents the main source of drinking water in the municipality and is currently characterized by being an area of urban-industrial expansion.
METHODOLOGY
Multivariate statistical analyses
For an integrated analysis, the statistical techniques of PCA were useful. In order to determine if the wa-ter quality data presented normal distribution, Kolm-ogorov-Smirnov normality test should be applied. As the data set presented non-normal distribution by the Kolmogorov-Smirnov normality test (p < 0.05), the Kruskal-Wallis non-parametric test (p < 0.05) was used to determine the differences in the concentrations of
parameters between SS, followed by the post-hoc Stu-dent-Newman-Keuls. Kolmogorov-Smirnov test was performed using the IBM SPSS Statistics 24 software, while Kruskal-Wallis and Student-Newman-Keuls tests used the BioEstat 5.0 software.
Finally, Spearman’s correlation analysis was used to identify significant correlations (p < 0.05) between land use (urbanization) and water quality parameters.
Geoprocessing techniques
Variable land use classification may be elaborated from the photographic interpretation of satellite images. The interpretation of photos is a technique that con-sists of extracting the photograph qualitative informa-tion by means of visual interpretainforma-tion. Imaging classifi-cation methods can be divided initially into two types:
automatic and manual. Automatic classifications are based on the extrapolation of calibrated samples using the GIS software. In this study, the use of soil and land cover changes in the soil and land cover systems was carried out in the same manner as in previous studies (ZHANG et al., 2014).
CASE STUDY: MSBS
Study area description
Pelotas is a Brazilian city located in the south of Rio Grande do Sul State, with a total area of around 1,610 km², which is home to the third largest population of the state, esti-mated at 342,873 inhabitants (IBGE, 2016). The munici-pal drinking water is supplied by the Serviço Autônomo de Saneamento de Pelotas (SANEP, acronym in Portu-guese), which, in 1968, when damming the Santa Bárbara stream, built Santa Bárbara Dam, whose 352 ha flood has an estimated volume of 10 billion liters of water. The dam provides raw water to Santa Bárbara Water Treatment Station (WTS), whose total capacity is 40 million liters of water per day, supplying eight districts, which corre-sponds to 80% of the city urban area (SANEP, 2016).
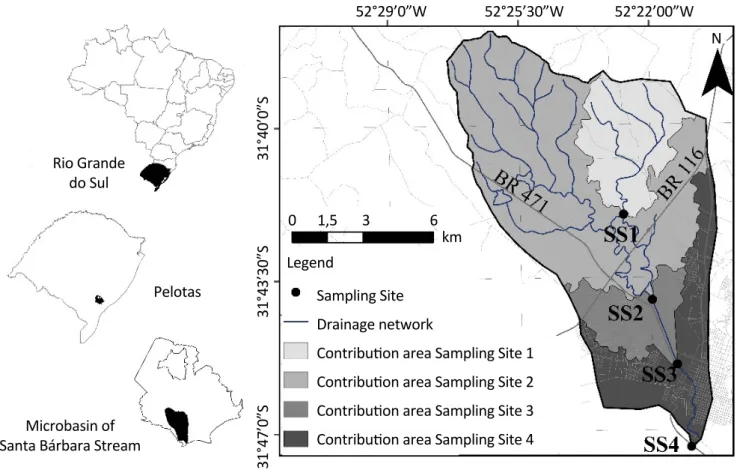
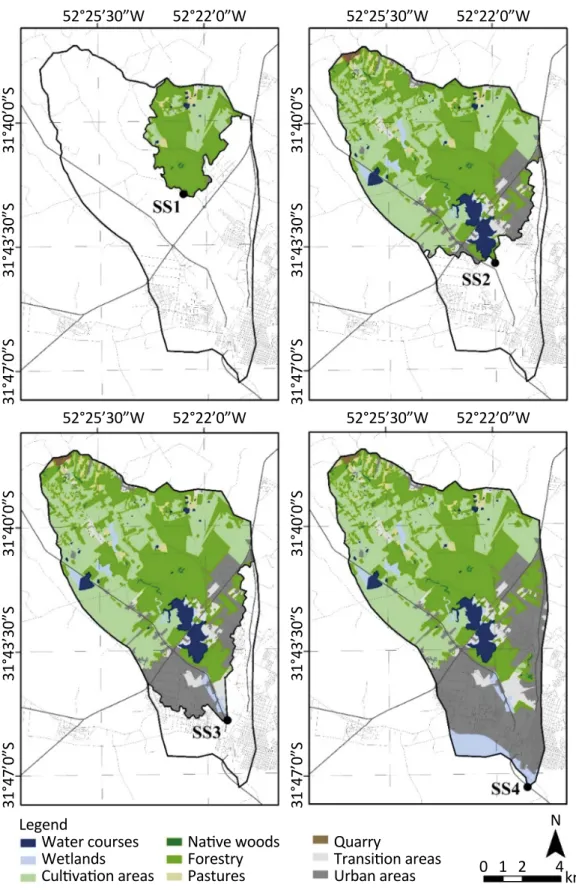
Pelotas has 67% of their houses served by sewage collec-tion networks and two Sewage Treatment Stacollec-tions (STS), which together treat 40% of the sewage collected from the urban area. The urban drainage system is composed of pump houses and collector and conductor channels, and Santa Bárbara Stream is one of the main drains, where the effluents from the industrial district (SANEP, 2016) are launched The MSBS is located in the southern portion of the municipality of Pelotas, Rio Grande do Sul, Brazil, at the intersection of BR 471 and BR 116 highways (Figure 1). The sampling sites (SS) 1, 2, 3, and 4 are located in four areas of the MSBS. In addition, SS2, SS3 and SS4 are in the Santa Bárbara stream.
SS1 (29º38’28.54”S and 51º06’38.9” W) is the least ur-banized site, located in Passo do Cunha Stream, which is one of the MSBS tributaries. Its spring is in the North of the dam and receives effluents, predominantly agri-cultural, originated from dairy farming, fruit growing, poultry farming, and afforestation. This site presents a depth of 40 cm and margins with arboreal vegetation and without the presence of solid urban and industrial residues. The water has a clean and clear color, with no unpleasant odors. The sediment presents a light red color, also without unpleasant odor. SS2 (29º38’55.22”S and 51º10’13.41” W) is the closest site to the source of Santa Bárbara stream, with a depth of 20 cm and without riparian vegetation. No solid urban and indus-trial waste was identified in it, and its water is muddy, clear, with no unpleasant odors and there is a clear col-oration sediment, which also does not have unpleas-ant odors. This site presents agricultural and pastoral activity, distributed into small farms. SS3 (29º39’31.8”S and 51º6’31.52”W) is in an urbanized area and has an average depth of 150 cm. Its waterway is bordered on
the right by an avenue that connects BR 116 road to the center of Pelotas, where upstream on the right is the industrial district, a stabilization pond and, on the left, an irregular deposition of solid waste, already de-activated. Near the sampling site, there are about 20 low-income irregular households, and the channel re-ceives, in this area, without treatment, domestic and industrial effluents, from activities such as rice pro-cessing, mechanical maintenance of vehicles, small candy industries, and agricultural trade, among others. As there is no minimum flow, this point receives only pollutants, presenting a very silted channel. The water color varies from dark green to black, being complete-ly muddy, fetid, and viscous. SS4 (29º42’22.62”S and 51º05’17.93”W) is located near the river mouth and characterized by a significant amount of effluent dis-charge and degraded riparian vegetation. This site is near the margins of BR 392 that connects Pelotas to the port of Rio Grande. At this site, there is heavy traffic of trucks, and it still receives contributions from the ac-tivity of rice planting (SIMON; TRENTIN; CUNHA, 2010).
Microbasin of Santa Bárbara Stream
Legend
Sampling Site Drainage network
Contribution area Sampling Site 1 Contribution area Sampling Site 2 Contribution area Sampling Site 3 Contribution area Sampling Site 4 Pelotas 0 1,5 3 6 52°29’0”W 31°40’ 0”S 31°43’ 30”S 31°47’ 0”S 52°25’30”W N 52°22’00”W km Rio Grande do Sul
Water sample collection
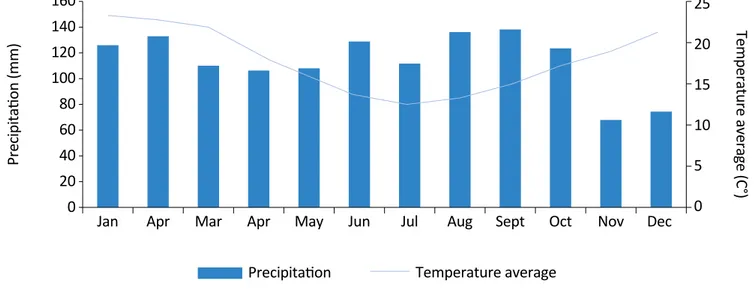
Water samples were collected monthly (August 2012 to March 2013), in periods without precipitation, to avoid the influence of this variable in the data analysis. The collection period includes all seasons of the year, periods of highest and lowest rainfall in the basin and all temperature ranges observed over a year, according to Figure 2 (INMET, 2017). Water quality parameters like hydrogenionic potential (pH), water temperature (WT), dissolved oxygen (DO), biochemical oxygen demand (BOD), chemical oxygen demand (COD), total nitrogen (TN), total phosphorus (TP), and Escherichia coli (E. coli) were analyzed. Parameters pH and WT were determined at the time of collection, using a portable pH meter (HI 99163, HANNA) and a mercury thermometer (Incoterm, Porto Alegre/RS, Brasil). Samples for DO determination were conditioned in borosilicate glass flasks with ground lid, and water seal and samples destined to the determination of other parameters were conditioned in chemically inert
poly-ethylene bottles with self-capping lids. Both containers were refrigerated between 1 and 4ºC and immediately sent to the Laboratory of Environmental Chemistry of Universidade Católica de Pelotas (UCPel) for analysis. DO, BOD, COD, TN, TP and E. coli were analyzed using the methodologies of Standard Methods for Water and Waste-water Examination (APHA, 2005). The OD was determined by the Winkler method modified through sodium azide (method 4500-O C), whereas the BOD was found by the incubation method at 20ºC for five days (method 5210 B); COD was determined through the open-reflux method using potassium dichromate as oxidant agent (method 520 B); TN was determined by the macro-Kjeldahl method (Standard 4500-NorgB method), using a nitrogen distiller (TE-0364; TECNAL); TP was found by the spectrophoto-metric method, using a spectrophotometer (B582, Mi-cronal, S.A) and molybdenum phosphoric acid (4500 P-C method); E. coli was determined by the card chromogenic substrate method (Colilert, Idexx Laboratories Inc., USA
Elaboration of micro basin of Santa Barbara stream land use map
Variable land classification use was elaborated from photo interpretation of a satellite image extracted from Google Earth Pro, in the locality of MSBS, with a spatial resolution of 6 m (March 11th, 2016 and Da-tum WGS 84). In the ArcGIS software, the image was
georeferenced from known points and, then, demar-cated with the basin boundary, using the clip tool for the procedure. The layers for digitizing the land use spots were created manually, with the aim of reducing spectral confusion between some classes and granular
Temperature average Te mpe rature ave rage (C°) Precipitation (mm)
Jan Apr Mar Apr May Jun Jul Aug Sept Oct Nov Dec
160 140 120 100 80 60 40 20 0 25 20 15 10 5 0 Precipitation
appearance. The land use map in the MSBS was
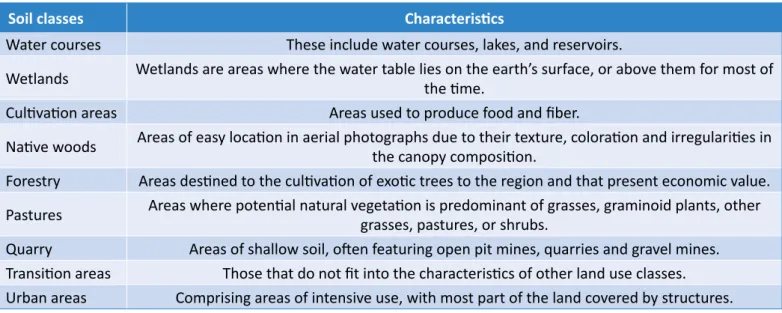
elabo-rated according to the classification proposed by Simon and Trentin (2009), which lists eight land use classes, according to Chart 1.
RESULTS AND DISCUSSION
Descriptive statistics
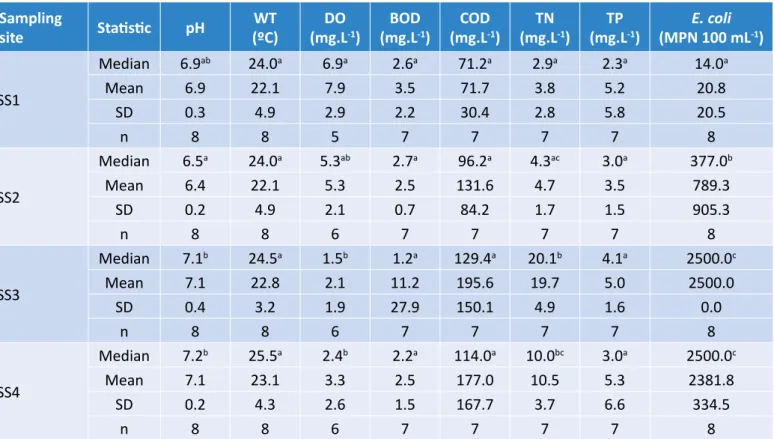
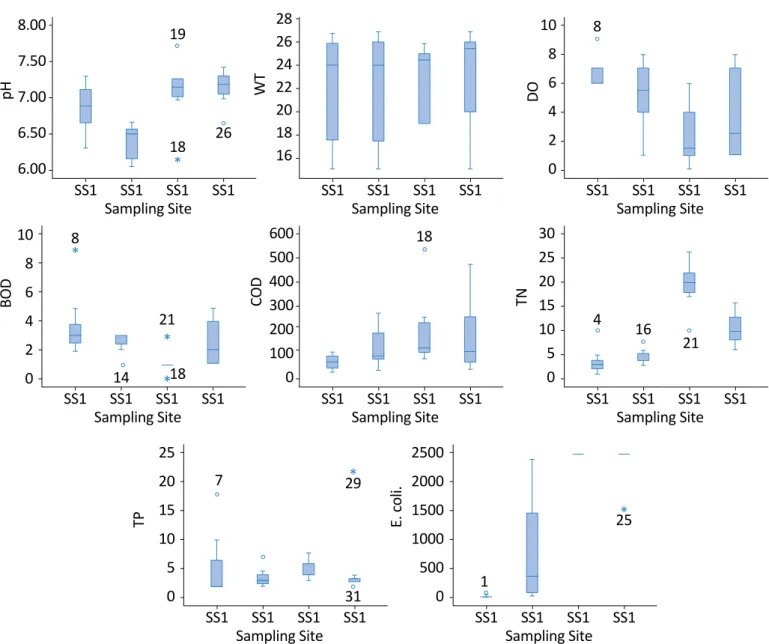
Table 1 shows the results of statistical tests, as well as the descriptive statistics regarding water quality pa-rameters monitored at the four points of water collec-tion in the MSBS.
According to Table 1, significant differences were iden-tified between the sampling sites in pH, DO, TN and
E. coli. It, therefore, indicates that, among the
parame-ters monitored in the study period, these are the ones that present greater influence regarding differences in the quality of water between sampling points. In SS3 and SS4, the E. coli parameter extrapolated the max-imum detection limit of the method. Figure 3 shows the graphs in the box-plot format of the analyzed pa-rameters, in which differences/similarities between sampling sites can be seen more clearly.
The DO, BOD and TP were compared with CONAMA Resolution 357/2005, of the Conselho Nacional do
Meio Ambiente (CONAMA, acronym in Portuguese) (BRASIL, 2005). DO in SS3 and SS4 presented mean and median values of less than 4 mg L-1 and, therefore, can be classified as class IV (the worst class established by CONAMA Resolution 357/2005), with water uses only for landscape harmony and navigation. For TP, the av-erage values found in the four sampling sites exceeded by more than 40 times the maximum value established by class III, which is 0.15 mg L-1 for lotic environments, so the four points studied can be framed as class IV. The contrast between DO and TN concentrations in SS3 are quite visible, which may be associated with the contri-bution of high organic loads at this site, possibly from do-mestic sewage and/or nitrogen fertilizer leaching, which contribute to the depletion of DO (ALVES et al., 2018). Another fact that corroborates this hypothesis is the high concentrations of E. coli, which present a significant in-crease in SS2 and reach even higher values in SS3 and SS4.
Principal component analysis
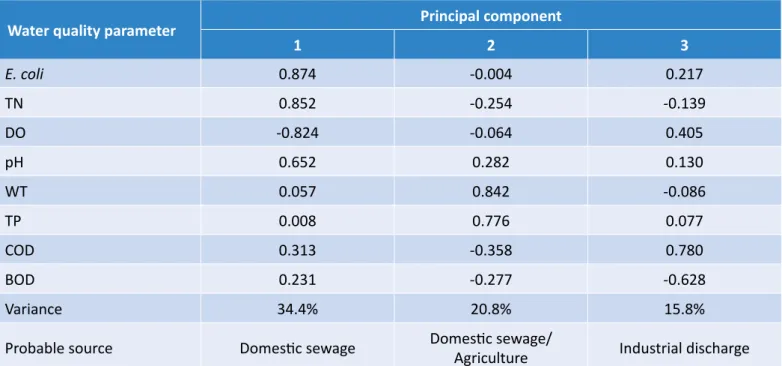
The PCA was applied to the data set in order to identify
the main factors responsible for variations in MSBS wa- ter quality. The KMO test value was 0.53, which is high-er than the acceptable critical threshold (HAIR et al.,
Chart 1 – Classification of use and soil occupation in the micro basin of Santa Barbara stream (MSBS).
Soil classes Characteristics
Water courses These include water courses, lakes, and reservoirs.
Wetlands Wetlands are areas where the water table lies on the earth’s surface, or above them for most of the time.
Cultivation areas Areas used to produce food and fiber.
Native woods Areas of easy location in aerial photographs due to their texture, coloration and irregularities in the canopy composition. Forestry Areas destined to the cultivation of exotic trees to the region and that present economic value. Pastures Areas where potential natural vegetation is predominant of grasses, graminoid plants, other grasses, pastures, or shrubs. Quarry Areas of shallow soil, often featuring open pit mines, quarries and gravel mines. Transition areas Those that do not fit into the characteristics of other land use classes. Urban areas Comprising areas of intensive use, with most part of the land covered by structures.
2009). Bartlett’s sphericity test was statistically significant (p > 0.01). In both cases, the tests suggest that data are adequate for the statistical treatment, so the PCA allowed the identification of three principal components (PC), which explain 71.0% of the total data variance (Table 2). PC1 explains 34.4% of the total data variance and pres-ents high positive factor loads for the E. coli, TN and pH, and negative high factor load for DO. E. coli and TN in PC1 indicate anthropogenic sources, and E. coli indi-cates fecal contamination. TN represents the nitrogen predominant form in the raw domestic sewage (VON SPERLING, 2005; GARCIA-ARMISEN & SERVAIS, 2007). The association of these parameters in the same PC cor-roborates its probable source of anthropogenic source, mainly by the domestic sewage discharge without pre-vious treatment, mainly by the presence of E. Coli with high values (SS3 and SS4). The negative charge for the DO is related to the increase in concentrations of E. coli and TN, which may be associated with increase of
organ-ic loads, such as domestorgan-ic sewage. The main processes that affect the oxygen concentration in water can be represented by physical (temperature) and biological parameters (oxygen consumption by living organisms), as the oxygen solubility decreases with increasing perature, which leads to oxygen depletion at high tem-peratures. The presence of microorganisms in the water leads to a reduction of oxygen concentrations due to the consumption of this substance by microorganisms that live in water, which decompose the biodegradable organic matter at an aerobic process (JHA; OJHA; BHA-TIA, 2007; VEGA et al., 1998). The microbiological action on organic loads, through nitrification processes, leads to the depletion of DO (VON SPERLING, 2005; RUŽDJAK & RUŽDJAK, 2015; Zhong et al., 2018).
PC2 explains 20.8% of the total data variance and presents high positive factor loads for the WT and TP. The parameter TP is suggestive of pollution by anthro-pogenic sources. The contribution of phosphorus can
Table 1 – Descriptive statistics regarding water quality parameters monitored at the four points of water collection in the micro basin of Santa Barbara stream (MSBS). Sampling
site Statistic pH (ºC)WT (mg.LDO -1) (mg.LBOD -1) (mg.LCOD -1) (mg.LTN -1) (mg.LTP -1) (MPN 100 mLE. coli -1)
SS1 Median 6.9ab 24.0a 6.9a 2.6a 71.2a 2.9a 2.3a 14.0a Mean 6.9 22.1 7.9 3.5 71.7 3.8 5.2 20.8 SD 0.3 4.9 2.9 2.2 30.4 2.8 5.8 20.5 n 8 8 5 7 7 7 7 8 SS2 Median 6.5a 24.0a 5.3ab 2.7a 96.2a 4.3ac 3.0a 377.0b Mean 6.4 22.1 5.3 2.5 131.6 4.7 3.5 789.3 SD 0.2 4.9 2.1 0.7 84.2 1.7 1.5 905.3 n 8 8 6 7 7 7 7 8 SS3 Median 7.1b 24.5a 1.5b 1.2a 129.4a 20.1b 4.1a 2500.0c Mean 7.1 22.8 2.1 11.2 195.6 19.7 5.0 2500.0 SD 0.4 3.2 1.9 27.9 150.1 4.9 1.6 0.0 n 8 8 6 7 7 7 7 8 SS4 Median 7.2b 25.5a 2.4b 2.2a 114.0a 10.0bc 3.0a 2500.0c Mean 7.1 23.1 3.3 2.5 177.0 10.5 5.3 2381.8 SD 0.2 4.3 2.6 1.5 167.7 3.7 6.6 334.5 n 8 8 6 7 7 7 7 8
Medians followed by different letters in the same column indicate statistical differences; n: number of cases; SD: standard deviation; MPN: the most probable number; WT: water temperature; DO: dissolved oxygen; BOD: biochemical oxygen demand; COD: chemical oxygen demand; TN: total nitrogen; TP: total phosphorus.
SS1 * SS1 19 18 26 8 SS1
Sampling Site SS1 SS1 Sampling SiteSS1 SS1 SS1 SS1 Sampling SiteSS1 SS1 SS1
SS1 SS1 SS1
Sampling Site SS1 SS1 Sampling SiteSS1 SS1 SS1
SS1 SS1 SS1
Sampling Site SS1 SS1 Sampling SiteSS1 SS1 SS1
SS1 SS1 SS1 Sampling Site SS1 * * * * * 8.00 7.50 7.00 6.50 6.00 pH 28 26 24 22 20 18 16 WT 10 8 6 4 2 0 10 8 6 4 2 0 DO BOD 600 500 400 300 200 100 0 COD 30 25 20 15 10 5 0 TN 25 20 15 10 5 0 TP 2500 2000 1500 1000 500 0 E. coli. 8 21 14 18 18 4 16 21 25 1 29 31 7
DO: dissolved oxygen; BOD: biochemical oxygen demand; COD: chemical oxygen demand; TN: total nitrogen; TP: total phosphorus. Figure 3 – Parameters analyzed by sampling site. The asterisks (*) represent the outliers and the circles (°) represent the
extreme values. For the dissolved oxygen (DO), the outlier (> 15 mg L-1) at SS3 was suppressed for representation purposes.
occur through effluents from domestic and industrial effluents, fertilizers and leachate from animal farms, in addition to the dissolution process of soil com-pounds, but on a much smaller scale (LIBÂNIO, 2008). Thus, if phosphorus containing wastes are constant during hot and dry periods, when water volumes tend to be lower, the phosphorus concentrations increase in the water body, mainly due to water volume reduc-tion. This fact explains the relation between TP and WT in the PC2.
PC3 explains 15.8% of the total data variance and pres-ents a positive high factor load for the COD and a neg-ative high factor load for BOD. The increase in COD in water bodies is mainly due to industrial waste, while the increase in BOD is related to domestic sewage emis-sions (VON SPERLING, 2005). PC3 also presents the BOD, negatively related with COD, which is possibly due to the increase of concentrations of toxic substances (from industrial wastes, representing the COD) that in-hibit bacteria action on the organic load decomposition.
Land use in the micro basin of Santa Barbara stream
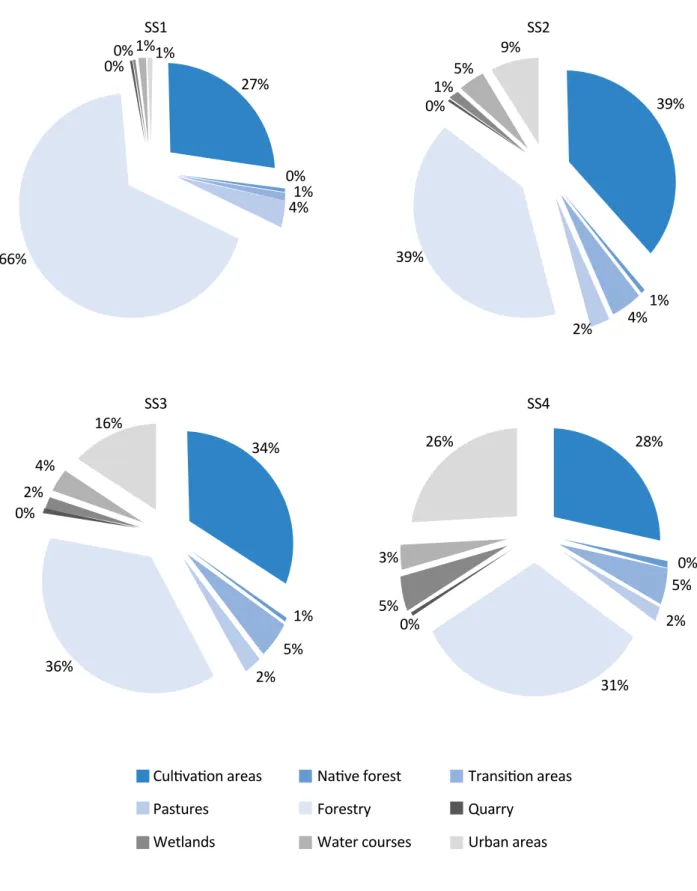
Cartographic maps enabled drawing the maps ofFigure 4, which presents land uses of the contribution areas of each sampling site monitored in the MSBS. An important aspect to be considered as to the land use within the MSBS is the cultivated area ad-vance, which showed a high growth, from 10 km2 in 1953 to 32 km2 in 2016. However, even though there is almost linear growth in five decades (ap-proximately 4.5 km2 per decade), there was a rup-ture in the evolution of cultivation areas between 2006 and 2016, where growth practically stabilized. Cultivation areas stand out north of Santa Bárbara Dam and are associated with smallholdings, such as farmhouses, which produce food for subsistence and a complement to family income (SIMON; TREN-TIN; CUNHA, 2010).
Among the types of land use, none grew as much in the last decade as forestry, which in 2006 occupied an area of approximately 22 km2 and it increased to 35.7 km2 in 2016 (SIMON; TRENTIN; CUNHA, 2010). Regarding pasture areas, there was a
signif-icant drop in this crop, which reduced from 24 km2 in 1953 to 1.8 km2 in 2016. This land use is intrin-sically linked to cattle raising, whose crisis in the sector, worsened by the closure of slaughterhous-es, cooperated for the decline of grazing activity. According to the Economics and Statistics Foun-dation (FUNDAÇÃO DE ECONOMIA E ESTATÍSTICA, 1981), the agricultural census of 1950 indicated a herd of 152,577 animals in Pelotas, while in 2006 the Brazilian Institute of Geography and Statistics (IBGE, 2016) counted 73,233 animals, that is, Pelo-tas’s herd was reduced in almost half.
After 1965, there was an increase in the area of wa-ter bodies. Thus, the impoundment of Santa Bárbara stream in 1968, which originated Santa Bárbara Dam, is a highlight. In contrast, during 1953 to 2016, there was a marked decrease in wetlands, leaving only a third of the original area. The pressure on wetlands occurred due to drainage and landfills for expansion of urban areas and the capture of water to supply the population, negatively impacting soil quality and contributing to the degradation of water
resourc-Table 2 – Matrix of the principal components after Varimax rotation applied to water quality parameters.
Water quality parameter Principal component
1 2 3 E. coli 0.874 -0.004 0.217 TN 0.852 -0.254 -0.139 DO -0.824 -0.064 0.405 pH 0.652 0.282 0.130 WT 0.057 0.842 -0.086 TP 0.008 0.776 0.077 COD 0.313 -0.358 0.780 BOD 0.231 -0.277 -0.628 Variance 34.4% 20.8% 15.8%
Probable source Domestic sewage Domestic sewage/Agriculture Industrial discharge
Principal components > 0.6 were considered significant (FIELD, 2009; HAIR et al., 2009); WT: water temperature; DO: dissolved oxygen; BOD: biochemical oxygen demand; COD: chemical oxygen demand; TN: total nitrogen; TP: total phosphorus.
Water courses Wetlands Cultivation areas Native woods Forestry Pastures Quarry Transition areas Urban areas 52°25’30”W 52°22’0”W 52°25’30”W 52°22’0”W 52°25’30”W 52°22’0”W 52°25’30”W 31°40’ 0”S 31°43’ 30”S 31°47’ 0”S 31°40’ 0”S 31°43’ 30”S 31°47’ 0”S 31°40’ 0”S 31°43’ 30”S 31°47’ 0”S 31°40’ 0”S 31°43’ 30”S 31°47’ 0”S 52°22’0”W N 0 1 2 4km Legend
SS1 SS2 SS3 SS4 Cul�va�on areas Pastures Wetlands Na�ve forest Forestry Water courses Transi�on areas Quarry Urban areas 1%1% 1%5% 9% 39% 1% 4% 2% 39% 16% 26% 28% 0% 5% 2% 31% 0% 5% 3% 34% 1% 5% 2% 36% 0%2% 4% 0%0% 0% 27% 1% 0% 4% 66%
es (SACCO et al., 2015). As shown in Figure 5, urban expansion increases in the contribution area of each sampling site and grows as the sampling sites move away, from SS1 to SS4. Figure 5 also shows the per-centage of land use in each contribution area, where urbanization growth can be observed.
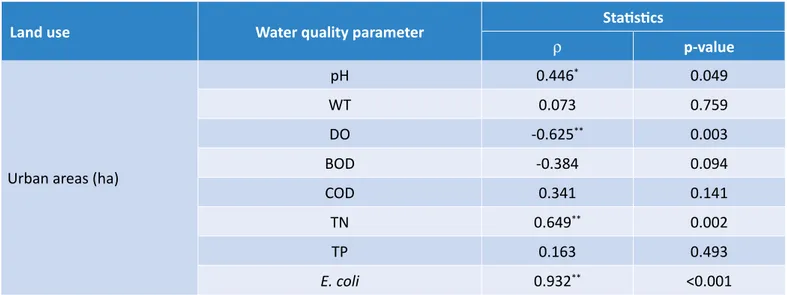
Table 3 shows the correlations identified between land use (urbanization) and water quality parameters mon-itored in the study area.
As seen in Table 3, pH, DO, TN and E. coli showed signif-icant correlations with the variable urban areas, that is, pH and TN presented moderate positive correlations, DO presented moderate negative correlation, whereas
E. coli had a strong positive correlation. These results
demonstrate the significant relation between land use (specifically urbanization) and MSBS water quali-ty. Therefore, the greater the urbanization, the greater the degradation of MSBS water quality.
CONCLUSIONS
This study proposed the application of a methodolo-gy that integrates statistical tools and GIS in the eval-uation of raw water quality and its relation to land uses and occupations (urbanization) through multi-variate statistical analysis of a micro basin, as well as the application of this methodology, using the MSBS, in Southern Brazil, as a case study. Significant statis-tical differences were identified for pH, DO, TN and
E. coli, compared to SS1 and SS2. They demonstrate
that SS3 and SS4 present significant higher levels of contamination, which were attributed to human ac-tivities, due to the urbanization process. The PCA re-sulted in three PC, which together account for 71.0%
of the total data variance associated with anthropo-genic contributions of domestic sewage (PC1), do-mestic sewage/agriculture (PC2), and industrial dis-charge (PC3).
The land use maps elaborated through GIS enabled the identification of the main factors that might be contributing to the water quality degradation of the MSBS, among which was the urbanization, which oc-cupies gradually larger areas from SS1 to SS4. Spear-man’s correlation analysis allowed the identification of statistically significant correlations between urban areas and pH, DO, TN and E. coli, which also stood out in the PCA.
*Correlation is significant at 5% level (bilateral); **correlation is significant at 1% level (bilateral); relation between correlation coefficient and correlation intensity (positive and negative): 0.1-0.3 (weak), 0.4-0.6 (moderate), and 0.7-0.9 (strong) (FIELD, 2009); WT: water temperature; DO: dissolved oxygen; BOD: biochemical oxygen demand; COD: chemical oxygen demand; TN: total nitrogen; TP: total phosphorus.
Table 3 – Spearman’s correlations between land use (urban areas) and water quality parameters monitored in the micro basin of Santa Barbara stream.
Land use Water quality parameter Statistics
ρ p-value
Urban areas (ha)
pH 0.446* 0.049 WT 0.073 0.759 DO -0.625** 0.003 BOD -0.384 0.094 COD 0.341 0.141 TN 0.649** 0.002 TP 0.163 0.493 E. coli 0.932** <0.001
REFERENCES
ALVARADO, A.; ESTELLER, M. V.; QUENTIN, E.; EXPÓSITO, J. L. Multi-Criteria Decision Analysis and GIS Approach for Prioritization of Drinking Water Utilities Protection Based on their Vulnerability to Contamination. Water Resources
Management, v. 30, n. 4, p. 1549-1566, 2016. Available at: <https://doi.org/10.1007/s11269-016-1239-4>. Accessed
on: Oct. 2, 2017.
ALVES DD, RIEGEL RP, QUEVEDO DM, OSÓRIO DMM, COSTA, GM, NASCIMENTO CA, TELÖKEN F. Seasonal assessment and apportionment of surface water pollution using multivariate statistical methods: Sinos River, southern Brazil.
Environmental Monitoring and Assessment, v. 190, n. 384, 2018. Available at:
<https://doi.org/10.1007/s10661-018-6759-3>. Accessed on: Oct. 2, 2017.
AMERICAN PUBLIC HEALTH ASSOCIATION (APHA). Standard methods for the examination of water and wastewater. 21. ed. Washington, D.C.: American Public Health Association, 2005.
BHUTIANI, R.; KHANNA, D. R.; TYAGI, B.; TYAGI, P. K.; KULKARNI, D. B. Assessing environmental contamination of River Ganga using correlation and multivariate analysis. Pollution, v. 1, n. 3, p. 265-273, 2015. Available at: <https://journal. ut.ac.ir/pdf_53929_11dcfe99c31134e6516621abb9db53c3.html>. Accessed on: Oct. 2, 2017.
BRASIL. Ministério do Meio Ambiente. Resolução CONAMA nº 357, de 15 de junho de 2005. Dispõe sobre a classificação dos corpos de água e diretrizes ambientais para o seu enquadramento, bem como estabelece as condições e padrões de lançamento de efluentes, e dá outras providências. Available at: <http://www.mma.gov.br/port/ conama/legiabre. cfm?codlegi=459.> Accessed on: Oct. 1, 2012.
CARDOSO, O. R.; ROCHA, N. S.; XAVIER, R. A.; VALDUGA, E. T.; DISCONZI, G. S.; RADTKE, L.; CRUZ, R. C. Análise de fragilidade ambiental na bacia do rio Pardo - RS, frente à instalação de pequenas centrais hidrelétricas (PCHs). Revista
Brasileira de Recursos Hídricos, v. 20, n. 2, p. 507-522, 2015. http://dx.doi.org/10.21168/rbrh.v20n2.p507-522
CHEN, Y., ZHAO, K.; WU, Y.; GAO, S.; CAO, W.; BO, Y.; SHANG, Z.; WU, J.; ZHOU, F. Spatio-Temporal Patterns and Source Identification of Water Pollution in Lake Taihu (China). Water, v. 8, n. 3, p. 86, 2016. Available at: <http://www.mdpi. com/2073-4441/8/3/86>. Accessed on: Jan. 4, 2017. http://dx.doi.org/10.3390/W8030086
DINIZ, R. B. N.; SOARES, V. G.; CABRAL, L. A. F. Uso de Técnicas de Mineração de Dados na Identificação de Áreas Hidrologicamente Homogêneas no Estado da Paraíba. Revista Brasileira de Recursos Hídricos, Porto Alegre, v. 17, n. 1, p. 65-75, 2012.
In this study, a quantitative approach was applied to es-tablish associations between water quality and land use. This methodology can be extrapolated to any basin, as well as other water pollution parameters that can be as-sociated with different factors besides land, such as pop-ulation density, income, areas with or without sanitary sewage, that is, socioeconomic factors that can contrib-ute to the contamination of water resources.
Through the established methodology, it was pos-sible to identify the contribution of anthropogenic
activities, that is, urbanization to water quality deg-radation. This study results prove that the use of visualization and mapping tools within the GIS plat-form can serve as an important tool to obtain spatial information useful for the development of environ-mental preservation strategies. Regarding the MSBS, treatment of domestic sewage must be a top priority for maintaining water quality in order to ensure safe supply to the population.
ELLIOTT, A.; SEMANEDI-DAVIES, A. F.; SHANKAR, U.; ZELDIS, J. R.; WHEELER, D. M.; PLEW, D. R.; RYS, G. J.; HARRIS, S. R. A national-scale GIS-based system for modelling impacts of land use on water quality. Environmental Modelling & Software, v. 86, p. 131-144, 2016. Available at: <http://www.sciencedirect.com/science/article/pii/S1364815216306260>. Accessed on: Jan. 4, 2017. https://doi.org/10.1016/j.envsoft.2016.09.011
FARHAN, Y.; ANBAR, A.; AL-SHAIKH, N.; MOUSA, R. Prioritization of Semi-Arid Agricultural Watershed Using Morphometric and Principal Component Analysis, Remote Sensing, and GIS Techniques, the Zerqa River Watershed, Northern Jordan.
Agricultural Sciences, v. 8, n. 1, p. 113-148, 2017. Available at: <http://file.scirp.org/Html/9-3001560_73770.htm>.
Accessed on: Oct. 2, 2017. https://doi.org/10.4236/as.2017.81009
FIELD, A. Descobrindo a estatística usando o SPSS. 2. ed. Porto Alegre: Bookman /Artmed, 2009.
FIGUEIREDO FILHO, D. B.; SILVA JÚNIOR, J. A.; ROCHA, E. C. Classificando regimes políticos utilizando análise de conglomerados. Opinião Pública, Campinas, v. 18, n. 1, p. 109-128, 2012. Available at: <http://www.scielo.br/scielo. php?script=sci_arttext&pid=S0104-62762012000100006&lng=en&nrm=iso>. Accessed on: Dec. 11, 2016. http:// dx.doi.org/10.1590/S0104-62762012000100006
FLORENZANO, T. G. Geotecnologias na geografia aplicada: difusão e acesso. Revista do Departamento de Geografia, n. 17, p. 24-29, 2005. Available at: <http://mtc-m12.sid.inpe.br/rep/sid.inpe.br/mtc-m12@80/2006/08.04.16.27?langua gebutton=pt-BR>. Accessed on: Oct. 30, 2016.
FUNDAÇÃO DE ECONOMIA E ESTATÍSTICA. De Província de São Pedro a estado do Rio Grande do Sul - Censos do RS: 1803-1950. Porto Alegre, 1981. Available at: <http://cdn.fee.tche.br/publicacoes/digitalizacao/de-provincia-ide-sao-pedro-a-estado-do-rs-vol-1-1981.pdf>. Accessed on: May 9, 2017.
GARCIA-ARMISEN, T.; SERVAIS, P. Respective contributions of point and non-point sources of E. coli and enterococci in a large urbanized watershed (the Seine river, France). Journal of Environmental Management, v. 82, p. 512-518, 2007. https://doi.org/10.1016/j.jenvman.2006.01.011
HAIR, J. F.; BLACK, W. C.; BABIN, B. J.; ANDERSON, R. E.; TATHAM, R. L. Análise Multivariada de Dados. Porto Alegre: Bookman, 2009. 688 p.
INSTITUTO NACIONAL DE METEOROLOGIA (INMET). Portal. Available at <http://www.inmet.gov.br/portal/>. Accessed on: Oct. 9, 2017.
INSTITUTO BRASILEIRO DE GEOGRAFIA E ESTATÍSTICA (IBGE). Cidades. Available at: <http://cidades.ibge.gov.br/xtras/ perfil.php?codmun=431440>. Accessed on: Dec. 11, 2016.
JHA, R.; OJHA, C. S. P.; BHATIA, K. K. S. Development of refined BOD and DO models for highly polluted Kali river in India. Journal of Environmental Engineering, v. 133, n. 8, 2007. https://doi.org/10.1061/(ASCE)0733-9372(2007)133:8(839)
LIBÂNIO, M. Fundamentos de qualidade e tratamento de água. 2. ed. Campinas: Átomo, 2008.
LIU, Y.; DE SMEDT, F. Flood modeling for complex terrain using GIS and remote sensed information. Water Resources
Management, v. 19, n. 5, p. 605-624, 2005. https://doi.org/10.1007/s11269-005-6808-x
PAZ, M. V.; FREITAS, C. A.; NICOLA, D. S. Avaliando a intensidade da modernização da agropecuária gaúcha: uma aplicação de análise fatorial e cluster. In: CONGRESSO DA SOCIEDADE BRASILEIRA DE ECONOMIA, ADMINISTRAÇÃO E SOCIOLOGIA RURAL, 44., 2006, Fortaleza. Anais... 2006. Available at: <http://purl.umn.edu/148468>. Accessed on: Dec. 9 2016.
PORTO, C. J.; HARTWIG, M. P. Impactos sócio-ambientais provocados pelas ocupações irregulares do solo urbano as margens do canal Santa Bárbara em Pelotas – RS utilizando um SIG. Available at: <http://observatoriogeograficoamericalatina. org.mx/egal14/Geografiasocioeconomica/Geografiaurbana/094.pdf>. Accessed on: Oct. 12, 2016.
RAHMAN, A. T. M. S.; KAMRUZZAMAN, M.; JAHAN, C. S.; MAZUMDER, Q. H.; HOSSAIN, A. Evaluation of spatio-temporal dynamics of water table in NW Bangladesh: an integrated approach of GIS and Statistics. Sustainable Water Resources
Management, v. 2, n. 3, p. 297-312, 2016. Available at: <https://doi.org/10.1007/s40899-016-0057-4>. Accessed on:
Oct. 2, 2017.
RUŽDJAK, A. M.; RUŽDJAK, D. Evaluation of river water quality variations using multivariate statistical techniques: Sava River (Croatia): a case study. Environment Monitoring and Assessment, v. 118, n. 4, p. 215, 2015. https://doi. org/10.1007/s10661-015-4393-x
SACCO, A. G.; RUI, A. M.; BERGMANN, F. B.; MÜLLER, S. C.; HARTZ, S. M. Perda de diversidade taxonômica e funcional de aves em área urbana no sul do Brasil. Iheringia, Porto Alegre, v. 105, n. 3, p. 276-287, set. 2015. Available at: <http:// www.scielo.br/scielo.php?script=sci_arttext&pid=S0073-47212015000300276&lng=en&nrm=iso>. Accessed on: May 10, 2017. http://dx.doi.org/10.1590/1678-476620151053276287
SERVIÇO AUTÔNOMO DE SANEAMENTO DE PELOTAS (SANEP). Portal. Available at: <https://sanep.com.br/esgoto/ estacoes-tratamento>. Accessed on: Oct. 15, 2016.
SHEELA, A. M.; LETHA, J.; JOSEPH, S.; CHACKO, M.; KUMAR, S. P. S.; THOMAS, J. Water quality assessment of a tropical coastal lake system using multivariate cluster, principal component and factor analysis. Lakes & Reservoirs: Research
& Management, v. 17, n. 2, p. 143-159, 2012. Available at:
<http://onlinelibrary.wiley.com/doi/10.1111/j.1440-1770.2012.00506.x/full>. Accessed on: Jan. 4, 2017.
SIMON, A. L.; TRENTIN, G. Elaboração de cenários recentes de uso da terra utilizando imagens do Google Earth. Ar@
cne, n. 116, 2009. Available at: <http://www.ub.edu/geocrit/aracne/aracne-116.htm>. Accessed on: Jan. 5, 2017.
SIMON, A. L.; TRENTIN, G.; CUNHA, C. M. L. Avaliação da dinâmica do uso da terra na Bacia do Arroio Santa Bárbara – Pelotas (Brasil), no período de 1953 a 2006. Scripta Nova, v. 14, n. 327, 2010. Available at: <http://www.ub.edu/geocrit/ sn/sn-327.htm>. Accessed on: Dec. 10, 2016.
SINGH, K. P.; MALIK, A.; SINHA, S. Water quality assessment and apportionment of pollution sources of Gomti river (India) using multivariate statistical techniques - a case study. Analytica Chimica Acta, v. 538, n. 1-2, p. 355-374, 2005. https://doi.org/10.1016/j.aca.2005.02.006
VEGA, M.; PARDO, R.; BARRADO, E.; DEBÁN, L. Assessment of seasonal and polluting effects on the quality of river water by exploratory data analysis. Water Research, v. 32, n. 12, p. 3581-3592, 1998. https://doi.org/10.1016/S0043-1354(98)00138-9
VON SPERLING, M. Princípios do tratamento biológico de águas residuais: introdução à qualidade das águas e ao tratamento de esgotos. 3. ed. Belo Horizonte: Departamento de Engenharia Sanitária e Ambiental, Universidade Federal de Minas Gerais, 2005.
ZHANG, C.; COOPER, H.; SELCH, D.; MENG, X.; QIU, F.; MYINT, S. W.; ROBERTS, C.; XIE, Z. Mapping urban land cover types using object-based multiple endmember spectral mixture analysis. Remote Sensing Letters, v. 5, n. 6, p. 521-529, 2014. https://doi.org/10.1080/2150704X.2014.930197
ZHONG, M.; ZHANG, H.; SUN, X.; WANG, Z.; TIAN, W.; HUANG, H. Z. Analyzing the significant environmental factors on the spatial and temporal distribution of water quality utilizing multivariate statistical techniques: a case study in the Balihe Lake, China. Environmental Science and Pollution Research, v. 25, n. 29, p. 29418-29432, 2018. https://doi. org/10.1007/s11356-018-2943-9