ISSN 1553-345X
© 2010 Science Publications
Corresponding Author: Oswaldo Villena Carpio, Environmental Science Graduate Program, Towson University, Towson, Maryland, USA Tel: 410-323-0204
Assessing the Environmental Impacts of Urban Growth Using
Land Use/Land Cover, Water Quality and Health Indicators: A
Case Study of Arequipa, Peru
1
Oswaldo Villena Carpio and 2,3Brian D. Fath
1
Environmental Science Graduate Program, Towson University, Towson, Maryland,
2
Department of Biology, Towson University, Towson, Maryland, USA
3
Dynamic Systems Program,
International Institute for Applied Systems Analysis, Laxenburg, Austria
Abstract: Problem statement: This research assesses the direct effects of urban expansion on land cover/use, river flow, water quality and the indirect effects of these variables in the rate of gastrointestinal disease in people in Arequipa, Peru through the combined use of satellite remote sensing and geographic information systems. Approach: It also uses information about demographic changes, hydrologic data and land cover change in the Arequipa region for the last 17 years. The goal is to understand the relationship between urbanization, water quality in the Chili River and incidence of gastrointestinal diseases. Results: Landsat imagery was used to determine this relationship and to extrapolate business as usual trends into the future ten years from now. Results indicate that there has been notable urban growth and a loss in volcanic material land and cropland between 1990 and 2007, as new urban developments have appeared in these areas. The population expansion over volcanically active area is particularly troubling since it poses a potential human health risk. We also model a business as usual scenario out to the year 2020, which shows continued loss of these land use types and serves as a warning for land managers to consider alternate policies. Conclusion/Recommendations: The analysis also shows a direct correlation between urbanization with the decrease of water quality and the increase in the incidence of gastrointestinal diseases.
Key words: Population growth, land use change, water quality, remote sensing, geographic information systems, urbanization, urban growth, environmental impacts, hydrologic data, demographic changes
INTRODUCTION
In the last 50 years, developing countries have experienced rapid and unprecedented urban growth due largely to industrialization and changes in the global economy (Cohen, 2006). At the beginning of the 20th century, just 16 cities in the world had populations of more than a million of people, the vast majority of which were in industrialized countries. Today, at the beginning of the 21st century, there are around 400 cities in the world with populations over a million people, 75 % of which are in low and middle income countries.
The population increase in urban areas is mostly occurring in the developing countries of Latin America, East Asia and the Pacific, South Asia, Central Asia, Middle East and North Africa and the Sub-Saharan Africa with middle and low incomes. Similarly, in 1950 Buenos Aires was the only city with more than 5 million people in Latin America. But by 1970, four
cities in Latin America surpassed the 5 million population mark (Buenos Aires, Rio de Janeiro, Sao Paulo and Mexico City). By 2000, Lima, Santiago and Bogota had joined this group. The United Nations projected that by 2015, at least 10 cities in Latin America will surpass 5 million people, including Guatemala City and Belo Horizonte.
Mexico City with 19 million people is also facing environmental and ecological problems due to urban growth (Cohen, 2006). Some of these problems are the shortage of water resources for human consumption. Almost 72% of city’s water supply comes from the overexploited aquifer that lies under the metropolitan area. Groundwater levels have been declining, resulting in the sinking of the land which has lowered the city center area by an average 7.5 m and resulting in damage to infrastructure such as water and sewer lines (National Research Council, 1995). The heat island phenomenon had also developed due to air pollution, nitrogen dioxide and ozone levels that are two to three times more than the permissible levels, all of which affect the health of Mexico City’s population (Jauregui, 1998).
Other South American cities that are facing many environmental, ecological and social problems due to urban growth are Santiago and Lima. Santiago is experienced a change from a natural semiarid surface to urban areas which increase pollution in both the water and air, especially because the increase in the number of vehicles is the principal source of smog (Romero et al., 1999). Lima growth accelerated after 1940. By 1993, seven of ten Peruvians were living in urban areas and two out of five of these in Lima. The population increase has affected environmental factors such as air and water pollution; social factors such as crime and housing; and services like water network and sewage treatment plants (United Nations University, 1996).
In this context in Latin America, Arequipa, Peru was chosen as a case study to analyze how population increase affects directly land use/cover, river flow and water quality; and indirectly how this affects the rate of gastrointestinal disease in people. Arequipa is located in Southern Peru and it has experienced rapid population growth over the last several decades. In the 1981 census, the urban population was 498,210 people, in the 1993 census, the population had grown to 703,369 and in the most recent 2007 census, the population was 892,250 (National Institute of Statistics and Informatics). As a result of population increase, the amount of impervious areas is increasing in the city through the construction of houses, roads and other built structures.
Arequipa is the capital of the province and the region of Arequipa. The area of the region of Arequipa is 63345.4 Km2. Therefore, based on the recent census
data of 2007, from the National Institute of Statistics and Informatics, its population density is 18.2 people/ Km2 (National Institute of Statistics and Informatics). Arequipa is located within the Andean mountain range between 2025-2335 m. Its climate is arid with an average annual precipitation of 10.4 mm and its
temperature fluctuates between 10-22° Celsius. The principle economic activities of Arequipa are (1) agriculture, including potatoes, onions, garlic, diverse vegetables and alfalfa; (2) dairy (the leading producer of milk in Peru); (3) mining, with the extraction of copper, lead, zinc, silver and gold; (4) manufacturing, with the production of handicraft and milk products such as cheese, butter and yogurt; and, (5) fisheries.
Research on land cover is an important aspect of global change studies, its interactions with biogeochemical cycles, climate, ecosystem process and human activities (Aguilar et al., 2003). Since the 1990s, much attention has been paid to the relationships between urban growth and landscape change and between urban growth, population growth and their impacts in the ecosystem (Lopez et al., 2001). Geospatial technology and population census data have also been integrated to assess land use/land cover change and how people use and develop land (Martinuzzi et al., 2003).
The combination of population growth and land-use changes has altered the quantity and quality of the water of the Chili River which flows through Arequipa. This river is the primary source of water for human consumption and for agriculture. Seven thousand farmers use the river water to irrigate crops such as vegetables, potatoes and onions, as well as alfalfa for animal feed. Also, 35 million cubic meters of untreated sewage are deposited annually in the chili river. In this context, the goal was to assess the effects of urbanization in the watersheds of Arequipa through combined investigations of different indicators such as land cover/use changes (Landsat satellite imaginary), demographic changes in the region, river flow changes, water quality and human health data (gastrointestinal problems). The study focuses on the past 17 years as data are available for this period. Remote sensing and Geographic Information Systems (GIS) were used to determine change in land cover to predict a possible scenario ten years from now (2017).
Use of indicators to assess environmental impacts:
The environmental impacts of urban growth cannot be always assessed by using direct measurements. Since the 1990s, numerous indicators were developed to assess the adverse effects of urban growth in the environment, such as water pollution, land cover/use changes, soil erosion and emission of greenhouse gases (McMahon and Cuffney, 2000). In this particular study, land cover/use, population, number of fecal and total coliforms and number of gastrointestinal cases was used as indicators of the adverse effects of urban growth.
The US Environmental Protection Agency uses land cover/use as an indicator of changes in landscape patterns to measure two major characteristics of the landscape: land cover composition and spatial configuration. Some examples of these compositions are percentages of urban and forest land cover. Changes in land cover/use can alter the physical, biological and chemical processes in an ecosystem (United States Environmental Protection Agency).
There are also many studies that use indicators to evaluate the effects of urbanization on the ecological characteristics of streams. One of these studies was conducted by a team of the United States Geological Survey to evaluate the effects of urbanization on the biological, physical and chemical characteristics of coastal New England streams. The metrics they used were based on macro invertebrate, bacteria, fish, algae, habitat and water chemistry (Coles et al., 2004). In their report, urbanization refers to the anthropogenic process of changing the land cover through urban development and how this process has altered the land cover from its natural form. Single-variable surrogates for urban intensity, such as population density or measures of impervious surface were also used to represent the urban intensity in a drainage basin, but a variety of factors can be responsible for the associated ecological disturbances (Coles et al., 2004).
River flow is affected by natural changes in climate, seasonal weather patterns and by human activities such as the building of dams, channels and by human use of water (Government of Alberta, 2009). In the present study, human use of water is used as an indicator to evaluate variations in river flow in the watershed of Arequipa. Water use is an indicator that measures the overall pressure on the fresh water resources, providing the proportion of water abstracted for all the economic sectors like public water supply, industry, agriculture, energy in relation to water resources. This indicator gives an indication of vulnerability of a city, region and country to water shortages and assesses the need for supply and demand
adjustment in water management policies. Streams basins have been subjected to a wide of variety of human alterations like water withdrawals, treated wastewater discharges, construction of dams, septic systems, forest cleaning and urbanization, all of which have the potential to affect stream flow regimes (Weiskel et al., 2009).
To assess water quality there are many tests that can be conducted to determine the quality and safety of water. Selected tests can be run initially as indicator tests to give an idea of the overall situation. Two of the most common tests used as indicators are total and fecal coliforms counts. These are used herein.
Impervious areas: Impervious surface is an indicator of intensive land use. Furthermore, the infiltration capacity of these areas is lowered (Botsford et al., 2003). It is important to determine the percentage of the impervious areas inside the watershed. According to Schuler, impervious areas associated with medium density single family homes can range from 20-50% of impervious cover depending on the area covered by streets and parking. He considered as impervious areas roads, parking lots, sidewalks, rooftops and other impermeable surfaces of the urban landscape.
The determination of impervious areas within the Chili watershed is achieved using land use categories including houses, buildings; paved roads; dirt roads; parking areas; sidewalks; water bodies; agriculture fields; grass land; bare ground and area cover with volcanic material and assuming impervious values to these categories. Information on impervious areas related to the construction of houses and buildings was provided by the National Superintendent of Public Registers of Arequipa-Peru-SURNARP. GIS images were also provided by the National System of Land Register from Peru to determine impervious areas. This study employs the impervious surface extraction process developed by the Massachusetts Geographic Information System (2007). The process starts with manually examining the images to determine the nature and distribution of classes. The segmentation is adopted depending on the relative proportions of urban and vegetation features, as well as on the color balancing of the images. The study focuses on three categories: Built-up, Vegetation and Water bodies. Finally, each classified tile is manually reviewed and edited attributing a color, class name or number.
between land cover and land use because these two terms often are used interchangeably. Land cover is the physical material at the surface earth such as asphalt, trees, grass, water, bare ground, ice. On the other hand, land use is a description of how people use the land and socioeconomic activity. Urban and agriculture lands uses are two of the most common classes (Fisher, 2005).
There are two primary methods for capturing information on land cover: field survey and analysis of remote sensing imagery, for this study remote sensing imagery with supervised classification (Campbell, 2008) was used. The main purpose of satellite classification is the recognition of objects on the Earth surface and their presentation in thematic maps. Land cover is determined by the analysis of gray values in satellite imagery and classification is one of the most important steps in handling remote sensing imagery. This classification is an important input of data for geographic information systems (Kokalj and Ostir, 2007).
Water quality: Total and fecal coliforms: Water quality refers to a variety of physical, chemical, biological and aesthetic factors, both natural and human caused. Water quality is relative because a strict classification depends on the use that it will have. For example, agriculture uses have different standards than for human use. Here, we focus on total and fecal coliforms for human consumption and agriculture uses because the water of the Chili River is used for both.
Most coliform bacteria are harmless to humans; however their presence in water indicates that other disease-causing organisms such as other bacteria, viruses, protozoa and pathogens may be present in the water which could cause illnesses. The permissible coliform levels in water for human uses in Peru is zero, although in exceptional cases 3 coliforms in 100 mL of water is allowable according to the Peruvian Technical Norm 202-087. For agriculture use, the permissible levels in Peru are 1000 NMP/100 mL of fecal coliforms for vegetables of short stem and 4000 NMP/100 mL for vegetables of tall stem; and 5000 NMP/100 mL of total coliforms for vegetables of short stem and 20000 NMP/100 mL of total coliforms for vegetables of tall stem (Direccion Regional de Salud-DIGESA).
MATERIALS AND METHODS
The study area: The area of study is the city of Arequipa. Its area is 417.42 km² localized in the following coordinates: 16°18’88’’S, 71°32’51’’W in the North, 16˚28’09.6’’S, 71°34’25.7’’W in the South, 16°25’01.7’’S,71°27’12’’W in the East and 16°22’06.26’’S,71°39’59.19’’W in the West (Fig. 1).
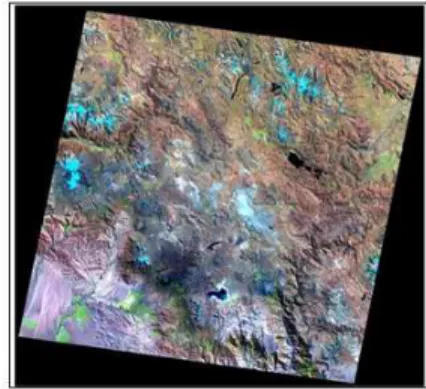
Landsat images: Landsat 5 imagery is used to determine the land cover change in the City of Arequipa. This imagery has a 30 meter resolution and was provided by Earth Resources Observation and Science Center (EROS) of the US Geological Survey (USGS) organization using the USGS Global Visualization Viewer (Fig. 2). The Global Visualization Viewer allows one to download Landsat imagery from the USGS. This image was taken using the Multispectral Scanner Subsystem.
To assess land cover change for Arequipa city, Landsat scenes were used from the years 1990 and 2007. The coordinates of the scenes are -15.9 S and -71.1 W. Cloud cover was between 0 and 10% which represents a high quality imagery to determine land cover with high levels of accuracy (Fig. 2). An MSS Landsat is defined as an image representing a ground area of approximately 185 km in the east-west direction and 178 km in the north-south direction (Campbell, 2008).
IDRISI Taiga was used to process and analyze the remote sensing data. IDRISI Taiga is a software used to analyze raster data (satellite data), covering the full spectrum of GIS and remote sensing needs from database query, image enhancing, spatial modeling and classification such as land cover classification that was used in this study (Eastman, 2009).
Fig. 1: Location of the area of study Source: Google Earth
Fig. 2: Landsat image of the Arequipa region Source:
Table 1: Population of Arequipa from 1990-2017
Year Population Year Population Year Population
1990 659244 2000 806107 2009 916254
1991 674398 2001 818541 2010 928456
1992 689014 2002 830034 2011 941235
1993 703369 2003 840975 2012 942651
1994 717743 2004 851750 2013 950976
1995 732415 2005 862747 2014 963421
1996 747394 2006 877477 2015 979258
1997 762672 2007 892250 2016 997105
1998 777832 2008 905743 2017 1012124
1999 792450
Source: National Institute of Statistics and Informatics-INEI
Table 2: Housing in Arequipa from 1990-2007
Year Number of 5 % W/O Total # Total new
area km2 new houses register houses impervious
1990 835 41.75 877 0.09
1991 728 36.40 764 0.08
1992 875 43.75 919 0.09
1993 934 46.70 981 0.10
1994 1086 54.30 1140 0.11
1995 1353 67.65 1421 0.14
1996 1750 87.50 1838 0.18
1997 1420 71.00 1491 0.15
1998 1823 91.15 1914 0.19
1999 2385 119.25 2504 0.25
2000 4256 212.80 4469 0.45
2001 6546 327.30 6873 0.69
2002 8252 412.60 8665 0.87
2003 10340 517.00 10857 1.09
2004 12960 648.00 13608 1.36
2005 13584 679.20 14263 1.43
2006 11648 582.40 12230 1.22
2007 13245 662.25 13907 1.39
Total 94020 4701.00 98721 9.87
Source: National Superintendence of Public Registration
Process of land cover classification of Arequipa: To do the land cover classification a standard procedure was followed that has been used in studies at both global scale and local scales. An example of a study at the global scale is the “Global Land Cover Classification Collection 1998” using image classification, which was developed by the Department of Geography at the University of Maryland College Park using satellite imagery. This classification distinguishes fourteen land cover classes: water, urban and built, evergreen needleleaf forest, evergreen broadleaf forest, deciduous needleleaf forest, deciduous broadleaf forest, mixed forest, woodland, wooded grassland, closed shrubland, open shrubland, grassland, cropland, tundra and bare ground (Hansen et al., 2000). For the land cover classification process of Arequipa remote sensing imagery was analyzed using the IDRISI Taiga software.
Using the composites and NDVI images, the images of 1990 and 2007 were classified using the hard classifier called Maximum Likelihood to observe the changes that had occurred in urban and green areas of the city of Arequipa. The Maximum Likelihood was used because it works very well when the training sites and signature files are very well defined (reasonably
homogeneous). To do the classification seven classes were used: urban, water, pasture, agriculture, volcanic material, sand flats and bare ground.
An accuracy assessment was done using 50 random points in aerial image from Arequipa retrieved from Google Earth. Campbell 2008 defined accuracy assessment as the comparison of two maps, one based upon analysis of remotely sensed data and another designated as a reference map assumed to be accurate. Using the tool called ERRMAT that compares two images (one that contains the interpreted land cover classification derived from remotely sensed data and the second contains the results of ground true investigation or reference map), the accuracy of land cover from 1990 is 72% and for land cover from 2007 is 75%.
Population projections: This study used population data provided by National Institute of Statistics and Informatics-INEI of Peru. INEI projected population until 2025 based on the national surveys of 1981, 1993 and 2007 (National Institute of Statistics and Informatics). Here the population from the year 1990 to the projected population in 2017 was used (Table 1).
Housing in Arequipa: The data for the number of new houses constructed per year were provided by the National Superintendence of Public Registration of Arequipa, Peru from 1990-2007 (Table 2). They estimated an average of 5% of properties do not get registered in order to avoid paying taxes. As a reference, the average area of houses in Arequipa is 180 m2, of which 100 m2 represent impervious area (construction). This is only considered as a reference because sometimes apartments are built on top of houses. The area of new houses constitutes the increase in the impervious area in Arequipa city.
Table 3: Average annual discharge in Arequipa, 1990-2007 Charcani Station: Avg.
Year annual discharge (m³ sec−1)
1990 12.55 1991 13.32 1992 16.78 1993 8.47 1994 17.64 1995 10.03 1996 6.55 1997 6.01 1998 11.00 1999 18.68 2000 16.34 2001 25.06 2002 17.29 2003 11.63 2004 13.81 2005 10.88 2006 19.60 2007 11.88
Source: SENAMHI
Table 4: Number of People with treated gastrointestinal health problems per year from 1990-2007
Cases per
Year Total Male Female 1000 people
1990 26490 13548 12942 40.2
1991 28169 14215 13954 41.8
1992 29143 14892 14251 42.3
1993 27456 14562 12894 39.0
1994 31268 15234 16034 43.6
1995 36216 17589 18627 49.4
1996 35264 18254 17010 47.2
1997 38624 19213 19411 50.6
1998 43265 23154 20111 55.6
1999 48761 25380 23381 61.5
2000 53834 26845 26989 66.8
2001 59123 27564 31559 72.2
2002 74374 38264 36110 89.6
2003 85060 42857 42203 101.1
2004 74953 36546 38407 88.0
2005 89349 43652 45697 103.6
2006 108114 54275 53839 123.2
2007 104691 51902 52789 117.3
Source: Health Ministry of Arequipa, Peru
These data were used to determine the average daily urban water use as a percentage of the average daily stream flow of the Chili River.
Arequipa water per capita from 1990-2007 is available to see historical trends and this is projected forward to 2017 to identify potential water shortages. To do this, water use per capita and population data were used. Published estimates indicate that people use 120 liters of water per day in Peru. It is estimated that of this volume 36% is used in the toilet, 31% in personal hygiene, 14% in washing clothing, 8% watering gardens, washing the car, or cleaning the house, 7% washing kitchen utensils and 4% in drinking and preparing food. Domestic uses represent 8% of the
total, industrial uses represent 23% and agricultural uses represent 68%.
Change in the number of fecal and total coliforms:
Data of fecal and total coliforms present in water of the Chili River used to irrigate crops such as potatoes, onions, garlic and diverse vegetables such lettuce, radish, green beans, chard and others that provides food for the population of Arequipa were provided by the Environmental Office of the Health Ministry of Arequipa from 1990-2007. These data were collected from 9 sampling stations along Chili River from upstream to downstream called E1: Represa Aguda Blanca, E2: Charcani V, E3: Charcani VI, E4: Captacion Planta SEDAPAR, E5: Puente Grau, E6: Puente Tingo, E7: Puente Uchumayo, E8: Fondo Moroco, E9: Puente Vitor.
An index for fecal and total coliforms was developed using the data provided by the Health Ministry of Arequipa. In the index, values less than or equal to one means that the number of coliforms is under the permissible levels and values greater than one exceed the permissible levels. For agriculture use the permissible levels in Peru are 1000 NMP/100 mL of fecal coliforms for vegetables of short stem and 4000 NMP/100 mL for vegetables of tall stem; and 5000 NMP/100 mL of total coliforms for vegetables of short stem and 20000 NMP/100 mL of total coliforms for vegetables of tall stem (Direccion Regional de Salud-DIGESA).
Infectious intestinal illness: The number of cases with gastrointestinal health problems was provided by the Health Ministry of Arequipa, Peru over an 18 year period (Table 4). The data are divided between number of male and female number of cases, collected from the 5 hospitals of the city: The Public Hospitals “Honorio Delgado”, “Goyeneche”, “Policlinico Yanahuara”, “Central del Seguro Social” and “Edmundo Escomel”.
A ten year land cover projection of Arequipa city:
For this study a projection of land cover change of the city of Arequipa, Peru for the year 2017 was developed. Baseline land cover maps from 1990 and 2007 were used.
RESULTS
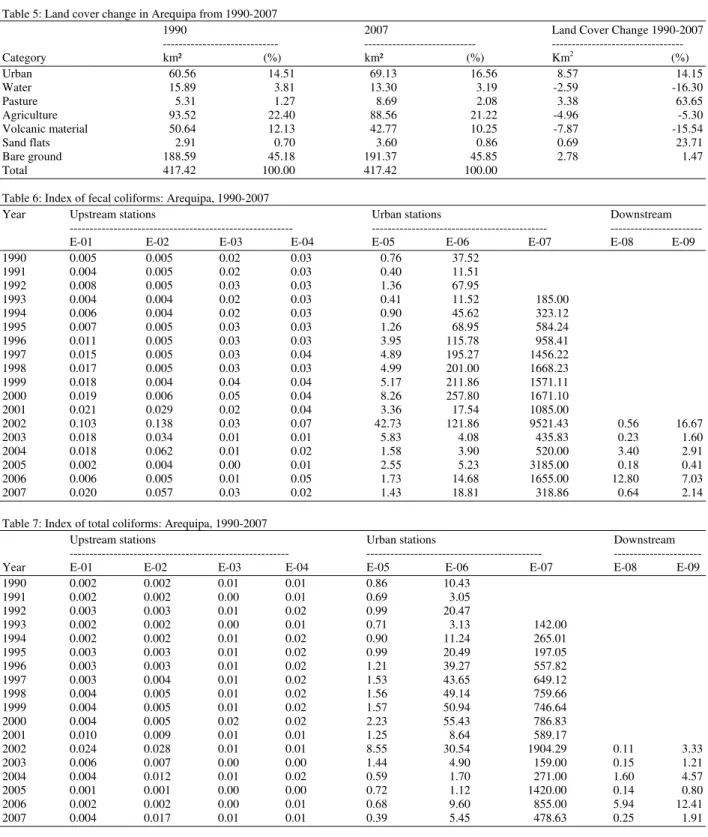
Analysis and comparison of classified remote sensing images of Arequipa from 1990 and 2007 produce a clear indication of development trends in Arequipa city (Table 5). Urban area increased from 60.56 km² to 69.13 km² in 17 years. This represents an increase of 14.15 % of urban area. Changes in urban area are due to the increase of the city population of Arequipa which went from 659,244 people in 1990 to 892,250 in 2007. The increase of urban area has caused a decrease in the area used for agriculture. In 1990, 93.52 km² were used for agriculture, whereas in 2007 only 88.56 km² were used. It is also evident that the new housing developments of Arequipa are being built in the direction of the Misti Volcano and in bare ground area in the base of the volcano, which represents volcanic hazards for the families living there. We can see that the area cover for volcanic material has been reduced from 50.64-42.77 km² (Table 5), which represent a 15.54% decrease. Houses located inside the 15 km radius from the volcano are in high risk because volcanic eruptions have the potential to cause devastation to property and activities over a wide area, causing huge economic and human losses (Blong, 1984). Many of the new houses are located inside of the 15 km high risk area.
Pasture area increased by 3.38 km². It can be implied that this change in pasture area can be due to crop rotation or land rest. In Arequipa, frequently every 2 or 3 seasons with a single crop such as onions or potatoes, alfalfa or grass is planted and in some cases the land undergoes a period of rest where nothing is planted (frequently 6 months). So, minimum changes in pasture area, bare ground or sand flats can be due to these cyclic processes. Surface covered by water bodies has decreased by 2.59 km². Most of these become bare ground area.
Projected land cover of Arequipa City for 2017: The main results are that if the tendency from 1990-2007 continues there will be an increase of the urban area in Arequipa city by approximately 4 km², increase in pasture area by 1.75 km ² and increase in bare ground area by 3.15 km². On the other hand, agriculture land will decrease by 2.66 km² mainly because urban growth, area cover with volcanic material will decrease by 4.14 km² where probably new homes will be built. Finally, water surface will also decrease by almost 2 km² and sand flats areas will decrease by 0.08 km².
Population and housing: The population density has increased from 10885-12906 km−2 during the period
from 1990 to 2007 and is predicted to increase to 13864 km−2 by 2017 under the business as usual scenario.
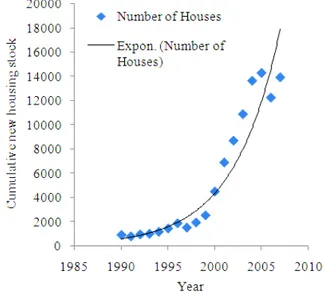
The housing increase is another consequence of population increase. Between 1990 and 2007, 98,721 houses were built in Arequipa (Fig. 3). There is a direct and very strong linear correlation (r2 = 0.89) between the increase in population and housing in Arequipa from 1990-2007.
Average daily urban water use as a percentage of average daily stream flow: Average daily water use has increased steadily between 1990 and 2007 from 79,109 cubic meters per day in 1990 into 107,070 cubic meters per day in 2007 due to population growth.
Average daily flow is evaluated at the Charcani station located at the start or upstream of the city. It is the location where water is extracted for urban uses. The Chili River is the only source of water for human, agriculture, commercial and industrial use in Arequipa.
The average daily water use increase represents a problem for the city of Arequipa since it is located in an arid region where the only source of water is the Chili River. During the low flow year of 1997, urban demand was as high as 18% of the river’s average daily flow. This does not bode well for sustainable urban development, given competition for water from other sectors and the need to assimilate pollution. Human water uses represent only 8% of all water uses. The other 92% is used in agriculture, industrial and commercial uses.
Table 5: Land cover change in Arequipa from 1990-2007
1990 2007 Land Cover Change 1990-2007
--- --- ---
Category km² (%) km² (%) Km2 (%)
Urban 60.56 14.51 69.13 16.56 8.57 14.15
Water 15.89 3.81 13.30 3.19 -2.59 -16.30
Pasture 5.31 1.27 8.69 2.08 3.38 63.65
Agriculture 93.52 22.40 88.56 21.22 -4.96 -5.30
Volcanic material 50.64 12.13 42.77 10.25 -7.87 -15.54
Sand flats 2.91 0.70 3.60 0.86 0.69 23.71
Bare ground 188.59 45.18 191.37 45.85 2.78 1.47
Total 417.42 100.00 417.42 100.00
Table 6: Index of fecal coliforms: Arequipa, 1990-2007
Year Upstream stations Urban stations Downstream
--- --- ---
E-01 E-02 E-03 E-04 E-05 E-06 E-07 E-08 E-09
1990 0.005 0.005 0.02 0.03 0.76 37.52
1991 0.004 0.005 0.02 0.03 0.40 11.51
1992 0.008 0.005 0.03 0.03 1.36 67.95
1993 0.004 0.004 0.02 0.03 0.41 11.52 185.00
1994 0.006 0.004 0.02 0.03 0.90 45.62 323.12
1995 0.007 0.005 0.03 0.03 1.26 68.95 584.24
1996 0.011 0.005 0.03 0.03 3.95 115.78 958.41
1997 0.015 0.005 0.03 0.04 4.89 195.27 1456.22
1998 0.017 0.005 0.03 0.03 4.99 201.00 1668.23
1999 0.018 0.004 0.04 0.04 5.17 211.86 1571.11
2000 0.019 0.006 0.05 0.04 8.26 257.80 1671.10
2001 0.021 0.029 0.02 0.04 3.36 17.54 1085.00
2002 0.103 0.138 0.03 0.07 42.73 121.86 9521.43 0.56 16.67
2003 0.018 0.034 0.01 0.01 5.83 4.08 435.83 0.23 1.60
2004 0.018 0.062 0.01 0.02 1.58 3.90 520.00 3.40 2.91
2005 0.002 0.004 0.00 0.01 2.55 5.23 3185.00 0.18 0.41
2006 0.006 0.005 0.01 0.05 1.73 14.68 1655.00 12.80 7.03
2007 0.020 0.057 0.03 0.02 1.43 18.81 318.86 0.64 2.14
Table 7: Index of total coliforms: Arequipa, 1990-2007
Upstream stations Urban stations Downstream
--- --- ---
Year E-01 E-02 E-03 E-04 E-05 E-06 E-07 E-08 E-09
1990 0.002 0.002 0.01 0.01 0.86 10.43
1991 0.002 0.002 0.00 0.01 0.69 3.05
1992 0.003 0.003 0.01 0.02 0.99 20.47
1993 0.002 0.002 0.00 0.01 0.71 3.13 142.00
1994 0.002 0.002 0.01 0.02 0.90 11.24 265.01
1995 0.003 0.003 0.01 0.02 0.99 20.49 197.05
1996 0.003 0.003 0.01 0.02 1.21 39.27 557.82
1997 0.003 0.004 0.01 0.02 1.53 43.65 649.12
1998 0.004 0.005 0.01 0.02 1.56 49.14 759.66
1999 0.004 0.005 0.01 0.02 1.57 50.94 746.64
2000 0.004 0.005 0.02 0.02 2.23 55.43 786.83
2001 0.010 0.009 0.01 0.01 1.25 8.64 589.17
2002 0.024 0.028 0.01 0.01 8.55 30.54 1904.29 0.11 3.33
2003 0.006 0.007 0.00 0.00 1.44 4.90 159.00 0.15 1.21
2004 0.004 0.012 0.01 0.02 0.59 1.70 271.00 1.60 4.57
2005 0.001 0.001 0.00 0.00 0.72 1.12 1420.00 0.14 0.80
2006 0.002 0.002 0.00 0.01 0.68 9.60 855.00 5.94 12.41
2007 0.004 0.017 0.01 0.01 0.39 5.45 478.63 0.25 1.91
Fecal and total coliforms: One can infer that due to the increase of population, housing and runoff, the number of fecal and total coliforms had increased exponentially in the river Chili. Also, we can note that in the first 4 sampling stations where the influence of
Grau, E6: Puente Tingo and E7: Puente Uchumayo (urban area), the increase of total coliforms surpasses the permissible levels in many cases by more than 900%, especially the sampling station E7 located at the end of the city that collects all runoff from the city during the rainy season and from daily agriculture runoff and cowsheds, considering that Arequipa is the main producers of milk in Peru. In the last two sampling stations, E8: “fundo Morocco” and E9: “Puente Vitor” located outside the city the number of coliforms decreases considerably but is still above the permissible levels (Table 6 and 7).
Fecal coliforms and gastrointestinal health problems: The number of cases with gastrointestinal problems such as gastritis, helicobacter pillory and diarrhea illness has increased 295% from 1990-2007, but there is not a significant difference (p>0.001) by gender in the number of cases with gastrointestinal diseases. In the same time period, there is a steady yearly increase in the rate per one thousand people in the number of treated cases with gastrointestinal diseases (Table 4). There is also a very strong linear relationship (r2 = 0.91), between the increase of cases with gastrointestinal disease and the increase in the area of imperviousness.
DISCUSSION
The results of this study confirm that changes in land cover due to a growing population creates a complex phenomenon that involves the increase in many measurable variables, including impervious areas, pollution and even health problems such as gastrointestinal illnesses. Land management and vegetation cover change substantially and landscape complexity increases (Ellis et al., 2005). The urban area of Arequipa city expanded from 60.56-69.13 km² in a period of 17 years, which is an average rate of 0.5 km² per year. This expansion is significant even though it is smaller than the expansion in other parts of the world such as the city of Shijiazhuang in China that expanded at an average rate of 2.4 km² (Xiao et al., 2005) or Guangzhou city, China which expanded at an average rate of 14.2 km² per year (Ma et al., 2009). However, the process is very similar to the urbanization process throughout Latin America that started in the 1940’s; by 1965, eight out of the sixteen countries of Latin America had crossed the urban threshold (50% of the total population living in cities). These countries are Argentina, Brazil, Chile, Colombia, Mexico, Peru, Uruguay and Venezuela. Urban population is highly concentrated in their main cities such as Buenos Aires,
Rio de Janeiro, Santiago, Bogota, Mexico city, Lima, Montevideo and Caracas (Valladares and Coelho, 1993). Arequipa is the second largest city in Peru, with an annual population growth rate of 1.3% (Egusquiza, 2008).
In Arequipa, the increase of the urban area has caused a decrease of 4.96 km² in the area used for agriculture and pasture and a 7.87 km² decrease in the area covered with volcanic material. There are many similar cases where agriculture and pasture land is lost to development such as in Puerto Rico where development has occurred in territories once dominated by forest and pastures because of ineffective land use planning (Martinuzzi et al., 2006); the state of Ilorin in Nigeria that had a loss of 10% of farmland while urbanized land increased in 7% between 1972-2001 (Opeyemi, 2006) and in the city of Dhaka, the capital of Bangladesh, where, using Landsat data, a study determined that agriculture land decreased by approximately 7614 ha, vegetation decreased by 2336 ha, wetlands decreased by 6385 ha and water bodies decreased by 864 ha, while urbanized areas increased by approximately 15,924 ha (Dewan and Yamaguchi, 2008). A danger in Arequipa is that part of the newly urbanized areas is located in an area that was covered with volcanic material in the section of the city that is in the direction of the active Misti volcano. The area covered by volcanic material decreased by 7.87 km². This phenomenon is due to the lack of land use planning. It can represent a danger for families living in the houses built in this area, especially houses located inside the 15 km radius of the volcano, considering that Arequipa is located in a seismically active area. Parts of the Nazca plate subducts are located under the Arequipa region. NASA and the National Geographic Society determined that at least five major volcanic eruptions have occurred in the Misti volcano (Reinhard, 2006). The last earthquake that occurred in Arequipa was in June 2001 with a Richter magnitude of 8.1. The quake extensively damaged southern Peru, particularly the Arequipa area. Other devastating earthquakes in Arequipa occurred in 1868 with a Richter magnitude of 8.5 that destroyed most of the city and reportedly, during two volcanic eruptions, one in 1440 and another in 1870. Therefore, the construction of houses in areas that are covered with volcanic material represents a risk for these families. This risk should be addressed in the city government’s urban planning, considering that if the same tendency continues in the next 10 years urban areas will increase by 4 km², mainly in the area covered by volcanic material.
the last 17 years and recently at an average rate of 2.07 % per year (from 659,244 in 1997-892,250 in 2007). Population density also increased by 18% from 1990 to 2007. If the same trends continue, then the population will increase by 7.42% and will reach over 1 million (1,012,124 people) by 2017. This population increase in Arequipa city is a result of its fast economic growth, particularly growth in mining activities that have invested $1.78 billion dollars in the last 10 years in addition to other activities such as commerce, tourism and construction. Arequipa is becoming an attractive city for migrants from rural areas where agriculture is no longer profitable and from other regions such as Puno and Cuzco. The increase of population and economic growth in Arequipa city has led to the construction of 98,721 new houses between 1990 and 2007.
Another consequence of population growth is the increase in the average daily water use by the population which increased steadily from 1990-2007. Water use has increased from 79,109.30 cubic meters per day in 1990 into 107,070.00 cubic meters per day in 2007. This represents a problem for Arequipa considering it is located in an arid region where the only source of water is the Chili River. During low flow years, urban demand is equal to 18% of the river average daily flow (1996 and 1997). This urban demand combined with competition for water from other sectors such as agriculture and industry and the need to assimilate pollution, will jeopardize sustaining future urban growth.
In Latin America, Lima is the closest example of urban growth and water shortage. Lima is located in an arid region that depends on water that drains from the Andean region through the Rimac River. In the drought of 2004, there was not enough water to cover the demand of the more of 8 million people who live in Lima. Mexico City is also facing a shortage of water resources for human consumption due to urban growth. Almost 72% of city’s water supply comes from the overexploited aquifer that lies under the metropolitan area.
In Arequipa, there is also a high probability that runoff has increased in the watershed of the Chili River as a consequence of the construction of new houses and the increase of impervious areas. Increases in runoff lead to flooding, especially during the rainy season between December and March. In 1987, the first flooding occurred in Arequipa city in the Avenue called “La Marina” and resulted in damaging the homes of 500 families. It was a consequence of the increase of imperviousness that allows greater amounts of runoff to reach the Chili River in a short time after a heavy rain.
It can also be inferred that the population and runoff increase contributes to the rising number of fecal and total coliform counts in the Chili River. A case in point is the station E7, called “Puente Uchumayo,” that collects runoff from the city and from agricultural and cattle raising land, where the permissible levels are surpassed by more than 900%. This increase in the coliform count has led to an increase in the incidence of gastrointestinal problems by 295% from 1990-2007. The most common gastrointestinal problems are gastritis caused by helicobacter pylori and diarrhea. The increase in gastrointestinal problems represents a socio-economic cost for the government, especially since health care is subsidized by the government.
CONCLUSION
This study integrates information from remote sensing, GIS and studies of environmental variables (e.g. land cover/use change, river flow, water quality, fecal and total coliform counts and the incidence of gastrointestinal illness) to understand the environmental impacts of urban growth in Arequipa city, based upon many direct and indirect influences in the environment. For example, the population increase from 659,244 in 1990 to 892,250 in 2007 (35.34%) directly affected the increase of the impervious area in the city and indirectly affected the average daily flow and water quality of the Chili River through the increase in the number of fecal and total coliform counts and the incidence of gastrointestinal problems.
In a period of 18 years (1990-2007), the urban area of Arequipa increased by 14.15%. This represents a net decrease of 1.58 km² in the area used for agriculture and pasture (agriculture decreased 4.96 km² and pasture increased 3.38 km²). Analysis of remote sensing images showed that more new houses were built in areas where volcanic material has accumulated during centuries, a consequence of many eruptions of the Misti volcano, located in the North East of the city. Open area with volcanic material cover has decreased 15.5 % (7.87 km²). Urban population density in this area also has increased from 10,885 people per km² in 1990 to 12,906 people per km² in 2007 and in the last 18 years 98,721 new houses were built.
worse if the population grows to over one million people as predicted especially considering that Arequipa is located in an arid region where the only source of water is the Chili River.
Due to the population increase and the subsequent consequences (e.g., increases in housing, the production of garbage, sewage and runoff and the decrease in river flow), the fecal and total coliform counts have increased exponentially in the Chili River. A division of the city into three areas of different population densities can help to better demonstrate the impact of population growth on water quality situation. The first area, the upper or northern part of the city where the first four sampling stations are located and the influence of population is minimal; here, the fecal and total coliform counts are under the permissible levels established by the Health Ministry of Peru. The second area is the middle and southern part of the city where the sampling stations E5: Puente Grau, E6: Puente Tingo and E7: Puente Uchumayo are located; here, the increase of total coliform counts surpasses the permissible levels in many cases by more than 900%, especially at the sampling station E7, which is located at the end of the city that collects all runoff from the city and from farms and cow barns. The third area is the area of the city where the last two stations are located. In this location, the coliform counts decrease considerably from the urban center but are still above the permissible levels. This may explain why the number of people that require medical attention for gastrointestinal problems has increased by 295% from 1990-2007 in the latter two parts of the city.
This study provides critical data that can be used by the local government of Arequipa to improve its urban planning. It can also be used by the Health Ministry of Arequipa to improve public health through monitoring of water quality as well as use of technologies to treat water. This study may also serve as a reference for other cities in the Andean region with similarly characteristics to Arequipa such as Cajamarca and Ayacucho in Peru and Quito and Cuenca in Ecuador.
ACKNOWLEDGEMENT
This research was supported by a field grant from the Graduated Students Association of Towson University and a graduate research assistantship from the Environmental Sciences Department of Towson University. Landsat imagery was provided by the Earth Resources Observation and Science Center of the US Geological Survey. The process of classification of Landsat imagery was done in the GIS Lab of the
Geography Department of Towson University under the supervision of John Morgan. I would also like to thank Kent Barnes, Harald Beck and Steven Lev for their contributions to this study. The following organizations provided valuable data sets for this study: National Institute of Statistics and Informatics- INEI of Peru, the National Superintendence of Public Registration of Arequipa Peru, the National Service of Meteorology and Climatology and the Environmental Office of the Health Ministry of Arequipa, Peru.
REFERENCES
Aguilar, A., P. Ward and C. Smith, 2003. Globalization, regional development and mega-city expansion in Latin America: Analyzing Mexico City’s peri-urban hinterland. J. Cities., 20: 3-21. DOI: 10.1016/S0264-2751(02)00092-6
Botsford, E., K. Hill and D. Booth, 2003. A rapid land cover classification method for use in urban watershed analysis. Water Resources Series. Tech. Report, 173: 1-19.
Bruna, G.C., 2000. The Sao Paulo Region. In: Global City Regions: Their Emerging Forms. Spon Press, Simmonds, R. and G. Hack (Eds.). pp: 107-119. ISBN-10: 9780419232407
Campbell, J.B., 2007. Introduction to Remote Sensing. 4th Edn., The Guilford Press, New York, ISBN: 159385319X, pp: 626.
Cohen, B., 2004. Urban growth in developing countries: A review of current trends and a caution regarding existing forecasts. World Dev., 32: 23-51. DOI: 10.1016/J.WORLDDEV.2003.04.008 Cohen, B., 2006. Urbanization in developing countries:
Current trends, future projections and key challenges for sustainability. Technol. Soc., 28: 63-80. DOI: 10.1016/J.TECHSOC.2005.10.005
Coles, J.F., T.F. Cuffney, G. McMahon and K.M. Beaulieu, 2004. The effects of urbanization on the biological, physical and chemical characteristics of coastal New England streams. United States Geological Survey, Washington, pp: 1-47.
Dewan, A. and Y. Yamaguchi, 2008. Using remote sensing and GIS to detect and monitor land use and land cover change in Dhaka Metropolitan of Bangladesh during 1960-2005. J. Earth Environ. Sci., 150: 237-249. DOI: 10.1007/s10661-008-0226-5
Eastman, J.R., 2009. IDRISI Taiga: Guide to GIS and Image Processing. Worcester, MA, USA., pp: 3-327.
Egusquiza, P., 2008. Las ciudades más pobladas del Peru.,
http://desarrolloperuano.blogspot.com/2008/08/las-ciudades-ms-pobladas-del-per.html
Ellis, E., H. Wang, H.S. Xiao, K. Pen and X.P. Liu et al., 2005. Measuring long-term ecological changes in densely populated landscapes using current and historical high resolution imagery. J. Remote Sens. Environ., 100: 457-473. DOI: 10.1016/J.RSE.2005.11.002
Fisher, P.F. and D. J. Unwin, 2005. Land use and Land cover: Contradiction or complement. In: Re-Presenting GIS, Fisher, P., A. Comber and R. Wadsworth, John Wiley and Sons, Chichester, pp: 85-98. ISBN: 0470848472
Government of Alberta, 2009. Water for Life: Action
Plan 2009. http://environment.gov.ab.ca/info/library/8236.pdf
Hansen, M., R. DeFries, J. Townshend and R. Sohlberg, 2000. Global land cover classification at 1 km resolution using tree classifier. Int. J. Remote Sens., 21: 1331-1365. DOI: 10.1080/014311600210209
Herol, M., N. Goldstein and K. Clarke, 2003. The spatiotemporal form of urban growth: measurement, analysis and modeling. J. Remote Sens. Environ., 86: 286-302. DOI: 10.1016/S0034-4257(03)00075-0
Jauregui, E., 1998. Heat island development in Mexico city. J. Atmospheric Environ., 31: 3821-3831. DOI: 10.1016/S1352-2310(97)00136-2
Kokalj, Z. and K. Ostir, 2007. Land cover mapping using Landsat satellite image classification in the classical Karst-Kras Region. Acta Carsologica., 36: 433-440.
Lopez, E., G. Bocco, M. Mendoza and E. Duhau, 2001. Predicting land-cover and land-use change in the urban fringe: A case in Morelia city, Mexico. Landscape Urban Plann., 55: 271-285. DOI: 10.1016/S0169-2046(01)00160-8
Ma, Y. and R. Xu, 2009. Remote sensing monitoring and driving forces analysis of urban expansion in Guangzhou City, China. Habitat Int., 34: 228-235. DOI: 10.1016/J.HABITATINT.2009.09.007 Martinuzzi, S., W.A. Gould and O.R. Gonzales, 2006.
Land development, land use and urban sprawl in Puerto Rico integrating remote sensing and population census data. J. Landscape Urban Plann.,
79: 288-297. DOI: 10.1016/J.LANDURBPLAN.2006.02.014
McMahon, G. and T. Cuffney, 2000. Quantifying urban intensity in drainage basins for assessing stream ecological conditions. J. Am. Water Resources Associat., 36: 1247-1261. DOI: 10.1111/J.1752-1688.2000.TB05724.X
Opeyemi, A.Z., 2006. Change detection in land use and land cover using remote sensing data and GIS: A case study of Ilorin and its environs in Kwara State-Nigeria. Thesis submitted to the University of
Ibadan, pp: 1-54. http://www.geospatialworld.net/uploads/thesis/Ope
yemiZubair_ThesisPDF.pdf
Reinhard, J., 2006. The ice maiden-Inca mummies, mountain gods and sacred sites in the Andes. 8th Edn., National Geographic, Washington, ISBN-10: 0792259122, pp: 400.
Romero, H., M. Rivera, P. Salazar and P. Azocar, 1999. Rapid urban growth, land use changes and air pollution in Santiago, Chile. Atmospheric Environ., 33: 4039-4047. DOI: 10.1016/S1352-2310(99)00145-4
Schuler, T., 1995. The importance of imperviousness. Watershed Protection Tech., 1: 100-111.
United Nations University, 1996. The mega-city in Latin America. 1st Edn., United Nations University Press, Tokyo, ISBN-10: 9280809350, pp: 282. Valladares, L. and M.P. Coelho, 1993. Urban research
in Latin America. Towards a research agenda.
Manage. Social Trans. http://www.unesco.org/most/valleng.htm
Weiskel, P., S. Brandt, L. DeSimone, L. Ostiguy and S. Archfield, 2009. Indicators of streamflow alteration, habitat fragmentation, impervious cover and water quality for Massachusets stream basins. U.S. Geological Survey. Scientific Investigation
Report 2009-5272. http://pubs.usgs.gov/sir/2009/5272/