RBRH, Porto Alegre, v. 22, e8, 2017 Scientiic/Technical Article
http://dx.doi.org/10.1590/2318-0331.011716070
Multicriteria Method in Data Envelopment Analysis: an application to measure the
performance of the instrument of charging for water in the State of Ceará basins
Método Multicritério em Análise por Envoltória de Dados: uma aplicação para medir o desempenho do instrumento da cobrança pela água nas bacias do Estado do Ceará
Marcus Vinicius Sousa Rodrigues1, Marisete Dantas de Aquino2, Antônio Clécio Fontelles Thomaz3 and
Rejane Felix Pereira4
1Universidade Federal Rural do Semi-Árido, Angicos, RN, Brazil 2Universidade Federal do Ceará, Fortaleza, CE, Brazil 3Universidade Estadual do Ceará, Fortaleza, CE, Brazil
4Universidade da Integração Internacional da Lusofonia Afro-Brasileira, Redenção, CE, Brazil
E-mails: [email protected] (MVSR), [email protected] (MDA), [email protected] (ACFT), [email protected] (RFP)
Received: May 27, 2016 - Revised: August 10, 2016 - Accepted: September 16, 2016
ABSTRACT
The water policies adopt management instruments, among which the charge for water use stands out. Because there are many factors
that can be used in an analysis of the eficiency of this management instrument in a watershed, it is necessary to use a scientiic
methodology for multi-criteria analysis. The aim of this study was to analyze the performance of charging for the use of raw water in the river basins of Ceará State in the main categories of use (industrial, supply and irrigation) using the methodology for data envelopment analysis (DEA) and the BBC model, with the help of computational tool SIAD (Integrated System for Decision Support)
to designate the most and the least eficient units in order to improve the management of these resources. In this study, the industry units stood out, shwoing an average eficiency of 57.67%, followed by the public supply with an average eficiency of 22.69% and irrigation with an average eficiency of 11.78%. The charge for the use of water in the Litoral basin, in the industrial sector, stood out as the most eficient unit of the whole study, as the least eficient unit was the basin of the Litoral, in the irrigation sector.
Keywords: Multicriteria analysis; Data envelopment analysis; Charging of the water.
RESUMO
As políticas de recursos hídricos adotam instrumentos de gerenciamento, dentre os quais se destaca a cobrança pelo uso da água.
Por existir múltiplos fatores que podem ser utilizados em uma análise da eiciência desse instrumento de gerenciamento em uma bacia hidrográica, faz-se necessário o uso de uma metodologia cientíica de análise multicritério. O objetivo deste estudo foi analisar o desempenho da cobrança pelo uso da água bruta nas bacias hidrográicas do Estado do Ceará nas principais categorias de uso
(industrial, abastecimento e irrigação) utilizando a metodologia de Análise por Envoltória de Dados (AED) e o modelo BBC, com
o auxilio da ferramenta computacional SIAD (Sistema Integrado de Apoio à Decisão) para designar as unidades mais eicientes e menos eicientes a im de aperfeiçoar a gestão desses recursos. Neste estudo, as unidades da indústria se destacaram, apresentando uma eiciência média de 57,67%, seguida pelo abastecimento público com uma eiciência média de 22,69% e a irrigação com uma eiciência média de 11,78%. A cobrança pelo uso da água da bacia do Litoral, no setor industrial, se destacou como a unidade mais eiciente de todo o conjunto estudado, já a unidade menos eiciente foi a bacia do Litoral, no setor irrigação.
INTRODUCTION
The charge for water use is provided for by law since the Decree 24643, of July 10th, 1934, known as the Water Code, which
contained in its text current concepts such as user-payer and the polluter-payer principles. However, these concepts have not been put into practice. Thus, the charging for water instrument
would only be formally established by Federal Law nº 9433, of
January 8th, 1997, popularly known as the Water Law.
It is important to note that the State of Ceará was one of the states that anticipated the Union by establishing a policy
of water resources, through the Law nº 11996 of July 24th, 1992.
This law was replaced, afterwards, by Law nº 14844 of December 28th, 2010, which disposes of the State of Ceará Policy of Water
Resources - PERH.
Among the instruments cataloged in Law nº 14844/2010, the charge for the use of raw water is highlighted. According to
Silveira, Forgiarini and Goldenfum (2009), the charge for the use of water resources still aims that this resource may be used in a rational way for its users, in order to meet the principles of the sustainable development.
Many are the factors (or criteria) that can be used to
measure the performance (or eficiency) of the implementation
of the charge for the use of water, being necessary the use of multi-criteria analysis techniques.
According to Athanassopoulos (2012), the evaluation
of eficiency can be considered as a major concern by part of
the managers and the development of tools for this analysis has expanded greatly in the recent years.
The multi-criteria analysis technique used in this research was the data envelopment analysis (DEA). According Banaeian, Omid and Ahmadi (2011), this technique can be used in a set of production units, usually called decisions making units (DMUs) in order to classify them according to their performances.
The DEA can be deined as a mathematical programming technique used to measure the performance (or eficiency) of
production units, or DMUs, which convert multiple entries, or inputs, in outputs, or outputs (MIRDEHGHAN; FUKUYAMA, 2016).
According to Adler and Yazhemsky (2010), a DMU can represent any number of organizations or departments that essentially perform the same task with the same set of variables.
The objective of this study is to select the most signiicant
factors related to the instrument of charging for water use, in order that they are used for applying the Data Envelopment Analysis
to assess the relative eficiency of the instrument of the main
categories of use (industry, supply and irrigation) of all the State of Ceará basins, obtaining in that way a general diagnosis of this
instrument eficiency.
The importance of these selected sectors is due to the fact that they together consume a total of 320 million m3, representing 98% of consumed volume, with a billing of R$ 58 million, which represent 99% of the total billed. In relation
to the grant, the three sectors together have 341 million m3 granted, representing 95% of all granted volume in the whole
state (RODRIGUES, 2014).
THE CHARGE FOR WATER USE IN THE STATE OF CEARÁ
The charge for water in the state of Ceará was accomplished by Decree nº 24264 of November 12th 1996, in which were
initially charged withdrawals of water intended to be used in the industries and in the concessionary enterprises of drinking water service. According to Rodrigues and Aquino (2014), only in 2004 this charge was applied for other use purposes, namely: industry,
public water supply, irrigation, ish farming, mineral water and
other categories.
The institution responsible for the billing and the collection
of funds from the charging is the Water Resources Management
Company of the State of Ceará (COGERH), which acts as an agency for all Ceará basins (FINKLER et al., 2015). The charge for raw water, both on the surface and underground, is based on actual consumption, with the following model:
( ) ef ef
T u = T V (1)
where T(u) is the fare paid by the user, in R$; Tef is the standard consumption rate at R$/m3; and, V
ef is the volume actually consumed
during the month by the user, in m3. According to Aquino, Gomes
and Souza Filho (2013), the tariff value and the billing criteria are updated by the state government decree.
It is currently in force the Decree nº 31195 of April 16th,
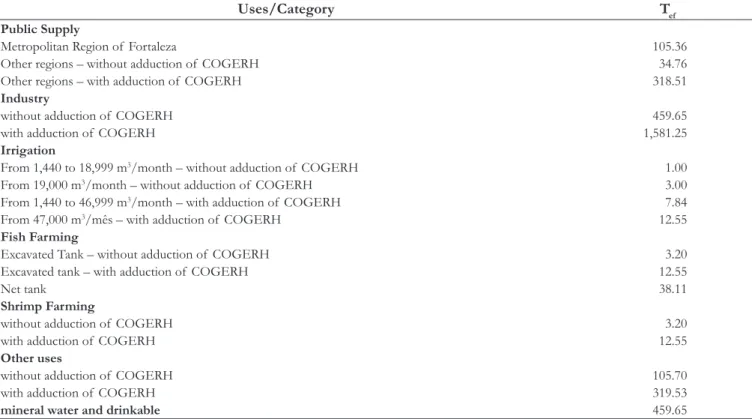
2013, which provides about the charging and establishes the tariff values of consumption to be charged in the Ceará basins. In the Table 1 the tariff are shown, Tef, for each user sector, in R$/1,000 m3.
In addition to the charge for the actual consumption of raw
water, the Law nº 14844/2010 also guides the charging for efluent
discharge into the water bodies of Ceará. However, up to now, the charging of this use category has not been accomplished yet.
It is worth to emphasize that according to the Decree
nº 31195/2013, the charge for the raw water must pass the grant of the water use rights, issued by the Water Resources State
Department - SRH (CEARÁ, 2013). It means, by law, that every user charged for the use of raw water in the state must have a grant which authorizes to carry out the extraction of water in a fountain-head.
However, according to Rodrigues (2014), it is noticed the existence of billed users, those who pay for water consumption, who do not have issued grants. Thus, this fact can be considered
as a failure or ineficiency of the management system of water
resources of the State, especially the water resources monitoring instrument.
DATA ENVELOPMENT ANALYSIS
Production can be understood as the act of transforming inputs into outputs with the help of technology (PRADHAN;
KAMBLE, 2015). Then, in a productive process the applied inputs in the production should be used as best as possible, so that there is no excess.
In this way, the productivity rate can be used to compare
the proiciency level of one production unit. Thus, the concept of eficiency is related to the comparison of productivity between
the different units, being, consequently a relative measurement. The data envelopment analysis (DEA) can be considered a non-parametric technique, since it does not require a functional relationship between the inputs and the outputs (CHERCHYE;
ROCK; WALHEER, 2016).
For Barbosa and Bastos (2014), the DEA methodology
enables to conduct an analysis of comparative eficiency for
a number of production units, demonstrating how each unit is operating in relation to other in the group, obtaining then a complete diagnosis of the whole set.
According to Qingxian, Yan and Liang (2016), the DEA by approaching this methodology, it is possible to detect the
ineficiency of resource use in a production system.
The DEA is used to build a linear border of parts, called
the eficient border, whose vertices are formed by eficient units
(PARK et al., 2015). For Alper, Sinuany-Stern and Shinar (2015),
the methodology divides the units into two groups: the eficient and ineficient one.
The construction of this boundary uses for this the input factors and the evaluated output of each unit and then provides
a measure of relative eficiency for each unit.
As stated by Rodrigues, Aquino and Thomaz (2015), “[...]
the best relations outputs/inputs are considered more eficient and are located at the eficient border, while the less eficient ones will
be located in the area below this curve, called the convex wrap”. The units evaluated in DEA are compared according
to the eficiency concept of Farrel, which is deined as the
ratio of the weighted sum of outputs and the weighted sum of inputs of each unit (DOTOLI et al., 2015). Therefore,
mathematically, the eficiency for “m” inputs and “s” outputs
is given by Equation 2 :
/
s m
i i j j i 1 j 1
Efficiency U Y V X
= =
=∑ ∑ (2)
where: Ui is the weight of the i-th output, Yi (i=1,...,s); and, Vj is the weight of the j-th input, Xj (j=1,...,m).
The eficient units, called benchmark, suit as reference for other units considered ineficient. As Gomes Júnior, Soares
de Mello and Ângulo Meza (2013) state, the DEA methodology
calculates targets to be achieved by the ineficient units in order
to make them become effective.
The units showed below the eficiency border, seen as ineficient, should be designed towards the eficient frontier, achieving in this way their eficient partner. A unit considered ineficient can reach the eficient frontier in two distinct ways:
• Through the minimization of entry (inputs), keeping constant the products (outputs), called input-oriented.
• Through the maximizing of products (outputs), keeping constant the entries (inputs), called output-oriented. According to Périco, Rebalatto and Santana (2008), an
organization’s eficiency study involves necessarily the question of the eficient border, and an organization will be closer to that
boundary when it reaches higher productivity, consuming less resources.
There are two basic models of data envelopment analysis (DEA): the CCR model, working with constant returns to scale; and the BCC model, which allows variable returns of scale, resulting
in a border formed by convex combinations of eficient units,
and being then the model used in this study.
Table 1. Rate for the use of raw water in the State of Ceará.
Uses/Category Tef
Public Supply
Metropolitan Region of Fortaleza 105.36
Other regions – without adduction of COGERH 34.76
Other regions – with adduction of COGERH 318.51
Industry
without adduction of COGERH 459.65
with adduction of COGERH 1,581.25
Irrigation
From 1,440 to 18,999 m3/month – without adduction of COGERH 1.00
From 19,000 m3/month – without adduction of COGERH 3.00
From 1,440 to 46,999 m3/month – with adduction of COGERH 7.84
From 47,000 m3/mês – with adduction of COGERH 12.55
Fish Farming
Excavated Tank – without adduction of COGERH 3.20
Excavated tank – with adduction of COGERH 12.55
Net tank 38.11
Shrimp Farming
without adduction of COGERH 3.20
with adduction of COGERH 12.55
Other uses
without adduction of COGERH 105.70
with adduction of COGERH 319.53
mineral water and drinkable 459.65
It is important to highlight that the DEA methodology began with the work published by Charnes, Cooper and Rhodes
(1978), which aimed to analyze school programs eficiency in
Texas State - USA. This model became known as CCR (initial of the authors: Charnes, Cooper and Rhodes), and it was initially developed with an orientation to input, working with continuous scales returns.
In Banker, Charnes and Cooper (1984), BCC model (initials of the authors) has been developed that admit variable returns of scales and it is the most suitable for units with inputs and outputs of many different sizes.
It is worth to remember that the assumption of continuous scales returns of the CCR model can be relaxed with the addition of a free variable, U* for guidance to input and V* to guidance to
output, as it will be seen below.
For “n” DMUs, similar with each other, using “m” inputs and “s” outputs in a BCC model with orientation to input, the weights of inputs and outputs of an object unit, DMUO, are determined by the resolution of Equation 3.
max
s
fO i iO *
i 1
E U Y U
=
=∑ + (3)
In what:
m j jO j 1
V X 1
= =
∑ (4)
( )
, , ,
s m
i ik j jk * i 1 j 1
U Y V X U 0 k 1 n
= − = + ≤ = …
∑ ∑ (5)
( , , ); ( , , );
i j *
U 0 i≥ = …1 s V ≥0 j= …1 m U ∈ (6)
Where: Efo is the relative eficiency DMUO; Yik e Xjk are the observed quantities of output i of unit k and observed input j of unit k, respectively; Ui and Vj are the weights given to the output i and the input j, respectively; and Yio and Xjo are the quantities of output i and input j of the object unit, respectively.
If the free variable U* would be positive, then, the model
shows no decreasing returns to scale (RND), while if the variable would be negative, the model shows itself with no increasing return
of scale (RNC). It is important to highlight that the eficiency is
achieved through the reduction of inputs.
In DEA modeling for the BCC model, output-oriented, is based on the Equation 7.
min
m
O j jO * j 1
h V X V
=
= ∑ + (7)
In what:
s
i iO i 1
U Y 1
= =
∑ (8)
( )
, , ,
s m
i ik j jk * i 1 j 1
U Y V X V 0 k 1 n
= − = + ≤ = …
∑ ∑ (9)
( , , ); ( , , );
i j *
U 0 i≥ = …1 s V ≥0 j= …1 m V∈ (10)
If the free variable V* would be positive, then, the model
shows no increasing returns to scale, while if the variable would be negative, the model shows itself with no decreasing return of scale.
MULTICRITERIA METHOD
Each unit chooses its own set of weights for its factors, in
order that the eficiency would be the best possible in comparison
to the other evaluated units. In this way, it is possible that a large
number of DMUs stay located at the eficient border, showing the
little discriminatory capacity of DEA classic models (PEREIRA; SILVEIRA; CHAVES, 2012).
In practice, it is recommended that the number of DMUs
analyzed should be at least ive times the number of factors
(inputs+outputs). Then, in case of impossibility to increase the number of DMUs, it should necessarily reduce the number of evaluation factors. In this way, the method multi-criteria for variable selection can applied in order to select inputs and the
most signiicant outputs for analysis.
According to Ângulo Meza et al. (2007, p. 25), “[...] the methods of variables selection should be seen as instruments to
help the decision, which will guide the inal choice.”
The stage of variables selection is justiied if there is always
a small amount of units to be evaluated and a large number of factors, such as in this case study.
In Soares de Mello et al. (2004), a model to select factors
is proposed where it is considered the best it to the border, measured by the average eficiency, as the maximum discrimination, measured by the amount of DMUs at the eficient border. This
model is called Multicriteria method of variables selection in DEA. The boundary setting is measured by the set of DMUs
average eficiency. It means that, the measurements of average eficiencies are normalized with an interpolation which assigns the
value “one” to the biggest extent and “zero” to the smaller average.
Thus, the normalized value is identiied by SEF (an abbreviation of the term standardize eficiency).
The maximum discrimination is measured by the number
of DMUs at the eficient border. Then, the standardization of
this measure gives the term SDIS (an abbreviation of the term standardize discrimination), which reaches the value “one” for the
smallest number of DMUs at the eficient border and “zero” to the biggest number of eficient DMUs.
According to Soares de Mello et al. (2004), the term S is
deined as a weighted sum of SEF and SDIS, with the restriction
that the sum of weights would be the same as the unit,
( )
S=α SEF+ −1 α SDIS (11)
In that 0 ≤ α ≤ 1.
METHODOLOGY
initial pair, forming now a set with three variables. The procedure of incorporating the factor which produces a higher value S is
followed until the number of factors does not exceed 1/5 of the
number of analyzed DMUs. If, otherwise, the procedure is closed, all factors that should be added to the model were selected.
Decision Making Units (DMU) and evaluation factors
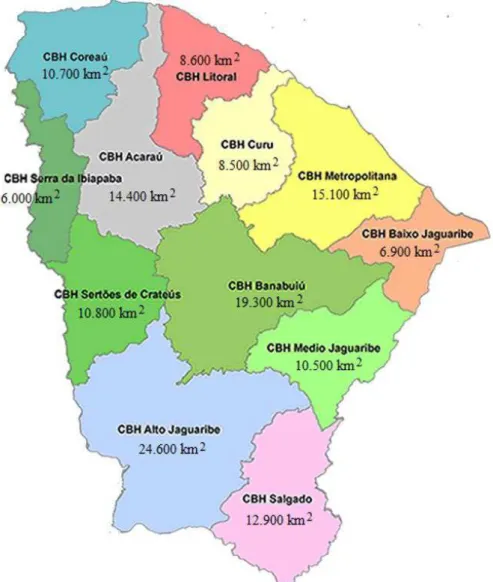
Currently, the State of Ceará is composed of 12 hydrographic basins, namely: Metropolitan Basin, Acaraú Basin, Upper Jaguaribe Basin, Middle Jaguaribe Basin, Lower jaguaribe Basin, Banabuiú Basin, Coreaú Basin, Curu Basin, Litoral Basin, Salgado Basin, Ibiapaba Mountain Basin and Sertões Crateús Basin. Figure 1 shows the location of the river basins in the State, with their respective areas.
It is important to point out that until 2011 the basins of the Sertões Crateús and Ibiapaba formed the Parnaíba Basin. However, the obtained data for these two basins were still together as the Parnaíba Basin. In this way, the survey considered the State divided into eleven (11) basins, namely: Metropolitana, Curu,
Upper Jaguaribe, Middle Jaguaribe, Lower Jaguaribe, Salgado, Litoral, Acaraú, Coreaú, Parnaíba and Banabuiú.
So, because were considered only the categories of industry, public water supply and irrigation, they are all together 33(thirty-three) analyzed DMUs in the survey, as described in Chart 1. It means, each sector of considered use of a given basin represents a DMU.
All evaluation factors (inputs and outputs) considered in this study are listed in Chart 2.
The values of the proposed evaluation factors for each
DMU were obtained from the Water Resources Management
Company of the State of Ceará (COGERH) and the Secretariat of
Water Resources of Ceará (SRH). The billing report provided by
COGERH refers to a period of 12 months (one year) beginning in May 2012 and runs until April 2013. In the meantime, the reports of issued grant, both for surface water as for groundwater, refer to the month of April 2013.
The data on water demands of the main categories of use (industrial, public supply and irrigation) and water availability by watershed were obtained at the SRH.
Figure 1. Location of river basins in the State of Ceará. CBH is the hydrographic basins committee.
Reversed border
The analyzed DMUs in this study present data with different sizes, as can be seen in Appendix A, then, they tend to have variable scales incomes. In this way, the selected method to measure the
eficiencies will be the BCC model, with guidance to the output. The DEA models often result in a large number of eficient
units. Furthermore, due to the mathematical characteristics of the BCC model, the DMUs which have the smaller value of the
inputs or a higher value of the outputs are considered as eficient, being called of falsely eficient.
Therefore, the method of the reserved border can be
applied to identify and eliminate the eficient units that present with false eficiency. The reserved border consists in consider
the outputs as inputs and the inputs as output for each unit, and subsequently it solves the BCC model of the DEA usually with an orientation to input.
According to Ângulo Mezaet al. (2007), the method of
reversed border builds a composed eficiency index, deined as the arithmetic average of eficiency in relation to the DEA
conventional border, Efconv, and the complement of eficiency in relation to the reversed border, Efinv. Based in the Equation 12,
( )
conv inv
comp Ef 1 Ef
Ef
2
+ −
= (12)
Thereafter, the normalization of the composed eficiency
is done, dividing the values of Equation 12 obtained in each
DMU for the biggest of all composed eficiency measurements. Thus, the normalized composed eficiency, indicated by Efnorm is
deined by Equation 13,
(
comp)
normcomp Ef Ef
Máx Ef
= (13)
For the perspective of the reversed border, the most eficient
unit will be one that can produce many of all their outputs and spend a little of all their inputs, not stand out in any particular. It can be stated that the objective methodology to exclude the falsely
eficient units from the group of eficient DMUs (ALMEIDA; MARIANO; REBELATTO, 2007).
It is observed that, with the application of the reversed border, it is also possible to sort the analyzed DMUs according to
the measurement value of the normalized composed eficiency.
RESULTS AND DISCUSSION
Selection of factors for evaluation of DMUs
To analyze the proposed nine factors is recommended to
evaluate at least 45 DMUs. Because only 33 DMUs were proposed,
it may be necessary to reduce the amount of factors. For this reduction, the multi-criteria method was applied in order to select the main factors to perform the analysis.
The eficiencies calculations were performed using the
computer tool SIAD (Integrated System of Decision´s Support), described in Ângulo Meza et al. (2005).
The irst stage of the multi-criteria method was the choice
of the initial pair, input/output. Seeking a rationale for this choice, we chose to select the pair that showed the biggest value of the
S term, calculated from the Equation 11, using α = 0.5, giving
the same weight to both border settings, given by the average
eficiency (SEF) as the maximum discrimination, given by the amount of eficient units (SDIS).
Chart 1. Decision Making Units evaluated in the survey.
DECISION MAKING UNITS (DMU)
Industry Public supply Irrigation
DMU1 – Metropolitana Basin DMU2 – Metropolitana Basin DMU3 – Metropolitana Basin
DMU4 – Curu Basin DMU5 – Curu Basin DMU6 – Curu Basin
DMU7 – Upper Jaguaribe Basin DMU8 – Upper Jaguaribe Basin DMU9 – Upper Jaguaribe Basin DMU10 – Middle Jaguaribe Basin DMU11 – Middle Jaguaribe Basin DMU12 – Middle Jaguaribe Basin DMU13 – Lower Jaguaribe Basin DMU14 – Lower Jaguaribe Basin DMU15 – Lower Jaguaribe Basin
DMU16 – Salgado Basin DMU17 – Salgado Basin DMU18 – Salgado Basin
DMU19 – Litoral Basin DMU20 – Litoral Basin DMU21 – Litoral Basin
DMU22 – Acaraú Basin DMU23 – Acaraú Basin DMU24 – Acaraú Basin
DMU25 – Coreaú Basin DMU26 – Coreaú Basin DMU27 – Coreaú Basin
DMU28 – Parnaiba Basin DMU29 – Parnaiba Basin DMU30 – Parnaiba Basin
DMU31 – Banabuiú Basin DMU32 – Banabuiú Basin DMU33 – Banabuiú Basin
Source: Authors.
Chart 2. Proposed evaluation factors.
Inputs Outputs
• Total number of registered users (NTC);
• Number of billed users (NUF); • Number of users granted from
the billed (NUO);
• total consumed volume during the period in m3/year, (VCT); • total granted volume per year in
m3/ year, (VOT);
• Annual water demand in m3/ year, (DEH);
• Annual water availability in m3/year, (DIH).
• Total billed charge during the period in R$/year, (CFT); • Total collected charge during the
period, in R$/year, (CAT).
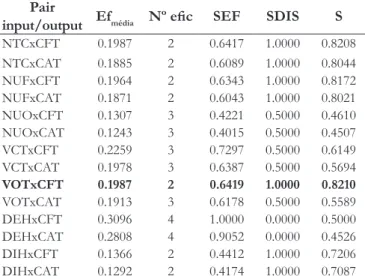
In this stage, the DEA program (BCC model with orientation to the output) was executed for each pair input/output, determining
the eficiency of the analyzed DMUs. Then, as there are seven
inputs and two outputs, were got a total of 14 combinations, listed in Table 2, with the respective values of average eficiency, indicated Efmédia, the number of eficient units, indicated by Nº eic, and the terms SEF SDIS and S.
According to Table 2, it can be seen that the pair formed by the input VOT and CFT output showed the biggest value for the term S, equivalent to 0.8210. This pair showed an average
eficiency for the whole analyzed set considered equivalent to 19.87%, with two considered effective DMUs.
With the initial pair chosen, the next step of the multi-criteria
method was to add another factor to the model, input or output, and then the DEA program was executed, calculating then the
eficiency of the entire set of DMUs, as available in Table 3, which presents the data for all possible combinations of the second stage of the multi-criteria method.
It is added to the model NUO input factor. Thus, the model now has two inputs, NUO and VOT, and one output, CFT.
This combination had an average eficiency of the entire DMUs set equivalent to 21.08%, with three eficient units. Because the
amount of factors, three in total, is lower than one ifth of the
amount of DMUs, another factor must be added.
Continuing the multi-criteria method procedure, one more factor is added to NUOxCFTxVOT set, running, then the program that had the biggest value for the S term, equivalent to 0.7884 for the NUOxCFTxVOTxCAT combination with an
average eficiency of the set of DMUs equal to 21.76% and four units considered eficient.
As the amount of template factors, altogether four, is less
than one ifth of the number of evaluated units, the procedure
continues. Adding one more factor to the evaluation model and
afterwards calculating the average eficiencies of each simulation,
we obtain that the NUF input factor can be added to the evaluation
model. In this way, the model is now composed of ive factors,
three inputs, NUF, NUO and VOT, and two outputs, CFT and CAT. It is possible to observe that this combination showed an
average eficiency for the analyzed DMUs set equivalent to 30.71%, with ive DMUs present on the eficient border.
As the amount of model factors, remains less than one
ifth of the number of analyzed units, the procedure continues.
Therefore, adding one more input factor to the evaluation model
and after that calculating the average eficiencies of each simulation,
it is observed that the NTC input factor can be added to the evaluation model. So, the model is now composed of six factors, four inputs, NTC, NUF, NUO and VOT, and two outputs, CFT and
CAT. This combination had an average eficiency for the DMUs set equivalent to 30.71% and ive DMUs considered effective.
The amount of model factors, NTCxNUFx
NUOxVOTxCFTxCAT, is less than the one ifth of the number
of DMUs from the analyzed set. However, if one more factor would be adde that model would have seven factors, which is
higher than one ifth of the number of DMUs set. Thus, it was decided to inalize the selection process of variables for the model
at this stage. Then, in Chart 3 is shown the inal model for the evaluation of DMUs in this study.
Calculation of eficiencies of DMUs
Using the BCC model of the DEA, with an orientation to
the output, it is possible to calculate the eficiency measurement
for each DMU considering the set of selected factors. So, Table 4
shows the obtained values to measures of the relative eficiency
of each analyzed unit.
Table 2. First stage of the multi-criteria method.
Pair
input/output Efmédia Nº eic SEF SDIS S
NTCxCFT 0.1987 2 0.6417 1.0000 0.8208
NTCxCAT 0.1885 2 0.6089 1.0000 0.8044
NUFxCFT 0.1964 2 0.6343 1.0000 0.8172
NUFxCAT 0.1871 2 0.6043 1.0000 0.8021
NUOxCFT 0.1307 3 0.4221 0.5000 0.4610
NUOxCAT 0.1243 3 0.4015 0.5000 0.4507
VCTxCFT 0.2259 3 0.7297 0.5000 0.6149
VCTxCAT 0.1978 3 0.6387 0.5000 0.5694
VOTxCFT 0.1987 2 0.6419 1.0000 0.8210
VOTxCAT 0.1913 3 0.6178 0.5000 0.5589
DEHxCFT 0.3096 4 1.0000 0.0000 0.5000
DEHxCAT 0.2808 4 0.9052 0.0000 0.4526
DIHxCFT 0.1366 2 0.4412 1.0000 0.7206
DIHxCAT 0.1292 2 0.4174 1.0000 0.7087
Efmédia the a average efiiency; Nº eic the a number of efiient units; SEF is the
standardize efiiency; SDIS is the standardize discrimination; S is the weighted
sum of SEF and SDIS. Source: Authors.
Table 3. Second stage of the multi-criteria method.
(VOTxCFT)x Efmédia Nº eic SEF SDIS S
NTC 0.2643 5 0.7097 0.3333 0.5215
NUF 0.2996 5 0.8043 0.3333 0.5688
NUO 0.2108 3 0.5661 1.0000 0.7831
VCT 0.3223 5 0.8654 0.3333 0.5993
DEH 0.3624 6 1.0000 0.0000 0.5000
DIH 0.2890 5 0.7760 0.3333 0.5547 CAT 0.2054 3 0.5514 1.0000 0.7757
Efmédia the a average efiiency; Nº eic the a number of efiient units; SEF is the
standardize efiiency; SDIS is the standardize discrimination; S is the weighted
sum of SEF and SDIS. Source: Authors.
Chart 3. Selected factors for the evaluation of DMUs.
Inputs Output
• Total number of registered users (NTC);
• Number of billed users (NUF); • Number of users granted from
the billed (NUO);
• Total consumed volume during the period in m3/ year, (VCT); • total granted volume per year in
m3/year (VOT);
• Total billed charge during the period in R$/year, (CFT); • Total collected charge during
the period, in R$/year, (CAT).
The DEA-BCC model applied provided ive units considered eficient, while the remaining 28 are considered ineficient. In that way, the eficient units (benchmarks) are as follow:
• DMU1, which represents the industry´s charge of the Metropolitana basin;
• DMU2, which represents the charge of the public supply of the Metropolitana basin;
• DMU10, which represents the industry´s charge of the Middle Jaguaribe basin;
• DMU19, which represents the industry´s charge of the
Litoral basin;
• DMU25, which represents the industry´s charge of the
Coreaú basin.
From the ive eficient DMUs, four are from the industry
sector, while one represents the charge for water in the supply
sector. We still highlight the DMU31 unit, which represents the industry´s charge of the Banabuiú basin, with an eficiency measurement equivalent to 0.9999 (99.99%), being considered almost eficient.
The units DMU24, irrigation charge of the Acaraú basin, and DMU2, irrigation charge of the Litoral basin, are the most
ineficient units of the group (getting the last two positions), with eficiency measurements equivalent to 0.0022 (0.22%) and 0.0013 (0.13%), respectively.
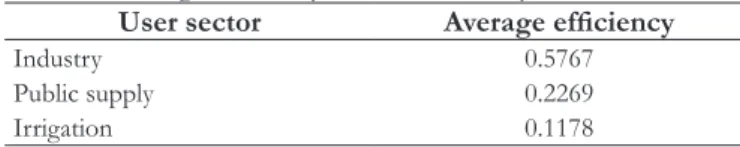
In a general context of all State basins, the units representing the water charge in the industry sector had better performances than other sectors of supply and irrigation. In other words, the
DMUs of the industry had the highest eficiency measurements
of the whole group. In Table 5 the measurements of the average
eficiency of each user sector are shown.
Thus, the charge for water industry had the highest average
eficiency, followed by the charge of public supply and the last the
charge of irrigation. A more detailed study may reveal if there is
any particular feature that justiies this.
It is possible to observe, through the Appendix A, the units of industry and supply had the highest billed values (CFT) and raised (CAT) values with the charge for water in the considered
period, while irrigation units had much lower values for the billing and the raising.
Thus, as the DEA-BCC model was oriented to the output, then the values of the CFT and CAT factors are quite relevant
for the calculation of the eficiency measurements of the group.
The industry and public supply units have average values for outputs, CFT and CAT, similar. So, what makes the industrial
units most eficient than the supply units are small input values,
in particular the VOT (granted volume by sector).
The industry showed an average of 5.3 million m3 granted for the period, while the supply had 30.9 million per m3. It means
the industry with less granted volume billed and consequently, collected values equivalents to the supply, with the charge for water.
But the irrigation sector had an average granted volume
equal to 5.3 million m3, similar to the industry, however the billing and the collection was somewhere around 3 to 4% of the
industry sector.
As an observed result, we notice that industry units
achieved eficiency measurements higher than the units of the
other sectors. It means, with high values for CFT and CAT outputs, while presenting lower values for VOT input, the industry DMUs showed better performance than the others.
It is important to stand out that the rates charged in the industry sector are higher than the rates of other sectors considered in the research. This fact can be considered very relevant to the obtained result, because the considered outputs (CFT and CAT) depend directly or indirectly on the amount of fees charged by water.
The DEA-BCC model also suggests goals to be achieved
in the factors of each ineficient DMU, so that it reaches 100% of eficiency, and the lower the value of the eficiency measurement,
the bigger are suggested adjustments.
That way, the inputs (NTC, NUF, NUO and VOT) are minimized, while outputs (CFT and CAT) are maximized. So, further suggested adjustments by the model were observed in the output factors, since a model with guidance to the output was chosen. It is worth to mention that the DEA methodology only suggests adjustments to be made in the factors of each DMU, however, nothing can be said if these adjustments can actually be put into practice.
In general, it can be said that the best performances were achieved by the DMUs that had bigger values for the outputs, CFT and CAT, and smaller values for the inputs, especially the VOT input.
Can not forget still to emphasize the fact that the units of the Metropolitana basin industry and the public supply, respectively
DMU1 and DMU2, performed eficient, especially due to the fact
that they present the highest values for CFT and CAT.
Statistically, it can be considered that the obtained data from CFT and CAT factors for DMU1 DMU2 units, when compared
Table 4. Measures of relative eficiency for each UMD of the
analyzed set.
DMU Efconv DMU Efconv DMU Efconv
DMU1 1.0000 DMU12 0.3260 DMU23 0.1570
DMU2 1.0000 DMU13 0.2245 DMU24 0.0022
DMU3 0.0771 DMU14 0.0852 DMU25 1.0000
DMU4 0.2506 DMU15 0.0181 DMU26 0.1095
DMU5 0.0864 DMU16 0.2837 DMU27 0.8336
DMU6 0.0071 DMU17 0.1834 DMU28 0.1614
DMU7 0.0381 DMU18 0.0102 DMU29 0.1980
DMU8 0.0416 DMU19 1.0000 DMU30 0.0056
DMU9 0.0070 DMU20 0.1864 DMU31 0.9999
DMU10 1.0000 DMU21 0.0013 DMU32 0.1285
DMU11 0.3195 DMU22 0.3855 DMU33 0.0072
EFconv is the the arithmetic average of efiiency in relation to the DEA
conventional border. Source: Authors.
Table 5. Average eficiency measurements by user sector. User sector Average eficiency
Industry 0.5767
Public supply 0.2269
Irrigation 0.1178
with the data of the other units are outliers. In that way, it is likely
that the removal of these two units do not change signiicantly
the overall result obtained in the research.
Following this, it will be applied the reversed border
methodology to identify, among the ive eficient DMUs, those which have a false eficiency.
Application of the reversed border
In the reversed border methodology, the inputs and outputs are reversed, and then we apply the DEA-BCC model with an orientation to the input. Shortly, in Table 6, data are presented to
determine the normalized composed eficiency, indicated by Efnorm,
beyond the position of each DMU, according to the measurement. According to the data in Table 6, the most eficient unit is
the DMU19, which represents the charge of the industrial sector
in the Litoral basin. The DMU unit, which represents the charge
of the industrial sector of the middle Jaguaribe basin, and UMD25
unit, which represents the charge of the industrial sector of the
Coreaú basin, they remain in the irst positions of the ranking,
occupying the 2nd and 3rd place, respectively.
The reversed border method also identiied the units
DMU1, charge of the industrial sector in the Metropolitana basin and DMU2, charge of public supply in the Metropolitana basin
as having false eficiencies. The DMU1 and DMU2 started to
occupy respectively the 16th and 17th position.
Conirming the result obtained previously, the charges from
the irrigation sector in the Acaraú basin, DMU24, and Litoral, DMU21, occupied the penultimate (32nd) and the last position (33th) of the evaluated group.
In general, it is possible to see that the units representing the instrument charging of industry sector occupy the top ranking positions, while the units representing the charging of the irrigation sector occupy the last positions.
CONCLUSIONS
The use of DEA for the charge for water reached the goal which was to obtain a diagnosis of all state watersheds, while the reversed border method ordered all analyzed DMUs.
It is important to detach that for the accomplishment of
this evaluation the most signiicant factors were selected through
the multi-criteria method. From the nine proposed factors for the evaluation, only six were selected through multi-criteria method, being four inputs (NTC, NUF, NUO and VOT) and two outpus (CFT and CAT).
Thereafter, the initial analysis indicated that from the
33 evaluated units, ive are classiied as eficient, being four from
the industry and one from the public supply, and 28 were rated
as ineficient.
The reversed border methodology showed that the charge
of the industrial sector of the Litoral basin, DMU19, performed with excellent performance, the most eficient unit of the analyzed
group.
The charge of the industry sector had the best performance
in comparison to the other categories, with an average eficiency of 57.67%, followed by supply, with the measurement of an average eficiency of 22.69%, while the charge of irrigation proved with an average eficiency equal to 11.78%, with the worst performance.
Altogether, the overview found in this study was also
conirmed in the works of Rodrigues (2014) and Rodrigues,
Aquino and Thomaz (2015). The units related to the charge of the industrial sector in the water basins of the State of Ceará proved with better results than the others, while irrigation obtained the worst results.
The charge of water is a vital management tool to ensure the balance between the offer and the demand for water in the river basins. Thus, the DEA can be applied to assist managers in evaluating this balance, so that we can have a rational use of water and that all users have been assured of their rights to access this resource.
It is possible to observe that the rates charged for the use of raw water in a particular use sector, excluding the Metropolitan Region of Fortaleza, can be considered constant in all Ceará basins. Therefore, the DEA can be used to help studies aiming to analyze
Table 6. Eficiency Measurement of the analyzed units. DMU Efconv Efinv Efcomp Efnorm Position
DMU1 1.0000 1.0000 0.5000 0.5002 16ª
DMU2 1.0000 1.0000 0.5000 0.5002 17ª
DMU3 0.0771 0.0810 0.4980 0.4983 18ª
DMU4 0.2506 0.1768 0.5369 0.5371 12ª
DMU5 0.0864 0.0771 0.5046 0.5049 15ª
DMU6 0.0071 1.0000 0.0035 0.0035 30ª
DMU7 0.0381 0.8204 0.1088 0.1089 26ª
DMU8 0.0416 1.0000 0.0208 0.0208 27ª
DMU9 0.0070 1.0000 0.0035 0.0035 31ª
DMU10 1.0000 0.0280 0.9860 0.9864 2ª
DMU11 0.3195 0.0153 0.6521 0.6524 6ª
DMU12 0.3260 0.0388 0.6436 0.6439 7ª
DMU13 0.2245 0.4603 0.3821 0.3823 22ª
DMU14 0.0852 0.0942 0.4955 0.4957 19ª
DMU15 0.0181 0.4101 0.3040 0.3041 23ª
DMU16 0.2837 1.0000 0.1418 0.1419 25ª
DMU17 0.1834 0.0878 0.5478 0.5481 11ª
DMU18 0.0102 1.0000 0.0051 0.0051 28ª
DMU19 1.0000 0.0009 0.9995 1.0000 1ª
DMU20 0.1864 0.0123 0.5870 0.5873 8ª
DMU21 0.0013 1.0000 0.0007 0.0007 33ª
DMU22 0.3855 0.0528 0.6664 0.6667 5ª
DMU23 0.1570 0.1764 0.4903 0.4905 20ª
DMU24 0.0022 1.0000 0.0011 0.0011 32ª
DMU25 1.0000 0.0977 0.9511 0.9516 3ª
DMU26 0.1095 0.0687 0.5204 0.5206 14ª
DMU27 0.8336 1.0000 0.4168 0.4170 21ª
DMU28 0.1614 0.0544 0.5535 0.5537 10ª
DMU29 0.1980 0.0259 0.5860 0.5863 9ª
DMU30 0.0056 0.7177 0.1439 0.1440 24ª
DMU31 0.9999 0.1458 0.9270 0.9274 4ª
DMU32 0.1285 0.0631 0.5327 0.5330 13ª
DMU33 0.0072 1.0000 0.0036 0.0036 29ª
Efconv is the arithmetic average of efiiency in relation to the DEA conventional
border; Efinv is the complement of efiiency in relation to the reversed border;
Efcomp is the composed efiiency index; Efnorm is the normalization of the
composed efiiency.
the implementation of a possible distinction of rates, considering the peculiarities of each basin of the state.
Finally, as the research used data for a period of 12 months, the mentioned study has restrictions. Thus, to obtain a wider diagnosis it is recommended that you use the data related to a longer period of time.
REFERENCES
ADLER, N.; YAZHEMSKY, E. Improving discrimination in data envelopment analysis: PCA-DEA or variable reduction. European Journal of Operational Research, v. 202, n. 1, p. 273-284, 2010. http://
dx.doi.org/10.1016/j.ejor.2009.03.050.
ALMEIDA, M. R.; MARIANO, E. B.; REBELATTO, D. A.
N. Análise de eficiência dos aeroportos internacionais. Revista Produção Online, v. 7, p. 1-17, 2007. Disponível em: <https://
producaoonline.-org.br/rpo/article/view/51/51>. Acesso em:
4 mar. 2016.
ALPER, D.; SINUANY-STERN, Z.; SHINAR, D. Evaluating the efficiency of local municipalities in providing traffic safety using data envelopment analysis. Accident; Analysis and Prevention, v. 78,
p. 39-50, 2015. PMid:25744172. http://dx.doi.org/10.1016/j.
aap.2015.02.014.
ÂNGULO MEZA, L.; BIODINI NETO, L.; SOARES DE MELLO, J. C. C. B.; GOMES, E. G. Sistema ISYDS – Integrated System for Decision Support (SIAD – Sistema Integrado de Apoio à Decisão): a software package for data envelopment analysis model. Pesquisa Operacional, v. 25, n. 3, p. 493-503, 2005.
ÂNGULO MEZA, L.; SOARES DE MELLO, J. C. C. B.; GOMES, E. G.; FERNANDES, A. J. S. Selecção de variáveis em DEA
aplicada a uma análise do mercado de energia eléctrica. Investigação Operacional, v. 27, n. 1, p. 21-36, 2007.
AQUINO, T. S. A.; GOMES, C. C.; SOUZA FILHO, F. A. Impacto da recuperação do investimento em infraestrutura hídrica na cobrança pelo uso da água. Revista Brasileira de Recursos Hídricos, v. 18, n. 1, p. 87-98, 2013. http://dx.doi.org/10.21168/
rbrh.v18n1.p87-98.
ATHANASSOPOULOS, A. D. Discriminating among relatively efficient units in data envelopment analysis: A comparison of alternative methods and some extensions. American Journal of Operations Research, v. 2, n. 1, p. 1-9, 2012.
BANAEIAN, N.; OMID, M.; AHMADI, H. Application of data envelopment analysis to evaluate efficiency of commercial greenhouse strawberry. Research Journal of Applied Sciences Engineering and Technology, v. 3, n. 3, p. 185-193, 2011.
BANKER, R. D.; CHARNES, A.; COOPER, W. W. Some models for estimating technical and scale inefficiencies in data envelopment analysis. Management Science, v. 30, n. 9, p. 1078-1092, 1984.
BARBOSA, R. P.; BASTOS, A. P. V. Utilização da análise por
envoltória de dados (DEA) na mensuração da eficiência das
prestadoras de serviços de água e esgotamento sanitário: Um enfoque no desempenho da companhia de saneamento do estado do Pará. Revista Economia & Gestão, v. 14, n. 35, p. 151-181, 2014.
CEARÁ. Decreto nº 31.195, de 16 de abril de 2013. Diário Oficial do Estado, Fortaleza, CE, 18 abr. 2013. Disponível em: <http:// www.srh.ce.gov.br/index.php?option=com_phocadownload&vi
ew=category&id=159:decretos&Itemid=301&tmpl=componen t&print=1>. Acesso em: 18 mar. 2016.
CHARNES, A.; COOPER, W. W.; RHODES, E. Measuring the efficiency of decision making units. European Journal of Operational Research, v. 2, n. 6, p. 429-444, 1978.
CHERCHYE, L.; ROCK, B.; WALHEER, B. Multi-output profit efficiency and directional distance functions. Omega, v. 61, p.
100-109, 2016.
DOTOLI, M.; EPICOCO, N.; FALAGARIO, M.; SCIANCALEPORE, F. A cross-efficiency fuzzy data envelopment analysis technique for performance evaluation of decision making units under uncertainty. Computers & Industrial Engineering, v. 79, p. 103-114, 2015.
FINKLER, N. R.; MENDES, L. A.; BORTOLIN, T. A.; SCHNEIDER, V. E. Cobrança pelo uso da água no Brasil: Uma revisão metodológica. Desenvolvimento e Meio Ambiente, v. 33, p.
33-49, 2015.
GOMES JÚNIOR, S. F.; SOARES DE MELLO, J. C. C. B.; ÂNGULO MEZA, L. DEA nonradial efficiency based on vector properties. International Transactions in Operational Research, v. 20, p. 341-364, 2013.
HONGLAN, L.; RUYUN, Y.; XIAONA, Q. Productivity analysis and benchmark selection of X mining company by DEA. Journal of Chemical and Pharmaceutical Research, v. 6, n. 4, p. 162-168, 2014.
MIRDEHGHAN, S. M.; FUKUYAMA, H. Pareto-Koopmans efficiency and network DEA. Omega, v. 61, p. 78-88, 2016.
PARK, J.; YOO, S. K.; LEE, J. S.; KIM, J.; KIM, J. J. Comparing the efficiency and productivity of construction firms in China, Japan and Korea using DEA and DEA based malmquist. Journal of Asian Architectures and Building Engineering, v. 14, n. 1, p. 57-64, 2015.
PEREIRA, E. R.; SILVEIRA, J. Q.; CHAVES, M. C. C. Eficiência
de empresas aéreas: Uma análise baseada no modelo de Li &
Reeves. Journal of Transport Literature, v. 6, n. 2, p. 105-123, 2012.
PÉRICO, A. E.; REBALATTO, D. A. N.; SANTANA, N. B.
Eficiência bancária: Os maiores bancos são os mais eficientes?
Uma análise por envoltória de dados. Revista Gestão & Produção,
v. 15, n. 2, p. 412-431, 2008.
to select multi brand retail firms in India. Journal of Commerce & Management Thought, v. 6, n. 2, p. 258-272, 2015.
QINGXIAN, A.; YAN, H.; LIANG, L. Internal resource waste and centralization degree in two-stage systems: an efficiency analysis. Omega, v. 61, p. 89-99, 2016. http://dx.doi.org/10.1016/j.
omega.2015.07.009.
RODRIGUES, M. V. S. Avaliação do desempenho da cobrança da água bruta por categoria de uso nas bacias do Estado do Ceará utilizando a análise por envoltória de dados. 2014. 174 f. Tese (Doutorado em Engenharia Civil) – Centro de Tecnologia, Universidade Federal do Ceará, Fortaleza, 2014.
RODRIGUES, M. V. S.; AQUINO, M. D. Análise comparativa entre a cobrança pelo uso da água bruta do Estado do Ceará com a cobrança aplicada no Estado de São Paulo. Revista de Gestão de Águas da América Latina, v. 11, n. 2, p. 37-51, 2014.
RODRIGUES, M. V. S.; AQUINO, M. D.; THOMAZ, A. C. F. Análise por envoltória de dados utilizada para medir o desempenho relativo da cobrança pelo uso da água nas bacias hidrográficas do estado do Ceará. Revista de Gestão de Águas da América Latina, v. 12,
n. 1, p. 15-29, 2015.
SILVEIRA, G. L.; FORGIARINI, F. R.; GOLDENFUM, J. A.
Taxa não é cobrança: Uma proposta para a efetiva aplicação do
instrumento de gestão dos recursos hídricos para a drenagem urbana. Revista Brasileira de Recursos Hídricos, v. 14, n. 4, p. 71-80, 2009.
SOARES DE MELLO, J. C. C. B.; GOMES, E. G.; ÂNGULO MEZA, L.; LINS, M. P. E. Selección de variables para el incremento del poder de discriminación de los modelos DEA. Revista de la Escuela de Perfeccionamiento En Investigación Operativa, v. 24, p. 40-52, 2004.
Authors contributions
Marcus Vinicius Sousa Rodrigues: Contributed bibliographical research, data analysis, processing and simulations, writing.
Marisete Dantas de Aquino: Contributes with her orientation, indications of bibliographical references and analysis of the results related to the hydrographic basins.
Antônio Clécio Fontelles Thomaz: Contributed to his co-orientation,
indications of bibliographical references, and analysis of the results of the wrappings.
Appendix A. Data factors of each decision making unit.
DMU NTC NUF NUO VCT (m3/year)
VOT (m3/ year)
DEH (m3/ year)
DIH (m3/ year)
CFT (R$/ year)
CAT (R$/ year) DMU1 188 121 63 21,201,494.13 55,789,465.63 7.99 20.62 29,866,171.45 29,325,593.75
DMU2 103 42 29 281,970,523.29 168,885,538.17 7.48 20.62 28,223,806.33 27,712,955.44
DMU3 90 48 6 17,302,943.33 3,875,277.43 0.74 20.62 175,603.94 172,425.51
DMU4 40 40 7 156,165.73 17,395.90 0.23 11.82 67,395.03 46,799.11
DMU5 30 14 13 9,038,515.89 8,400,609.74 0.31 11.82 296,192.18 205,675.85
DMU6 159 25 11 22,654,909.29 20,837,779.08 2.63 11.82 44,633.69 30,993.63
DMU7 24 19 9 25,577.26 56,272.05 0.11 21.74 11,038.14 6,168.11
DMU8 77 21 20 15,021,544.23 66,858,257.97 0.35 21.74 492,255.98 275,072.64
DMU9 75 25 10 2,655,018.85 2,242,953.73 0.45 21.74 10,248.18 5,726.68
DMU10 28 26 0 640,746.23 0.00 0.05 31.88 276,520.40 172,825.25
DMU11 48 17 7 13,583,183.74 2,160,509.40 0.13 31.88 445,120.96 278,200.60
DMU12 107 73 4 149,909,007.51 9,281,166.47 4.90 31.88 889,856.13 556,160.08
DMU13 103 87 22 149,486.77 29,064.50 0.21 1.55 64,512.40 43,010.42
DMU14 38 7 6 5,226,680.00 7,878,171.11 0.23 1.55 171,278.31 114,191.25
DMU15 155 12 5 21,055,233.12 5,285,521.51 1.72 1.55 43,252.74 28,836.60
DMU16 76 60 46 583,954.33 1,153,575.20 0.15 6.44 252,011.30 172,753.75
DMU17 86 32 21 48,047,543.68 22,256,012.08 0.85 6.44 1,574,518.07 1,079,332.14
DMU18 213 12 4 8,932,232.08 2,642,256.49 2.53 6.44 16,618.23 11,391.80
DMU19 8 3 1 205,910.00 150,211.53 0.15 1.15 302,187.35 293,031.07
DMU20 22 6 3 6,545,175.87 2,369,032.50 0.20 1.15 214,485.37 207,986.46
DMU21 15 3 2 513,646.44 218,111.74 0.02 1.15 410.28 397.85
DMU22 58 53 9 681,287.10 919,434.50 0.06 12.39 294,611.26 248,092.14
DMU23 71 35 11 39,020,086.73 37,092,185.73 1.10 12.39 1,278,688.19 1,076,783.33
DMU24 19 10 2 934,976.11 477,057.71 6.21 12.39 1,095.52 922.54
DMU25 15 12 0 75,389.47 0.00 0.02 3.22 32,535.06 14,458.58
DMU26 15 6 5 4,283,941.04 3,459,543.00 0.50 3.22 140,384.72 62,386.97
DMU27 4 1 1 49,027.00 2,075,700.63 0.09 3.22 23.83 10.59
DMU28 14 13 1 89,622.00 96,177.50 0.01 6.94 38,677.26 37,961.73
DMU29 27 11 6 16,190,356.62 7,029,251.10 0.52 6.94 530,558.01 520,742.69
DMU30 61 26 8 9,567,450.32 5,202,867.89 0.00 6.94 16,582.35 16,275.58
DMU31 16 11 0 25,305.22 0.00 0.23 21.66 10,920.71 8,008.16
DMU32 89 13 12 15,052,458.03 13,410,396.71 0.32 21.66 493,269.09 361,714.22