Molecules 2011, 16, 5374-5386; doi:10.3390/molecules16075374
molecules
ISSN 1420-3049 www.mdpi.com/journal/molecules ArticleStudy of Organic Honey from the Northeast of Portugal
Teresa Gomes 1, Xesús Feás 2, Antonio Iglesias 3 and Leticia M. Estevinho 1,*
1
CIMO-Mountain Research Center, Agricultural College of Bragança, Polytechnic Institute of Bragança, Campus Santa Apolónia, E 5301-855, Bragança, Portugal;
E-Mail: [email protected] (T.G.) 2
Department of Analytical Chemistry, Nutrition and Bromatology, University of Santiago de Compostela, E-27002, Lugo, Galicia, Spain; E-Mail: [email protected] (X.F.)
3
Department of Anatomy and Animal Production, Faculty of Veterinary Medicine, University of Santiago de Compostela, E-27002, Lugo, Galicia, Spain; E-Mail: [email protected] (A.I.)
* Author to whom correspondence should be addressed; E-Mail: [email protected]; Tel.: +351-273-303342; Fax: +351-273-325405.
Received: 25 May 2011; in revised form: 17 June 2011 / Accepted: 20 June 2011 / Published: 27 June 2011
Abstract: Concerns about traces of numerous toxic substances and authenticity have prompted consumer demand for honey that is certified as organic, based on strict ecological, natural principles and traceability. The present study aims to characterize organic honey samples (n = 73) from Northeast Portugal, with respect to floral nectar origin, physicochemical parameters and microbial safety. The phenols and flavonoids contents, often referred to as responsible for honey’s bioactive properties, were also assessed. All organic honey samples were classified as monofloral lavender (Lavandula sp.), exceeded in quality the international physicochemical standards and showed low microbiological counts (yeast, moulds and aerobic mesophiles), with negative results in respect to fecal coliforms, Salmonella and sulphite-reducing Clostridium spp. Correlation of the palynological, physicochemical and microbiological results is necessary to check the authenticity, quality and sanitation of honey. Although not required by international legislation, results of those assessments provide a complete outlook and elucidation of the organic honey’s properties, which could promote its valorisation.
Molecules 2011, 16 5375
Keywords: honey; lavender; organic foods; physicochemical properties; microbiology; phenolic compounds
1. Introduction
Honey is the natural sweet substance produced by honeybees from the nectar of blossoms or from the secretion of living parts of plants or excretions of plant sucking insects on the living parts of plants, which honeybees collect, transform and combine with specific substances of their own, store and leave in the honey comb to ripen and mature [1].
The beneficial characteristics of honey are its high nutritional value and the fast absorption of its carbohydrates on consumption [2,3]. Moreover, when analyzing and studying the therapeutic properties of honeys, modern science has made it possible to specify their medical significance for healing wounds and burns [4], oncology care [5], as well as its antioxidant and antimicrobial factors [6-8].
Today, having survived all kinds of climatic changes, bees are threatened, and therefore global food security, if pollinators, mainly honeybee, decline or disappear [9]. The cause of the problem is still unknown, which is why it is being described as Colony Collapse Disorder (CCD) and researchers suspect this may be due to a combination of various diseases, environmental pollution, and farming practices, mainly due to an abusive use of increasingly toxic phytosanitary products and large monoculture cropping [10].
In any case, concerns about traces of numerous toxic substances have prompted some consumers to demand honey that is certified as organic [11]. Organic honey production is an ecologically based system, which encourages the use of good agricultural practices to maintain the agricultural ecosystem balance and diversity, promoting the sustainable use of natural resources, environmental quality, animal welfare and human health [12]. Research results indicate that the botanic origin of honey, different beehive types, and the material beehives are made of, all have an influence on the development of bee diseases and the quality of honey [13].
The progressive increase in the market of imported honey, with lower prices and inferior quality, has recently led to a growing need to assess authenticity of local, specially monofloral honeys, using a full quality control based on a physicochemical, microbiological and geographical description [14-19].
However the data on full characterization of honey is not abundant and there is a lack of information about the characteristics of honey certified as organic [20].
Molecules 2011, 16 5376
2. Results and Discussion
2.1. Pollen Analysis
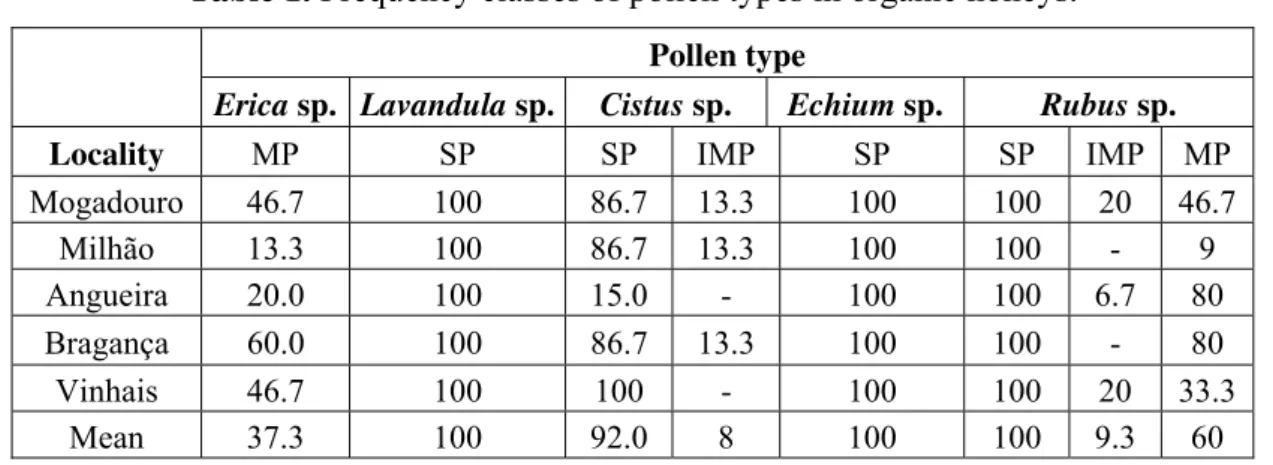
In Europe more than one hundred botanical species can give monofloral honeys. Most of them have only local importance and are thus marketed on a limited scale, but have also been described in the literature [21]. Moreover, consumers prefer monofloral honeys, which mean that they also have a higher commercial value for the producers. Even though the beekeepers themselves, according to the best of their knowledge and the location of hives, had declared the organic honey samples as monofloral lavender (Lavandula sp.) honey, all the samples were subjected to pollen analysis. The identified pollens and their frequency on the analyzed organic honeys are presented on Table 1. Monofloral status generally refers to the presence of a single pollen type in quantities greater than 45% of the total pollen content in the spectrum. For honey samples having under-represented pollen grains, botanical classification may be achieved with a minor pollen frequency percentage, as for example, lavender honey needs 15% of Lavandula sp. pollen to be monofloral. Results of the honey’s pollen profile analysis permit us to determine its floral origin and to confirm the identity of the honey source indicated by the beekeepers: the analysed samples had always Lavandula sp. as Secondary Pollen (SP, 16-45%) and can thus be classified as monofloral lavender.
Table 1. Frequency classes of pollen types in organic honeys. Pollen type
Erica sp. Lavandula sp. Cistus sp. Echium sp. Rubus sp.
Locality MP SP SP IMP SP SP IMP MP
Mogadouro 46.7 100 86.7 13.3 100 100 20 46.7
Milhão 13.3 100 86.7 13.3 100 100 - 9
Angueira 20.0 100 15.0 - 100 100 6.7 80 Bragança 60.0 100 86.7 13.3 100 100 - 80
Vinhais 46.7 100 100 - 100 100 20 33.3
Mean 37.3 100 92.0 8 100 100 9.3 60
SP, Secondary pollen (16 to 44%); IMP, Important minor pollen (3 to 15%) and MP, Minor pollen (1 to 3%).
Molecules 2011, 16 5377
The contribution of the scientific-technical melissopalynology may in the future be useful in commercial transactions, certifying the differentiation of honey for its floral origin, an added value that certainly should not be wasted. Moreover, melissopalynology also allows scientists to infer the vegetation present in an area, and to date and ascertain any biodiversity changes, as for example the presence and distribution of invasive and/or exotic plants. For example, previous work showed that honeys from the Portuguese Entre-Douro e Minho region contained Eucalyptus pollen, the latter not being found in the organic lavender honeys analyzed here [19].
2.2. Color Analysis
The color of the analyzed samples varied between Light Amber (49 a 83 mm) and Dark Amber (>114 mm), according to the Pfund scale.
2.3. Physicochemical Parameters
Table 2 summarizes the results obtained [mean, range and standard deviation (SD)] from the physicochemical analysis of the organic honey samples. The Moisture (M, %) varied from 16.00 to 18.30. The small variation observed in the water contents of these samples may be due to the similar bee-hive handling practices used by Portuguese beekeepers. The M of honey depends on various factors, for example: the harvesting season, the degree of maturity reached in the hive, and environmental factors. The maximum amount of M present in honey is the only composition criterion which, as part of the Honey Standard, has to be met for all world trade honeys. In Codex Alimentarius (2001) and EUCouncil directives (2002) the maximum M content value of pure floral honey is given as 23% for heather honeys and not more than 20% in general. Knowledge of the M contents in honey is useful to improve its conservation and storage by preventing the growth of moulds on its surface. Furthermore, the water content value is also of great importance because it is considered to be a useful parameter for describing moistness and viscosity of honey. Similar results were reported by Gomes et al. and by Féas et al., in commercial and artisanal honeys from Portugal, respectively.
Hidroxymetilfurfural (HMF) and Diastase Activity (DA) are widely recognized parameters for the evaluation of honey freshness and/or overheating. International regulations set a minimum value of 8 on Gothe’s scale for DA, and a maximum HMF content of 40 mg/kg [1,12]. The HMF content of the honeys analyzed ranged from 0.77 to 1.50 mg/kg. Féas et al. and Gomes et al. obtained higher values for artisanal (0.2-22.8 mg/kg) and commercial (18.0-94.0 mg/kg) honeys, and as the HMF content is indicative of honey freshness, it suggests that the organic honeys are fresher. This information coincides with the information provided by the beekeepers. The DA of honey samples is 15.35 (Gothe degrees, average) with a range of 13.90 to 16.40 and a SD of 0.61. These amounts are higher than the ones obtained in artisanal (10.30 Gothe degrees) and commercial (12.10 Gothe degrees) honeys. The values obtained in organic honeys for HMF and DA are typical of unprocessed honey. In honey, these parameters are related to its quality and heat processing but have not been related to the origin of the samples [22]. No sample exceeded the limits established for these variables [1,12].
Molecules 2011, 16 5378
ranging from 0.03 to 0.26%. Ash values were below 0.60%, as expected for nectar honeys [1,12]. The ash mass fraction is a useful parameter in determining botanical origin of honey and differentiating between nectar honey and honeydew. The EC values of the honeys analyzed ranged from 0.09 to 0.43 mS/cm. The electrical conductivity of honey may be explained by taking into account the ash and acid content of honey, which reflects the presence of ions and organic acids; the higher their content, the higher the resulting conductivity. The results of ash and EC suggest that the environment isn’t polluted, confirming the high quality of the honeys obtained in biological production mode.
The honey samples presented pH values ranging from 3.45 to 4.00, with an average of 3.74. The observed pH values were similar to those reported for Indian honey samples [24]. The low pH of honey inhibits the presence and growth of microorganisms and makes honey compatible with many food products in terms of pH and acidity. This parameter is of great importance during the extraction and storage of honey as it influences its texture, stability and shelf life. The values of pH in honey help to determine its origin: flower or forest; the latter show higher values. The obtained pH’s values are identical to the referred in studies concerning other trade types of Portuguese honey.
The Free Acidity (FA) of honey samples is 29.8 ± 0.68 meq/kg. Variation in FA among different honeys can be attributed to floral origin or to variation because of the harvest season [25]. The FA of honey may be explained by taking into account the presence of organic acids in equilibrium with their corresponding lactones, or internal esters, and some inorganic ions, such as phosphate. All of the samples investigated met the demands set out in the regulations which require, in general, no more than 50 meq/kg and not more than 80 meq/kg (baker's honey); this indicates the absence of unwanted fermentations [1,12].
Honey is mainly composed of the monosaccharides glucose and fructose. The Reducing Sugars (RS, %) content of the honeys analyzed ranged from 65.60 to 68.90% and the mean percentages of Apparent Sucrose (AS) is 8.01% with a range of 7.50 to 8.30 and a SD of 0.22 (sucrose content by European Directives must be under 5%). These two parameters confirm that the honey samples studied were floral honeys. In respect to reducing sugars (fructose and glucose), EU Directive 2001/110 imposes values ≥60 g/100 g, except for honeydew honey, which is ≥45 g/100 g. These samples do not only meet the standards but also correspond to the levels observed in other studies [6,19,26,27]. Non-reducing sugars (apparent sucrose) are set to be ≤5 g/100 g for the majority of honeys, except for citrus and eucalyptus honeys, which have higher limits (≥10 g/100 g), as well as lavender honeys (≥15 g/100 g). Higher sucrose contents could be the result of an early harvest of honeys, i.e., the sucrose has not been converted to fructose and glucose. The sucrose determined for the organic lavender honey (8.01%). In fact, anterior studies carried on by our work team revealed that the sucrose of artisanal and some of the commercial honeys was inferior to the one present in this work. The discrepancy between the sucrose in the different analysed honeys is due to the floral origin, as this study used can only monofloral lavender honeys.
Molecules 2011, 16 5379 5379
Table 2. Physicochemical parameters of analyzed organic honey samples.
Parameters
Locality Moisture (% w/w) Electrical Conductivity (mS/cm) Ash (% w/w) HMF (mg/kg) Diastase Activity (Gothe Scale) pH
Free Acidity (meq/kg) Reducing Sugars (%) Apparent Sucrose (%)
Mogadouro 17.27 ± 0.60
a
(16.50 ± 18.20)
0.25 ± 0.05 a (0.19 ± 0.33)
0.12 ± 0.07 a (0.07 ± 0.18)
1.15 ± 0.22 a (0.89 ± 1.50)
15.30 ± 0.71 a (14.00 ± 16.20)
3.76 ± 0.13 a (3.60 ± 4.00)
40.48 ± 0.56 a (39.70 ± 41.20)
67.78 ± 0.45 a (66.90 ± 68.30)
7.94 ± 0.20 a (7.60 ± 8.25)
Milhão 17.17 ± 0.58
a
(16.50 ± 18.20)
0.32 ± 0.08 a (0.20 ± 0.43)
0.17 ± 0.10 a (0.07 ± 0.26)
1.22 ± 0.17 a (0.97 ± 1.50)
15.48 ± 0.38 a (14.90 ± 16.00)
3.69 ± 0.08 a (3.50 ± 4.00)
40.24 ± 0.68 a (39.40 ± 41.30)
67.85 ± 0.18 a (67.40 ± 68.30)
8.06 ± 0.16 a (7.75 ± 8.20)
Angueira 17.21 ± 0.68
a
(16.40 ± 18.30)
0.33 ± 0.04 a (0.29 ± 0.40)
0.18 ± 0.04 a (0.15 ± 0.24)
1.08 ± 0.09 a (0.93 ± 1.20)
15.57 ± 0.3 a (14.99 ± 16.20)
3.80 ± 0.09 a (3.65 ± 4.00)
40.32 ± 0.81 a (38.90 ± 41.20)
67.91 ± 0.67 a (65.90 ± 68.90)
8.21 ± 0.11 a (7.89 ± 8.30)
Brangança 17.24 ± 0.57
a
(16.50 ± 18.10)
0.26 ± 0.09 a (0.18 ± 0.43)
0.12 ± 0.11 a (0.06 ± 0.26)
1.17 ± 0.2 a (0.87 ± 1.50)
15.18 ± 0.6 a (14.00 ± 16.20)
3.79 ± 0.14 a (3.60 ± 3.99)
40.51 ± 0.63 a (39.50 ± 41.30)
67.91 ± 0.38 a (67.10 ± 68.30)
7.96 ± 0.22 a (7.60 ± 8.30)
Vinhais 16.97 ± 0.67
a
(16.00 ± 18.00)
0.13 ± 0.05 b (0.19 ± 0.25)
0.06 ± 0.01 b (0.03 ± 0.12)
1.00 ± 0.22 a (0.77 ± 1.35)
15.21 ± 0.81 a (13.90 ± 16.40)
3.67 ± 0.15 a (3.45 ± 3.85)
40.01 ± 0.64 a (38.90 ± 41.20)
67.54 ± 0.75 a (65.60 ± 68.50)
7.88 ± 0.23 a (7.50 ± 8.15)
Mean 17.17 ± 0.62 (16.00 ± 18.30)
0.26 ± 0.09 (0.09 ± 0.43)
0.13 ± 0.05 (0.07 ± 0.26)
1.14 ± 0.20 (0.77 ± 1.50)
15.35 ± 0.61 (13.90 ± 16.40)
3.74 ± 0.13 (3.45 ± 4.00)
40.31 ± 0.68 (38.90 ± 41.30)
67.80 ± 0.53 (65.60 ± 68.90)
Molecules 2011, 16 5380
2.4. Bioactive Compounds
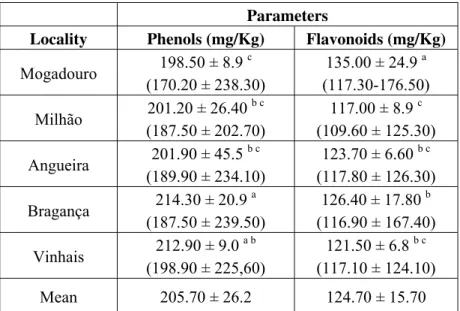
The total phenols of the analyzed honey varied from 170 to 239 mg/Kg. The average flavonoids’ value of the honey samples is 124.70 mg/Kg with a range of 117.00 to 135.00 mg/Kg and a SD of 15.7 (Table 3).
Table 3. Differences in phenols and flavonoids mean concentrations among regions. Standard deviation values are shown in brackets.
Parameters
Locality Phenols (mg/Kg) Flavonoids (mg/Kg)
Mogadouro 198.50 ± 8.9
c
(170.20 ± 238.30)
135.00 ± 24.9 a (117.30-176.50)
Milhão 201.20 ± 26.40
b c
(187.50 ± 202.70)
117.00 ± 8.9 c (109.60 ± 125.30)
Angueira 201.90 ± 45.5
b c
(189.90 ± 234.10)
123.70 ± 6.60 b c (117.80 ± 126.30)
Bragança 214.30 ± 20.9
a
(187.50 ± 239.50)
126.40 ± 17.80 b (116.90 ± 167.40)
Vinhais 212.90 ± 9.0
a b
(198.90 ± 225,60)
121.50 ± 6.8 b c (117.10 ± 124.10)
Mean 205.70 ± 26.2 124.70 ± 15.70
* The letters (a, b and c) represents which honeys are different by Tukey test with significance of p = 0.05.
The obtained results both for total phenols and for flavonoids were identical to the ones reported by our work team in light honeys from the Parque Natural de Montesinho [28].
2.5. Microbiological Analyses
Microbial counts in organic honey samples are presented in Table 4. Honey, in spite of its usefulness, is known to contain certain microbes. The microorganisms that survive in honey are those that withstand the concentrated sugar, acidity and other antimicrobial characters of honey. In any case, this natural reservoir for microbes’ status does not diminish the many important uses that honey is known for.
Levels of quantification for the commercial quality parameters (aerobic mesophiles and moulds and yeasts) in the analyzed honey samples are generally lower than those reported by Féas et al. Yeast and moulds were detected in low counts, with means values obtained of 14.1 ± 4.5 cfu/g. The total aerobic mesophiles counts in the samples ranged from 1.9 × 10² cfu/g to 2.1 × 10² cfu/g, with a mean value obtained of 2.0 × 10² cfu/g ± 3.2 × 101 cfu/g. These results are similar to the determinated by Gomes et al. in commercial honeys.
Molecules 2011, 16 5381
Table 4. Microbial analyses of organic honey samples. Locality
Microorganisms Mogadouro Milhão Angueira Bragança Vinhais
Moulds and Yeasts a 1.5 × 10 ± 5 1.6 × 10 ± 5 1.2 × 10 ± 3 1.5 × 10 ± 4 1.5 × 10 ± 4 Aerobic mesophiles a 1.9 × 10
2 ± 4.3
× 101
2.1 × 10² ± 3.9
× 101
1.9 × 10² ± 2.4
× 101
1.9 × 10² ± 2.5
× 101
1.9 × 10² ± 2.5
× 101
Fecal coliforms b ± 1 ± 1 ± 1 ± 1 ± 1
Sulphite-reducing
Clostridium spp. c - - - - -
Salmonellad - - - - -
a Colony-forming units per gram of honey (cfu/g). b Fecal coliforms were enumerated by the Most
Probable Number (MPN). c in 0.01 g. d in 25 g.
In respect to sanitary quality (fecal coliforms) and safety (sulphite-reducing Clostridium spp. and Salmonella), all our samples were negative, as verified by our team in other Portuguese honeys. In contrast, other authors detected coliform contamination in one tested sample [29], and reported that 70% of 23 honey samples were contaminated with sulphite-reducing Clostridium spp. [30]. Having reviewed the scientific literature, Clostridiums appears to be the main microorganism in honey of concern to human health. Its presence in honey is especially dangerous for babies under one year old, since they do not have a fully developed immune system, and honey is the only dietary vehicle so far definitively linked to infant botulism. Honey samples collected at retail level were found to be contaminated with Clostridium botulinum spores in the USA (10% of the analysed samples), Japan (8.5%), Brazil (7.5%) and Italy (6.5%); with contamination levels between 5 and 80 spores g−1 of product [31]. EU legislation lacks specifications concerning microbiological contamination and hygiene of the product. In fact, numerous studies have been reported on the physicochemical parameters of honeys from all over the world, but microbiological contamination studies are few and are essentially devoted to C. botulinum. It is recommended that effective and targeted information regarding risks of infant botulism from the consumption of honey should be provided, e.g. via leaflets, labelling and advice to health-care professionals.
3. Conclusions
The present study has characterised organic honey harvested in Northeast Portugal, in respect to floral origin, physicochemical parameters, microbial safety and bioactive compounds. All organic honey samples can be classified as monofloral lavender and all the values obtained for the physicochemical and microbiological parameters exceed in quality the limits imposed by the present legislation. These results show that organic honey production, with the current beekeeping handling and extraction applied by Portuguese beekeepers, fulfil all the required quality and safety parameters.
Molecules 2011, 16 5382
4. Experimental
4.1. Honey Sampling
Seventy-three (n = 73) organic honey samples, from Apis mellifera, were collected from July to August in 2009 by twenty five beekeepers from separate apiaries. The samples were from five localities of Northeast Portugal with the following distribution: Mogadouro (n = 16); Milhão (n = 15); Angueira (n = 13); Bragança (n = 15) and Vinhais (n = 14). They were obtained by centrifugation and stored at 5 °C until analysis, which occurred no more than one month after the extraction from the hives by beekeepers.
4.2. Reagents and Equipment
Gallic acid, (+)-catechin and ethanol were obtained from Sigma-Aldrich (Germany). Methanol was obtained from Pronolab (Lisboa, Portugal). The Folin-Ciocalteu and sodium carbonate reagents were obtained from Merck (Germany). All other chemicals were obtained from Sigma Chemical Co. (St. Louis, USA). All the chemicals used in the experiments were of analytical grade. Water was treated in a Mili-Q Water Purification System (TGI Pure Water System, USA). The spectrophotomer was a model Unicam UV-Visible Spectrometry Hekios (United Kingdom).
4.3. Sample Floral-Type Identification
Even though the beekeepers themselves declared honey as monofloral lavender, all the samples were subjected to pollen analysis per the acetolysis method of Erdtman as reported previously in detail [19]. The following terms were used for pollen frequency classes: predominant pollen (PP, more than 45% of pollen grains counted), secondary pollen (SP, 16-45%), important minor pollen (IMP, 3-15%) and minor pollen (MP, 1-3%).
4.4. Color Analysis
Honey samples were heated to 50 °C to dissolve sugar crystals, and the colour was determined by spectrophotometric (Unicam UV-Visible Spectrometry) measurement of the absorbance of a 50% honey solution (w/v) at 635 nm. The honeys were classified accordingto the Pfund scale after conversion of the absorbance values: mm Pfund = 38.70 + 371.39 × Abs [32].
4.5. Physicochemical Analysis
Molecules 2011, 16 5383
4.6. Microbiological Determinations
Ten grams of each honey sample were homogenized into peptone water solvent (90 mL). Decimal dilutions were made into the same solvent. Aerobic mesophilic bacteria were counted onto standard Plate Count Agar (PCA, Hemidea) and incubated at 30 °C for 48 h (NP-3788:2002). Microbial counts were expressed as colony-forming units per gram of bee pollen (cfu/g). Moulds and yeasts enumeration was made on DG18 (Himedia) incubated at 25 °C for 5 days, following the ISO 21527-2 (2008) protocol. Microbial counts were expressed as colony-forming units per gram of bee pollen (cfu/g).
For sulphite-reducing Clostridium spp. counting, aliquots of 10, 5, 1 and 0.1 mL of the initial suspension were added to an empty tube, thermally treated at 80 °C for 5 min and covered with Iron Sulfite Agar (ISA) media (ISO 15213:2003), tubes were incubated at 37 °C for 5 days. Fecal coliforms were enumerated by the Most Probable Number technique defined in the protocol ISO 4831 (2006). Results were expressed as most probable numbers of coliforms per gram of bee pollen (MPN/g). The positive results for fecal coliforms were researched for E. coli. Enumeration was made on Eosin Methylene Blue Agar-EMB Agar (Oxoid), incubated at 35 °C for 24 h. Results were expressed as colony forming units of E. coli per gram of bee pollen (cfu/g). Salmonella detection followed the ISO 6579 protocol. All microbial tests were performed in triplicate.
4.7. Bioactive Compounds Quantification
The total phenolic content was estimated according to the Folin-Ciocalteau method described by Moreira et al. The reaction of MEP (0.5 mL) mixed with the Folin-Ciocalteau reagent (0.5 mL) and 0.5 mL of 10% Na2CO3 was kept in the dark at room temperature for 1 h, and the absorbance was quantified at 700 nm (Unicam UV-Visible Spectrometry) acid was used to calculate the standard curve (0.01-0.08 mM; y = 2.3725x + 0.0021; R2 = 0.1). Total phenols content were expressed as mg of Gallic acid equivalents/g of extract (GAEs).
Flavonoids were determined according to procedures described by [33]. The sample (250 µL) was mixed with distilled water (1.25 mL) and 5% NaNO2 solution (75 µL). After 5 min, a 10% AlCl3xH2O (150 µL) solution was added. After 6 min, 1 M NaOH (500 µL) and distilled water (275 µL) were added to the mixture. The solution was mixed well and the intensity of pink colour was measured at 510 nm. (+)-Catechin was used to calculate the standard curve (0.022-0.34 mM; Y = 0.9990X − 0.0497; R2 = 0.9961) and the results were expressed as mg of (+)-catechin equivalents (CEs) per kg of honey.
As the reducing sugars, which are present in large amounts in honey have been found to interfere with the original Folin-Ciocaltu metod, in order to avoid overestimated results, a blank was prepared with honey extract (1:2 honey/water) and insoluble polyvinylpolypyrrolidine (PVPP, 0.1 g) as proposed by Gheldof et al.
4.8. Statistical Analysis
Molecules 2011, 16 5384
Acknowledgements
We would like to thank all the Portuguese beekeepers who kindly supplied us with the honeys for this study. We sincerely thank to Teresa Sánchez, for critically reading the manuscript and making a number of helpful suggestions.
References and Notes
1. Codex Alimentarius, C. Revised Codex Standard for Honey, Codex STAN, 12-1981, Rev. 1 1987, Rev. 2. 2001.
2. Al-Waili, N.S.; Saloom, K.Y.; Akmal, M.; Al-Waili, F.; Al-Waili, T.N.; Al-Waili, A.N.; Ali, A. Honey ameliorates influence of hemorrhage and food restriction on renal and hepatic functions, and hematological and biochemical variables. Int. J. Food Sci. Nutr. 2006, 57, 353-362.
3. Bahrami, M.; Ataie-Jafari, A.; Hosseini, S.; Foruzanfar, M.H.; Rahmani, M.; Pajouhi, M. Effects of natural honey consumption in diabetic patients: An 8-week randomized clinical trial. Int. J. Food Sci. Nutr. 2009, 60, 618-626.
4. Molan, P.C. Potential of honey in the treatment of wounds and burns. Am. J. Clin. Dermatol. 2001, 2, 13-19.
5. Bardy, J.; Slevin, N.J.; Mais, K.L.; Molassiotis, A. A systematic review of honey uses and its potential value within oncology care. J. Clin. Nurs. 2008, 17, 2604-2623.
6. Gomes, S.; Dias, L.; Moreira, L.; Rodrigues, P.; Estevinho, L. Physicochemical, microbiological and antimicrobial properties of commercial honeys from Portugal. Food Chem. Toxicol. 2009, 48, 544-548.
7. Estevinho, L.; Pereira, A.P.; Moreira, L.; Dias, L.G.; Pereira, E. Antioxidant and microbiological effects of phenolic compounds extracts of Northeast Portugal honey. Food Chem. Toxicol. 2008, 46, 3774-3779.
8. Akbulut, M.; Özcan, M.M.; Çoklar, H. Evaluation of antioxidant activity, phenolic, mineral contents and some physicochemical properties of several pine honeys collected from Western Anatolia. Int. J. Food Sci. Nutr. 2009, 60, 577-589.
9. Cuthbertson, A.G.S.; Brown, M.A. Issues affecting British honey bee biodiversity and the need for conservation of this important ecological component. Int. J. Environ. Sci. Tech. 2009, 6, 695-699.
10. Oldroyd, B.P. What's Killing American Honey Bees? PLoS Biol. 2007, 5, e168.
11. Rial-Otero, R.; Gaspar, E.M.; Moura, I.; Capelo, J.L. Chromatographic-based methods for pesticide determination in honey: An overview. Talanta 2007, 71, 503-514.
12. EU. Council Directive 834/2007 of 28 June 2007 on organic production and labelling of organic products. Off. J. Eur. Commun. 2007, L189, 1-23.
13. Tucak, Z.; Periskić, M.; Beslo, D.; Tucak, I. Influence of the beehive type on the quality of honey. Coll. Antropol. 2004, 28, 463-467.
Molecules 2011, 16 5385
15. Azeredo, L.C.; Azeredo, M.A.A.; Sousa, S.R.; Dutra, V.M.L. Protein contents and physicochemical properties in honeys sample from Apis Mellifera of different floral origins. Food Chem. 2003, 80, 249-254.
16. Jeon, M.; Zhao, Y. Honey in combination with vacuum impregnation to prevent enzymatic browning of fresh-cut apples. Int. J. Food Sci. Nutr. 2005, 56, 165-176.
17. Pires, J.; Estevinho, M.L.; Feás, X.; Cantalapiedra, J.; Iglesias, A. Pollen spectrum and physico-chemical attributes of heather (Erica sp.) honeys of north Portugal. J. Sci. Food Agric. 2009, 89,1862-1870.
18. Bağci, Y.; Arslan, D.; Özcan, M.M.; Dursun, N. Determination of the mineral content of bee honeys produced in Middle Anatolia. Int. J. Food Sci. Nutr. 2007, 58, 567-575.
19. Feás, X.; Pires, J.; Estevinho, M.L.; Iglesias, A.; Pinto de Araujo, J.P. Palynological and physicochemical data characterisation of honeys produced in the Entre-Douro e Minho region of Portugal. Int. J. Food Sci. Tech. 2010, 45, 1255-1262.
20. Magkos, F.; Arvaniti, F.; Zampelas, A. Organic food: Nutritious food or food for thought? A review of the evidence. Int. J. Food Sci. Nutr. 2003, 54, 357-371.
21. Persano-Oddo, L.; Piro, R. Main European unifloral honeys: Descriptive sheets. Apidologie 2004, 35, S38-S81.
22. Anklam, E. A review of the analytical methods to determine the geographical and botanical origin of honey. Food Chem. 1998, 63, 549-562.
23. Guyot-Declerck, C.; Renson, S.; Bouseta, A.; Collin, S. Floral quality and discrimination of Lavandula stoechas, Lavandula angustifolia, and Lavandula angustifolia × latifolia honeys. Food Chem. 2002, 79, 453-459.
24. Ahmed, J.; Prabhu, S.T.; Raghavan, G.S.V.; Ngadi, M. Physico-chemical, rheological, calorimetric and dielectric behavior of selected Indian honey. J. Food Eng. 2007, 79, 1207-1213. 25. Pérez-Arquillué, C.; Conchello, P.; Ariño, A.; Juan, T.; Herrera, A. Physicochemical attributes
and pollen spectrum of some unifloral Spanish honeys. Food Chem. 1995, 54, 167-172.
26. Terrab, A.; Díez, M.J.; Heredia, F.J. Characterisation of Moroccan unifloral honeys by their physicochemical characteristics. Food Chem. 2002, 79, 373-379.
27. Küçük, M.; Kolailı, S.; Karaoğlu, Ş.; Ulusoy, E.; Baltacı, C.; Candan, F. Biological activities and chemical composition of three honeys of different types from Anatolia. Food Chem. 2007, 100, 526-534.
28. Ferreira, I.C.F.R.; Aires, E.; Barreira, J.C.M.; Estevinho, M.L. Antioxidant activity of Portuguese honey samples: Different contributions of the entire honey and phenolic extract. Food Chem. 2009, 114, 1438-1443.
29. Iurlina, M.O.; Fritz, R. Characterization of microorganisms in Argentinean honeys from different sources. Int. J. Food Microbiol. 2005, 105, 297-304.
30. Finola, M.S.; Lasagno, M.C.; Marioli, J.M. Microbiological and chemical characterization of honeys from central Argentina. Food Chem. 2007, 100, 1649-1653.
31. Nakano, H.; Sakaguchi, A. An unusual heavy contamination of honey products by Clostridium botulinum type F and Bacillus alvei. FEMS Microbiol. Lett. 1991, 63, 171-177.
Molecules 2011, 16 5386
33. EU. Council Directive 2001/110/CE relating to honey. Off. J. Eur. Commun. 2002, L10, 47-52. 34. Gheldof, N.; Wang, X.H.; Engeseth, N.J. Identification and quantification of antioxidant
components of honeys from various floral sources. J. Agric. Food Chem. 2002, 50, 5870-5877. 35. ISO 6579. Microbiology of Food and Animal Feeding Stuffs – Horizontal Method for the
Detection of Salmonella spp. International Standards Organization: Geneva, Switzerland, 2002. 36. ISO 4831. Microbiology of Food and Animal Feeding Stuffs – Horizontal Method for the
Detection and Enumeration of Coliforms – Most Probable Number Technique. International Standards Organization: Geneva, Switzerland, 2006.
37. ISO 21527-2. Microbiology of Food and Animal Feeding Stuffs – Horizontal Method for the Enumeration of Yeasts and Moulds – Part 2, Colony Count Technique in Products with Water Activity Less Than or Equal to 0.95. International Standards Organization: Geneva, Switzerland, 2008.
Sample Availability: Samples of all the honeys used are available from the authors.