Organic Farming in Portugal
The Impact of Public Measures
May 22nd 2016
1
Abstract
This work aims at studying organic sector in Portugal and, more specifically, the impact of public support measures in the organic sector development, production and market. The study is based on both a quantitative and qualitative analyze of organic historical data from 2000 to 2014, namely the evolution of organic area and organic holdings. The quantitative analysis uses Rural Development Programs and agricultural databases to evaluate the impact of subsidies allocated
and the financial performance of holdings. The qualitative analyze relies on Portuguese expert’s
opinion in recognizing what factors bring more contribution to organic sector’s development. The
study concludes that policy support measures have had some impact on the organic sector development. However, some doubts about their effectiveness stand out.
2
Introduction
Between the two World Wars chemical-intensive farming (born in the beginning of the century) faced a crisis in the form of soil degradation, poor food quality and the decay of rural traditions. So, in Germany 1927/28 the first organic movement was created Natural Farming and Back-to-the-Land Association, with monthly published in Bebauet die Erde (Cultivate the Soil). By the time organic products were sold in Biological Premium Product market, if specific standards were verified. But it was not until the 1970s, with growing awareness of an environmental crisis and great social and political turbulence during the 1960s, that organic farming gain stenght. In a join effort of five countries, in 1972 the International Federation of Organic Agriculture Movements (IFOAM) was created.
International Federation of Organic Agriculture Movements (IFOAM) defines organic agriculture
as “a production system that sustains the health of soils, ecosystems and people. It relies on
ecological processes, biodiversity and cycles adapted to local conditions, rather than the use of inputs with adverse effects. Organic Agriculture combines tradition, innovation and science to benefit shared environment and promote fair relationships and a good quality of life for all
involved.”
Several reports describe organic farming as positive for biodiversity conservation, with important contributions for water quality, improve organic matter in arable soils and to invert soil erosion (Environmental report 2007 and Environmental report 2012), with its own system for controlling pests and diseases, sustains ecosystems, promotes animal welfare and produce quality food (European Commission, 2002). Argilés, et al. (2010) found no significant differences between organic and conventional farms concerning financial performance, but organic ones presented a significantly lower environmental impact and created more employment opportunities. Nevertheless, organic farming is consider economically disadvantageous because of the lower productivity levels (Gil et al. 2000) and the still insufficient number of consumers willing to pay a premium price for food quality (Rigby et al.2001).
3
In Europe, European Commission gives the first EU-wide legal definition of organic farming in 1991 (EC Reg. 2092/91). In 1992 and 1999 area payments are included in agri-environmental measure under the EU rural development program.
After two decades integrating organic farming support measures in Common Agricultural Policy (CAP), the European Commission concluded that the expansion of organic holdings is linked to
public support measures, market developments and a “facilitating” environment.
In order to couple with pressure on natural resources, agriculture needs to improve its environmental performance through more sustainable methods (e.g. integrated production and organic farming). As organic farming contributes to water resources, soil, air and biodiversity, as well as helping to accomplish the Quito protocol and increase the levels of carbon in the vegetal cover. Pillar 2 of Common Agricultural Policy (CAP) 2014-2020 includes a Green Direct
Payment. This new policy instrument defines that 30% of each Rural Development Program’s
(RDPs) budget must be reserved to: agri-environmental-climate measures, organic farming, Areas of Natural Constrains (ANC), Natura 2000 areas, forestry measures and investment that bring environmental contribution.
In Portugal, organic farming support measures have been included in RDPs, first RURIS (2000-2006), then PRODER (2007-2013) and now PDR 2020 (2014-2020), mainly through agri-environmental payments. Those efforts have been made to support agricultural and forestry practices, which contribute to reduce the agriculture environmental impact and the preservation of resources in coordination with sustainable and competitive agricultural production. This effort has resulted in the considerable increase in agricultural area under organic farming, which rose from 1,2% to about 5,83% of the total Utilized Agricultural Area (UAA) between 2000 and 2014.
Based on the overview of public support measures addressing organic farming, this work aims to explore the relationship between policy measures, policy strategies and the development of the organic farming in Portugal. The study is based on both a quantitative and qualitative analyze of organic historical data from 2000 to 2014, namely the evolution of organic area and organic holdings. The quantitative analysis uses RDPs and agricultural databases to evaluate the impact of subsidies allocated and the financial performance of holdings. The qualitative analyze relies
on Portuguese expert’s opinion identifying what factors bring more contribution to organic
sector’s development.
4
relationships between the development of organic sector and the policy support measures to assess whether their support measures contributed to sector growth.
They conclude that the variations in the development in organic sector in different Member States besides a common European Organic Action Plan (EOAP) could be related with many factors as the policy environment, organic market developments or geographical conditions.
In order to understand how the Portuguese organic sector evolve since 2000 and what are the
perspectives for next years, this work was split in four sections: Section 1 describes briefly the
characteristics and the evolution of organic sector; Section 2 explains the policy environment for
organic farming; Section 3 provides the quantitative and qualitative analysis and; Section 4
concludes.
Section 1: Facts and figures on organic agriculture in Portugal
Since the mid-1980s, in the European Union (EU) alone the total area of farmland under organic production has increased steadily to 10,3 million hectares in 2014, which corresponds to 5,7% of the total utilized agricultural area in EU. But the annual growth of organically managed land
slowed down to 1,1% in 2014, with a number of producers’ growth also decelerating to 0,2% rise
in 2014.
Organic market on the other hand have had an expansionary growth with the total value of €24
billion in 2014. The EU market for organic products is growing constantly with an average annual growth rate in grocery retail markets of around 2% to 3% from 2006 to 2012, and 7,4% just in 2014. The growing demand for food quality products by consumers and the stagnation of organic production, leaves room for importers growth.
Organic farming and sector didn’t evolve in the same way in all member states. To understand the Portuguese organic reality, it is important to comprehend how the agricultural sector in
Portugal behaves. The primary sector accounts for 2.4% of the country’s economy and 11% of
total employment. The age structure of farming community is comparatively older than in the EU-28, in Portugal only 2,6 % of farmers are under 35 years old (7.5% in EU-28), while 46,5%
are older than 64 (29,7% in EU-28). Portugal’s 305 280 holdings are predominantly small,
5
Fig 1 – Portuguese Agricultural by production type
Over the last years, organic farming in Portugal has expanded continuously, stabilizing its growth since 2010. Between 2000 and 2009 the organic area in Portugal grew by 214%, but only 8%,
between 2010 and 2014 (based on INE data for the years 2000-20091 and 2010-2014,
respectively). In 2014 the total organic area had an extension of 228 840 ha, which is roughly 6% of total Utilized Agricultural Area (UAA) (Graph 1).
Graph 1 – Percentage of Area Under Organic Farming
Number of producers just boosted particularly after the launch of the European Organic Action Plan (EOAP) in 2004 (Graph 2). Organic producers, in contrast with the decelerating and even decreasing trend in organic farmland, kept an upward trend, 21% from 2010 onwards. In general, it would be expected that either area and producers had a similar path. Nevertheless, the bulk of organic agricultural holdings are in large extent of small size, in 2013, 46% of holdings were smaller than 2 hectares and similar trend was visible in the years before. Thus, assuming that a
2000 2001 2002 2003 2004 2005 2006 2007 2008 2009 2010 2011 2012 2013 2014 Biologic 1,2% 2,0% 2,1% 3,2% 5,6% 6,2% 7,2% 6,3% 5,7% 4,3% 5,8% 6,1% 5,5% 5,4% 5,8%
6
1. Until 2009, data about producers, area and livestock was based on farmers’ activity notification. After 2010, Direção Geral de Agricultura e Desenvolvimento (DGADR) started to include other administrative reports.
2. Data about total agricultural area in 2006 was not available.
similar trend will keep on going, further increases in holdings would led to small increases in area.
Graph 2 – Evolution of Area and Producers1
In principle, the organic area should follow a similar path, as the share of organic area in total utilized agricultural area. Thus, when organic area increase, the share of it in total farm structure would have the same trend. However, in 2007, two things seem to happen, while the area under organic farming reach its pick, the share of organic area starts to decrease. This could be associated with an increase in the total farmland. In fact, if we notice in the graph in (Annex A)
from 2005 to 20072 there is an increase in total farmland. The share of organic area had similar
values in 2005 and 2007 (6,2% and 6,3%, respectively), just in 2006 this value hits its pick 7,2%.
According to Relatório de Execução (2006), 2006 had favorable climacteric conditions for grazing and also to avoid shortages, because of 2005 drought period, producers increased in 30% forage cultures production. With no data available referring the production scheme, conventional or organic, for this time period. One may argue, that to enjoy organic area payments for this type of culture, farmers convert to organic, increasing the share of organic area in total farmland.
The increase in organic area in 2007 could be associated with a change in RDPs. Through this transition period, according to Relatório de Execução (2007), beyond technical support and
previous program measures that weren’t exercised, only Less Favored Area (LFA) support and
Agri-enviromental measures were addressed. So the increased in area under organic farming could be associated with new comers of farmers attracted by subsidies. Moreover, there was a marketing campaign associated with PRODER, increasing the interest in primary sector. Thus,
1 000 2 000 3 000 4 000 5 000 6 000 7 000 8 000 0 50 000 100 000 150 000 200 000 250 000 19 94 19 95 19 96 19 97 19 98 19 99 20 00 20 01 20 02 20 03 20 04 20 05 20 06 20 07 20 08 20 09 20 10 20 11 20 12 20 13 20 14 P ro du ce rs (n o) Or gan ic ar ea ( ha) Área Produtores
7
while the increase in the share of organic area in 2006 was associated with shift from conventional to organic, from 2006 to 2007 in area under organic farming was linked with the entrance of new farmers.
The permanent pastures (72,3%), olives (8,7%) and forage cultures (6,2%) were the most predominant cultures. Pastures and forage are used for animal production. In 2014 the organic animal production were mainly composed by sheeps and bovines, 32,8 % and 26,7%, respectively, of all organic livestock. However, in Portugal, fresh fruits and vegetables are the most sold organic products. This creates an imbalance between demand and supply, since most demanded cultures (ECOZEPT, 2008), Fruits and Vegetables, count just for 1% and 0,7% of the area under organic farming.
Regarding the Portuguese organic market the statistical data made available is even more limited,
so its analyze is based on a ECOZEPT’s 2008 report. ECOZEPT it’s a private consulting company
specialized in the organic sector. According to them, Portuguese consumers spent EUR 70 million on organic products in 2008, which accounts for EUR 5-7 per capita consumer spending one of the lowest in EU-28. The Portuguese organic market started in the mid-1990s, but it was spoiled by a fraudulent use of organic certification. However, the market have been recovering in the last years. The availability of organic food has improved significantly in recent years, with a widespread of specialized organic shops (52%), like consumer cooperatives and local markets (Graph 3). With an important role in marketing of organic food.
Likewise, large conventional retail chains have been showing a growing interest (45%).
Nevertheless, the organic production it’s insufficient to couple with market needs, during the course of the year. In 2008, 50% of all organic sales were imported, coming mostly from France, Germany and Netherland.
Graph 3 – Organic Market, 2008
Although, the still long way the market has to catch up with European peers in consumption terms, the interest taken by the large conventional super and hyper market in organic products show a competitive market. For 2010 they predicted a EUR 10 to 14 spending in organic food, this is equivalent to 0,4% and 0,5% of market share for Organic products. According to ECOZEPT, consumers are predominantly urban, educated and middle class citizens, engaged in dealing with
45% 52%
Market Share
Conventional Supermarket Specialised organic shops
8
climate change and environmental issues and also concerned and food quality and health. Though, fresh food was the most demanded product in 2010, the importance of natural cosmetics in the market place have been growing, but a big deal of them is imported, leaving room for national
producers’ investment.
Section 2: Public policy measures addressing organic farming under Rural
Development Programs
The development of the sector could be attributed among other factors to a favorable context of deep restructuring and reform of the agricultural sector. Since the beginning of the 1990s, Common Agricultural Policy (CAP) encompassed the renewal of farming structures, institutions and agricultural policy. The inclusion of more environmental policies in CAP, pressure Member States to include in their Rural Development Programs measures that promote the change in agriculture production methods, like integrated production and organic farming.
Over 2000 to 2006, the support to organic farming and products was inserted in “Group I –
Environment, Soils and Water Resources protection”, included in the National Rural
Development Program, RURIS. PRODER 2007-2013 maintained measures directed to organic
farming, by Axis 1 – “The Improve of Competitiveness”, and by Axis 2 – “Sustainable
Management of Rural Areas”.
Program’s mid-term evolution (2003) reports on RURIS 2000-2006 positive stimulus to organic farming growth. RURIS agri-environmental measures brought positive returns on biodiversity, landscape, soil and water resources.
The Strategic Environmental Evaluation of 2012 determined that the Rural Development Program 2007-2013 (PRODER) accomplished a positive environmental balance through agro-environmental measures taken. Nevertheless, the report points also the need of complementary between Economic and Social development measures and environmental ones, thus, the need to create environmental measure more toward economic and social development, as well as including natural resources concerns in economic and social measures taken.
PDR 2020 is the Rural Development Program in place since 2014 until 2020, through measure
M7 - “Agricultural and Natural Resources” with area payments for converted area (Action 7.1.1)
9
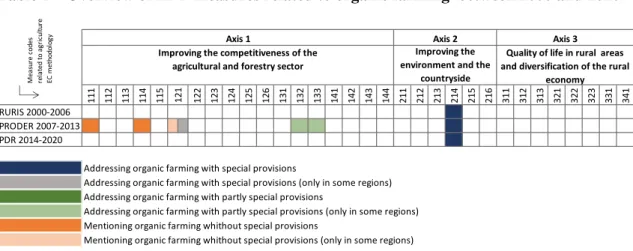
Table 1 – Overview of RDP measures related to organic farming between 2000 and 2020
Table 1 gives a screenshot of the public support measures related with organic farming included in the three different Rural Development Programs in the time period 2000 and 2020. This Measure codes were defined for CAP 2007 and 2013, but an equivalent set of measures was evaluated for the other RDPs. On the other two programs the only public support policy addressed to organic farming was in Area payments.
RURIS was the first program to include organic area supports, starting in 2001. Organic sector was in its early stage with the launch of the first EOAP in Europe, but with no national strategy in the Portuguese case. So, the support to organic farming was limited to area payments. Regarding PDR 2020, one may argue this is a step back organic farming policy or, on the other hand, after PRODER they may have conclude that area payments were the most relevant measure in their agricultural strategy, moving any special provision given to organic farming in other measures towards organic area payments fund.
Agri-environmental payments, Measure 214 – “Organic Support Payments”, are the most
employed RDP measure to support organic farming, providing specific support for conversion and maintenance of organic farming schemes, covering for additional costs or income forgone. The range of payments (conversion and maintenance) varies in relation to specific crops, land characteristics, management practices and region.
With this reasonable payment in mind, computations were made based on income forgone in comparison with the same culture in conventional production, as specific additional costs or no fertilizers use. These computations were made for RURIS, updated in PRODER and were extended now for PDR 2020. Fruits and vegetables are the ones with higher payments rates by area farmed, EUR 810 and EUR 600, respectively. Nevertheless, in the case of indoor vegetables area payments just compensate 20% of total additional costs in changing to organic production. (Annex B).
111 112 113 114 115 122 123 124 125 126 131 132 133 141 142 143 144 211 212 213 214 215 216 311 312 313 321 322 323 331 341
RURIS 2000-2006 PRODER 2007-2013 PDR 2014-2020
Addressing organic farming with special provisions
Addressing organic farming with special provisions (only in some regions) Addressing organic farming with partly special provisions
Addressing organic farming with partly special provisions (only in some regions) Mentioning organic farming whithout special provisions
Mentioning organic farming whithout special provisions (only in some regions)
Source: Sanders et al (2011); Relatório de Execução 2006; Ação 7.1 - Agricultura Biológica
Quality of life in rural areas and diversification of the rural
economy Axis 3 M ea su re co d es rel a ted t o a g ri cu lt u re E C m et h o d o lo g y 121
Improving the competitiveness of the agricultural and forestry sector
Axis 1 Axis 2
Improving the environment and the
10
RURIS was launched in 2000. In the first three years of the program 461,76 ha were approved for organic area support, but payments just started to be exercised in 2004.
IFADAP is responsible to allocate agricultural subsidies (Annex D) according to Rural
Development Program directives and the assessment of farmers’ application, limited by budget
addressed to RDP in each year. These RDPs budgets are co-funded by European Agricultural Fund for Rural Development (EAFRD). In RURIS 2000-2006, with direct payments starting being extended until 2008 addressed EUR 32M which is 7,56% of the total Agri-environmental payments. In PRODER 2007-2013 organic area payments gain importance being 21,49% (EUR 73M).
Most of this policy support measures (Table 1) have been in the producers’ side, leaving the
sector laid on organic area payments, creating no market incentives for growing. If the market
channels were better and more statistical information was provided, this would catch investors’
attention about market’s potential.The organic area isn’t growing much in the last years, probably
due to constrains supply chain (e.g. certification costs, agriculture lower margins, lack of promotion support).
Section 3: Methodology
and Results
Quantitative analysis
Governmental organic farming support, special through area payments are presented in many studies as having a significant impact in the development of farms and organic area (Mathias Stolze et al., 2011; Daugbjerg et al., 2011; Lesjak, 2008). The quantitative analysis will be focus on effects of area payments.
Due to the lack of statistical data and few observations available make it difficult to account for the multitude of factors influencing the development of organic farming, and the lag which can be expected between policy implementation and a change in the share of organic land, it was not possible do conduct a meaningful multivariate statistical analysis. Nevertheless, some conclusions can be draw from the data available about the impact of area payments in the area under organic farming.
11
and to use the same data base, IFADAP. Thus, the application approved in the time period
2000-2003 aren’t graph because payments were delayed. Organic area share in total utilized agricultural area comes from EUROSTAT.
After 2008, It is possible to observe some correlation between direct area payments to organic farming and area under organic farmland. Until 2008, both trends had opposite behaviors, with organic area decreasing, while support area was growing. This also coincide in a change in rural development programs. One may argue, that an evaluation of the previous RDP (RURIS) provided important lines in how to address organic area direct payments.
Graph 4 – Organic Farming Direct Payments
With these direct payments support, the programs target an increase of 160 000ha in organic area. However, area under organic farming, in the time period 2007-2013, even decreased 15 080 hectares. Note that in this time period, Portugal was under a financial crisis with a need for International Monetary Fund intervention. This financial crisis did not affect the effective specific subsidies neither agri-environmental payments, that actually increase in the most severe years of crisis (2008-2010), but demand contraction (consumers less willing to pay the premium price organic products), credit restrains imposed and many default investors could have had impact in the area under organic farming.
To get a deeper understanding of organic payments, area and financial performance of organic farms, Stolze et al. (2011) framework provides an interesting complementary analysis about it. The IFADAP data was not used in the comparison because, in their data they include several agri-environmental support measures to the same hectare (e.g. farmers could apply to several
0% 1% 2% 3% 4% 5% 6% 7% 8%
€ -€2 000 000 €4 000 000 €6 000 000 €8 000 000 €10 000 000 €12 000 000 €14 000 000 €16 000 000
2004 2005 2006 2007 2008 2009 2010 2011 2012 2013 2014
Organic Farming Payments (EUR) Organic Area Share in Total UAA(%)
12
𝐴𝐸𝑂= Total Agri-environmental payments to organic farms in euros; 𝐴𝐸𝐶= Total Agri-environmental payments to
conventional farms in euros; ℎ𝑎𝑜= Economic size of Organic farms in the sample
payments, if all requirements were verified), unable comparison between total agri-environmental payments and specific effective subsidy. Moreover, there is no income data in IFADAP statistics.
For this, environmental payments and income in each holding were withdrawal from the EU Farm Accountancy Network (FADN). FADN is the agricultural data base for European Union with more detailed and directed figures about farm sector. FADN analysis are based in a representative sample of farms in each country, it gathers results about farms productivity, subsidies addressed and costs allocation. FADN data about organic farming in Portugal just starts in 2004, before there, no distinction was made between organic and no organic production. The values after 2011
aren’t processed yet, by RICA (FADN liaison agency in Portugal).
At first, the impact of the specific organic subsidy in the organic area development is evaluated. In a second stage, the financial performance of organic farms and comparable conventional ones is analyzed.
Effective support to organic farming is measured as the difference of total agri-environmental payments received by organic and comparable conventional farms, based on the principle that organic farms would at least receive the same environmental subsidy as conventional ones. Assuming that different production types receive different area payments, the same cultures were used in the comparison between organic and conventional farms.
FADN data base gives the total agri-environmental provided to each holding in sample of farms, so in order to know how much is paid in each hectare we have to divide the Economic Size (also available on FADN data base) to the area payments.
𝐸𝑓𝑓𝑒𝑐𝑡𝑖𝑣𝑒 𝑆𝑝𝑒𝑐𝑖𝑓𝑖𝑐 𝑆𝑢𝑏𝑠𝑖𝑑𝑦 (𝐸𝑈𝑅/ℎ𝑎) = 𝐴𝐸𝑂ℎ𝑎− 𝐴𝐸𝐶
𝑜
𝑇𝑜𝑡𝑎𝑙 𝐴𝑔𝑟𝑖 − 𝑒𝑛𝑣𝑖𝑟𝑜𝑛𝑚𝑒𝑛𝑡𝑎𝑙 𝑝𝑎𝑦𝑚𝑒𝑛𝑡𝑠 (𝐸𝑈𝑅/ℎ𝑎) =𝐴𝐸ℎ𝑎𝑂
𝑜
13
𝐹𝑁𝑉𝐴/𝐴𝑊𝑈𝑂= Income in Organic Farms; 𝐹𝑁𝑉𝐴/𝐴𝑊𝑈𝑤𝑜= Income in Organic Farms without the specific
subsidy
Graph 5 – Effective Specific Subsidies and Total Agri-environmental payments
Furthermore, the impact of this ‘effective’ support to organic farming on income is assessed by
subtracting the support from actual income of organic farms. The profitability of organic farms without specific support measures compared with the profitability of comparable conventional farms provides an indication of the importance of organic farming policies as a financial incentive to convert.
Thus, it will have in account competing policies, leaving both schemes of agriculture, organic and conventional, in quantitative terms under the same environmental policy support, to compare how
they preform financially. In order to get “Income” 𝐹𝑁𝑉𝐴/𝐴𝑊𝑈 was withdrawal from FADN,
which returns the Farm Net Value Added expressed per agricultural work unit.
𝐹𝑁𝑉𝐴/𝐴𝑊𝑈𝑤𝑜= 𝐹𝑁𝑉𝐴/𝐴𝑊𝑈𝑂 − (𝐴𝐸𝑂− 𝐴𝐸𝑐)
The results (Graph 6) show that in Portugal area support for organic farms played an important role for the relative competitiveness. Without the specific extra support for organic farms incomes would have been lower to those of comparable conventional farms, since 2005. Thus, the support
to organic farms was effective at maintaining relative competitiveness. It’s also possible to get
from Graph 6 a growing in the returns of organic sector. Furthermore, it seems that both production schemes, organic farming without specific subsidy and comparable conventional are converging.
0,0% 1,0% 2,0% 3,0% 4,0% 5,0% 6,0% 7,0% 8,0%
€ -€20,00 €40,00 €60,00 €80,00 €100,00 €120,00 €140,00
2004 2005 2006 2007 2008 2009 2010 2011
14
Graph 6 – Income (FNVA/AWU) of Organic and Comparable Conventional Farms
Qualitative analysis
As we have already seen thru this work, organic area payments are not the only factor with impact in the development of organic sector. Stolze et al. (2011) arrived to the conclusion, that area payments and organic action plan were the most relevant police support instruments. In addition,
favorable context factors also showed relevant impact in the sector’s development, like perceived profitability or if there are some degree of reliability in government policies.
In order to access the impact and interdependency between support measures implemented, policy relevant factors and context factors a set of interviews to Portuguese organic authorities were done. Mathias Stolze and Ingrid Jahrl (2011) matrix was used in the interviews and in the results evaluation.
To the expertise was asked to evaluate in a scale4“-2” to“2” how different factors presented in
the matrix impacted both, the number of organic farms and area, and the organic market. A set of questions (Annex E) were also addressed to the expertise, to better understand how organic sector works.
After the interviews, the average of all experts’ valuation of each factor was computed, and
according to the result a color was attributed. The results are present in the table below and in the following comments.
0,0% 2,0% 4,0% 6,0% 8,0%
€ -€5 000 €10 000 €15 000
2004 2005 2006 2007 2008 2009 2010 2011
Income (FNVA/AWU) of Organic and Comparable conventional farms
Organic Farms Comparable Conventional Farms
15 Table 2 - Estimated contributions of context policy factors to the development of organic market
According to the information collected in the interviews, in Portugal, area payments are the only policy strictly towards organic, other measures are also open for further schemes of production. It is considered the most relevant support for farmers integrated in organic schemes in the first years and are also the main attractive for new comers. With the different national rural development programs, area payments for each hectare have been increasing, encouraging other farmers to convert.
However, these area payments are mainly allocated to pasture and forage cultures which are larger in size, so even if the payments are lower for this productions they have more hectares to cover.
Increase the factor "number of organic farms and organic area"
Increase the factor "Organic market" Support measures implemented
Organic area payments
Support organic farming associations n.i. n.i.
Organic Action plan n.i. n.i.
Organic Farming extension support (measure 111) Organic Farming education and training support Support of Organic farming research
Organic farming competence centre support
Modernisation of holdings and buildings (measure 121) Support to improve quality of olive oil (Art.68) Organic Farming marketing support (measure 124, 133) Adding value to agricultural and forestry products (measure 123)
Reimbursement of organic certification costs (measure 132) n.i.
Tax foundation for supporting development of Organic Farming n.i. n.i.
Organic Conversion Information Service Setting up young farmers (RDP measure 112)
Support of renewable energy sources n.i. n.i.
Policy relevant factors
Defferences between non-organic and organic support payments Reliability & continuity of governmental support for organic farming Commitment of government towards organic farming
Collaboration between organic actors and government
Context factors
Preceived profitbility of organic farms
Preceived profitability of organic processing and retailing Pressure on conventional farmers to change
Feasibility to comply with organic regulation Farmers' attitude towards organic farming Farmers' access to organic market channels Functioning of the organic supply chain Availability of organic products to consumers Clarity of organic labelling
Role of large conventional retail chains in the organic market Domestic consumer demand for organic products
Public attention towards organic farming Activities of organic farming interest groups Availability of knowledge about organic farming
Strong positive impact Medium positive impact Zero or weak impact medium negative impact strong negative impact
16
3. This animal feed in the end of animal’s life or in scarcity grazing periods
4. Livestock is feed with conventional animal feed, unable to the organic commercialization.
Indeed, if we look at data about area covered by organic farming we have 72,3% and 6,2% of all organic area under pasture and forage, respectively. Pasture and forage cultures are used to animal
production. Nevertheless, experts argue that the majority of these animal headcounts doesn’t
arrive to the final consumer due to the costs in biologic animal feed3. Thus, animal producers get
the majority of the funds to agricultural production but headcounts are canalized to conventional
channels4.
Regarding this funds allocation to pastures, it was argued that organic payments are in large extent an environmental support measure. Therefore, even though that funds allocated to pastures have a low expression in the organic market, organic animal production brings important contribution to soils biodiversity, increasing carbon soil levels through manure contributions.
About the Organic Action Plan, just before the EOAP in 2004 was launched, a Portuguese organic action plan was created, by a join contribution of government and organic agents. But, it was never put in practices. Nevertheless, Organic action plan contributions are recognized by experts, like strategic planning, a definition of relevant targets, policy mix. A workforce, with organic organizations and government staff was created to draw a future national organic action plan.
Other support measures also affect the organic sector and bring important contributions to sector’s
development. “Organic Conversion Information Service” and “Setting up young farmers” brought
important contributions. Farmers could access to information services through DGARD services
or for more specific knowledge going to organic organizations. “Setting up young farmers”
(includes a training program and a special line of credit for famers until their 40 years old) is more an indirect measure, youngsters are in general more educated, willing to change, market oriented, have more ideas and different perspectives about the world and the environment. However, according to some, in this is training program there is a lack of courses associated with organic farming.
There are not much consensus between experts about “Organic Farming Education and Training
support”. Organic organism argue that education and training are insufficient, nevertheless there are already some University degrees or professional courses for technicians and farmers. Organic farming requires very specific technical knowledge, not only to get the most productivity results, but also to have access to area payments support measure.
“Reimbursement of organic certification costs” is included in PRODER 2007-2013, Action 1.4.1
17
There are some policy relevant factors that play an important role in the organic sector expansion.
“Reliability & continuity of governmental support for organic farming”, “Commitment of government towards organic” and “Collaboration between organic actors and government” are
consider to have a positive effect in area farmed and market. There are doubts about government consistency, in the side of organic agents and farmers, however organic farming is including in
PDR 2020 and in government’s program. There are also the undergoing process to elaborate an
organic action plan and the European Commission support to organic farming.
“Perceived profitability of organicfarms” is related with two other factors according to experts, “Farmers’ access to organic market channels” and “Functioning of the organic supply chain” this
two factors are as seen in the matrix as having a negative impact in the organic’s area and
producers. In fact margins are low for farmers in all agricultural sector in Portugal. Just referring to the organic sector, farms are in large extent small (>2ha) and cannot couple with retailers demanded production levels, this situation impair market entrance and reduce farmers bargaining power, lowering their margins. There is also a need for farmers being more market oriented
Margins on the organic retailers’ side are high, they can get organic products at a low price,
because there are a lot of small farmers and in Europe there are several countries exporting organic products, and on the other side there are consumers willing to pay a premium price for food quality
– “Public attention towards organic”. This “Perceived Profitability of organic processing and
retailing” brings new players, large conventional retailers like Auchan, Pingo Doce and Continente. The “Role of large conventional retail chains” is important in arriving to more remote
places, because those retail chains have the diversity and complementary needed to incur in lower risks.
Though, context factors and public measures were more directed to the production side, they
brought more positive contributions to the increase in organic market. According to experts’
opinions the problem is in the supply chain due to the not association between farmers’ work.
There is also a stigma between farmers, that organic production has no place in the future, yields are low and the production costs increase.
Some organic players argue that organic farmers are more moved by their own conviction about environmental concerns, animal welfare and food quality than for economic purpose, so if subsidies are not that high and margins are low, they may prefer invest in small areas to reduce their own risk.
18 Azores and Madeira for organic holding, in Mainland the organic machinery needed didn’t fulfill
the requirements to apply for this support measure
Section 4: Concluding remarks and prospects about CAP 2014-2020
In the end of this work we may conclude that policy support measures have had some impact on the organic sector development. However, some doubts about their effectiveness stand out. Organic farming measures were included in two Rural Development Programs and in the one that is in force, PDR 2020, but the correlation between area payments and the area under organic farming leaves uncertainties.
Organic area payments are considered by many authors as an important driver of organic farming development because, it compensates farmers for income forgone and conversion additional costs. Yet, previous 2004, when there are registers of the first area payments, organic farming was growing at a higher pace than in years after. From 2004 to 2008, area payments directed to organic farming seem to have an inverse relationship with the share of utilized organic area.
But this leaves the question of why there was an upward trend in the first years after EOAP 2004. It may be argued that at first with this strategic plan defined and with an organic sector growing in Europe (Austria, Germany and Netherland), big players took an interest in this niche market and invest in large areas to produce, but the lack of market channels to canalized their products, consumers informed to pay the premium for organic food and uncovered fraudulent schemes of certification, led some investors to leave the sector (after 2007 area produced and producers decreased).
The delay in delivering the subsidies or the too slow and bureaucratic process could undermine farmers access to support measures. Organic payments may not fully compensate farmers for all the application process and, also for the increase in workload, since organic farming is more demanding in terms of workforce and management practices, leaving organic farming to the more environmental concern farmers.
19
The large share of pastures was a result of the exploitation of government concerns about the soils biodiversity and a way to farmers with large Less Favored Areas (LFA) to get more incentives to produce. LFA in Portugal covers 66% of utilized agricultural area.
One of the main problems associated to organic sector in Portugal, that was point it out thru this study, was the imbalance between supply and demand. Margins are low for farmers and they have
more advantages in commercialized just for restaurants or in producer’s market, reducing the
intermediaries and rising their profit. There is also the issue associated with a continuous production level that processors and retailers demand.
To mitigate these problems farmers should associate. With the establishment of organic farms’
cooperatives, they would share the risks of production and enjoy of an enlargement of farmland
– they, for instance, could agree in a rotation scheme, with each farmer producing just one culture
in their own area and then rotating in the next year. They would increase their production levels and gaining more chances of entering in the market, because area farmed would be bigger, they could get more machinery (improving productivity levels) and share the costs of workforce (in principle if they produce independent of each other they would need the same number of workers, if they work together, on the other hand, the same worker may perform the same results working in the two farms).
The problem with farmers’ joint venture is that it lies in the principle of loyalty. Farm cultures
fluctuate more with the commodity prices than with the subsidies paid, so if they agree in a production scheme, one would have lower returns for each unit he sells these may undermine their association.
Area payments may not be the solution for the organic sector development. The solution could lie in creating mechanisms to solve the supply chain strangulation. Being government or a special unit created, responsible to manage cooperatives.
Organic farmland has a large share of livestock production areas (pasture and forage) and a lack of fruits and vegetables areas. Pastures receive a big deal of support area payments because of the environmental contribution that it brings, for the animal welfare and the soils biodiversity. However, this leaves other production types, that have in fact more production costs associated, with no financial support.
So with area payments, government in many cases is compensating farmers for the environmental
contribution that they bring. CAP’s and by consequence Member States’s, organic farming policy
seem to focus in environmental contributions, not in the sector economic viability. In fact, Action 7.1 – “Organic Farming” is included in Priority 4 of PDR 2020, “Restoring, preserving and
20
21
References
Ana Cristina Fernandes, Miguel Déjean Guerra, Rita Ribeiro, Sofia Rodrigues, 2015,
Relatório do Estado do Ambiente 2015; 95-96
Argilés J. M. and Brown N Duch, 2010, “A comparison of the economic and environmental
performances of conventional and organic farming: evidence from financial statements”;
Agricultural Economics Review; Vol 11, No 1; 69-86
Batte, M.T., Hooker, N.H., Haab, T.C. and Beaverson, J., 2007, “Putting their money where
their mouths are: consumer willingness to pay for multi-ingredient, processed organic food
products”. Food Policy 32(2): 145-159.
Centro de Estudos e Formação Avançada em Gestão (CEFAG), ERENA, Centro
Interdisciplinar de Estudos Económicos (CIDEC), 2003, Estudo de Avaliação Intercalar do
Plano de Desenvolvimento Rural de Portugal Continental; Relatório Final; vol I
Council Regulation (EEC) No 2092/91, 24th June 1992, On Organic production of agricultural
and indications referring thereto on agricultural products and foodstuffs
Daugbjerg C, Tranter R, Hattam C, Holloway G, 2011, “Modelling the impacts of policy on
entry into organic farming: Evidence from Danish-UK comparisons, 1989-2007”, Land Use
Policy, 413-422
European Commission, 2002, Analysis of the possibilities of a European Action plan for organic
food and farming
European Commission (EC), 2014, Portugal Common Agricultural Policy
Gil, J.M, Gracia, A. and Sánchez, M, 2000; “Market segmentation and willingness to pay for
organic products in Spain”, International Food and Agribusiness Management Review 3:
207-226
Instituto Superior Técnico, Avaliação Ex-Ante do Programa de Desenvolvimento Rural
2007-2013 do Continente, Relatório Final
Jürn Sanders, Stefanie Metze and Geral Schwarz, 2011, “Public policy measures addressing
organic farming under the current rural development programmes”,Use and efficiency of public
support measures addressing organic farming; Part A; 5-32
Lesjak HA 2008, Explaining organic farming through past policies: comparing support policies
22
Mathias Stolze and Ingrid Jahrl, 2011, “Contribution of public support measures addressing
organic farming to the development of the organic sector”, Use and efficiency of public support
measures addressing organic farming; Part B; 67-92
Mathias Stolze, Raffaele Zanoli and Stephen Maredith, 2016, “Organic in Europe: Expanding
Beyond a Niche”, Organic in Europe Prospects and Developments 2016; 12-19
Michelsen J., 2001, “Recent Development and Political Acceptance of Organic Farming in Europe”; Sociologia Ruralis; Vol 41, Issue 1; 3-20
Rigby, D., Young, T., Burtoon, M., 2001, The development of and prospects for organic farming
in the UK, Food Policy 26: 599-613
Torben Rankine, 2008, “Portugal”, The Specialised Organic Retail Report Europe 2008
William Lockeretz, 2007, “What Explains the Rise of Organic Farming?” Organic Farming: An
23
Annex
3 100 000 3 200 000 3 300 000 3 400 000 3 500 000 3 600 000 3 700 000 3 800 000
2000 2003 2005 2007 2009 2013
Annex A - Total Farmland
Conventional Farmland (ha) Organic land (ha)
Annex B - Total Costs and Coverage Levels
Income forgone (EUR/ha) Additional specific costs (EUR/ha) Total Costs (EUR/ha) Area payments (EUR/ha) Payment's coverage
(1) (2) (3)=(1)+(2) (4) (5)=(4)/(3)
Irrigated Fresh Fruits 550 457 1008 900 0,9
Nonirrigated Fresh Fruits 675 44 720 720 1,0
Irrigated Olive and Dried Fruits 276 230 506 510 1,0
Nonirrigated Olive and Dried Fruits 75 170 245 236 1,0
Vineyards 382 161 543 490 0,9
Temporary Irrigated Cultures 221 164 386 356 0,9
Temporary Nonirrigated Cultures and
Forgage cultures 42 56 99 76 0,8
Outdoor Vegetables 1357 159 1516 600 0,4
Greenhouse Vegetables 2549 297 2846 600 0,2
Permanent Pastures 85 85 170 172 1,0
Biodiverse Permanent Pastures 106 102 208 210 1,0
Production Type
Annex D - IFADAP Payments
Agro-Environmental
Payments Organic Farming
Agro-Environmental
Payments Organic Farming
Agro-Environmental
Payments Organic Farming
Agro-Environmental
Payments Organic Farming
Agro-Environmental
Payments Organic Farming
Agro-Environmental
Payments Organic Farming
Agro-Environmental
Payments Organic Farming 2004 112 006 000,00 € 7 998 000,00 €
2005 112 942 000,00 € 8 321 000,00 €
2006 101 722 000,00 € 7 402 000,00 €
2007 67 899 000,00 € 5 754 715,17 €
2008 36 124 000,00 € 3 082 000,00 € 29 125 000,00 € 7 189 000,00 € 94 000,00 € 6 000,00 € 6 497 000,00 € 35 000,00 € 1 344 000,00 € - € 517 000,00 € 64 000,00 €
2009 47 574 990,00 € 11 415 290,00 € 463 500,00 € 30 110,00 € 40 380,00 € 7 179 110,00 € 934 290,00 € - € 238 250,00 € 14 810,00 €
2010 60 408 520,00 € 13 499 410,00 € 720 670,00 € 43 990,00 € 47 918,68 € 7 605 945,95 € 789 330,00 € - € 81 390,00 € 17 340,00 €
2011 68 165 916,36 € 14 459 564,87 € 861 458,74 € 84 553,79 € 8 640 033,24 € 55 653,65 € 63 757,20 € - €
2012 68 284 763,91 € 13 806 589,84 € 732 267,26 € 72 717,40 € 8 903 622,76 € 82 731,31 € 11 724,24 € - €
2013 67 560 574,25 € 12 942 390,87 € 743 084,24 € 73 805,67 € 8 690 865,15 € 78 984,24 € 11 724,24 € - €
2014 603 693,37 € 66 452,49 € 63 833 806,65 € 11 968 174,81 € 6 369 464,32 € 56 831,72 €
Total 430 693 000,00 € 32 557 715,17 € 341 119 764,52 € 73 312 245,58 € 4 218 673,61 € 377 629,35 € 39 189 284,15 € 15 094 256,87 € 3 154 825,68 € - € 836 640,00 € 96 150,00 € PDRu-M
PDR 2020 PDRu-A
24
Annex C – Measures associated with organic farming beyond Area Payments
Measure 111/114 –“Vocational training and information actions” / “Use of advisory
services”
This measure is not directly related with organic farming because it hasn’t been exclusively used
for supporting organic farming. It also trains and advise non-organic farmers. This measure is
encompassed in young farmers’ program. Those advisory services and formation programs are
provided by organic organizations and in Rural Development Directive Center.
Measure 121 –“Modernization of agricultural holdings”
In Madeira higher grants are given to organic farmers to invest in agricultural holdings. In RDPs of Azores organic farming is mentioned or defined as one of a number of prioritized target groups, applications are selected on the basis of a range of criteria, as the contribution of the investment to the environment, climate biodiversity, animal welfare and quality of food products.
Measure 132/133 – “Participation of farmers in food quality schemes” /
“Information and promotion”
This measure covers up to 100% of the certification and inspection cost incurred by farmers, however this measure, it was only exercised in 2008 though it is included in PRODER 2007-2013.
“Information and Promotion” measure supports advertising, tasting events or participation in fair and exhibitions for products or foodstuffs covered by approved quality schemes, but it was dropped, being marketing action just launched by organic organizations and market players.
Annex E -Broad Questions
1. Which factors are expected to have an important impact on the number of farms, the organic
area and the organic market in the future?
a. What are the mutual impacts between the most relevant factors?
2. How could (e.g. through policy design, framework conditions) the effectiveness and efficiency
of the current policy support measures for the organic farming be improved?
3. What is the coherence of policy in support for the organic sector in Portugal?
4. What were the reasons that supporting organic farming is considered an important (not
important) instrument in the national/regional agricultural and rural development policies?
5. What could be done to improve the Pillar 2 of the CAP (Rural Development Program) in the
next period (2014-2020) to achieve better support policies for the organic sector?
6. How could the co-ordination between the regional/national rural development programs and