ASSOCIAÇÃO DE POLITÉCNICOS DO NORTE
(APNOR)
INSTITUTO POLITÉCNICO DE BRAGANÇA
International beer market: drivers and challenges of development
Astapenka Kseniya
Final Dissertation presented to
Instituto Politécnico de Bragança
To obtain the Master Degree in Management, Specialisation in Business
Management
Supervisors:
Ana Paula Monte
Alena Petrushkevich
ASSOCIAÇÃO DE POLITÉCNICOS DO NORTE
(APNOR)
INSTITUTO POLITÉCNICO DE BRAGANÇA
International beer market: drivers and challenges of development
Astapenka Kseniya
Supervisors:
Ana Paula Monte
Alena Petrushkevich
Abstract
The uncertain conditions in the beer market related with the tendency on downsizing of consumption of alcoholic beverages in favour to non alcoholic ones have invoked the need to determine competitive advantages of the brewery companies in the international market. At the same time, it is interesting to analyse competitiveness of Belarussian and Portuguese breweries in the international beer market taking into account different location, finance, government regulation, etc.
The main purpose of this research is to study the situation in the International beer market in order to
estimate the prospects of Belarussian and Portuguese beer companies’ development. Therefore, the
objectives of the research are (i) to analyse international beer market, dynamics of sale volumes and prices, regulatory framework; (ii) to analyse Belarussian and Portuguese beer market and to determine its prospects; and (iii) to analyse competitiveness of Belarussian and Portuguese breweries in the international beer market.
To achieve these objectives, it was applied techniques and methods to analyse the competitiveness of
the market such as Porter’s analysis, SWOT and PEST analysis and others, using qualitative and quantitative analysis, secondary and primarily data (using sources from OECD databases, national institute of statistics and government statistics and others).
According to the results of the analysis of all collected data, Portuguese beer market is bigger than Belarusian one in production, consumption and export volumes. Portuguese company UNICER is well-known company with higher level of competitiveness in comparison with Belarusian company «Krinitsa», however «Krinitsa» has opportunities to launch new products, enter new markets and increase their sales on existing ones.
Resumo
As condições incertas no desenvolvimento do mercado internacional de cerveja, relacionadas com a diminuição do consumo de bebidas alcoólicas a favor das não alcoólicas invocaram a necessidade de determinar as vantagens competitivas das empresas cervejeiras no mercado internacional. Ao mesmo tempo, é interessante analisar a competitividade das cervejarias bielorrussas e portuguesas no mercado internacional de cerveja, tendo em conta diferentes localizações, finanças, regulamentação governamental, etc.
O principal objetivo desta pesquisa é estudar a situação no mercado internacional de cervejas, a fim de estimar as perspetivas do desenvolvimento das cervejarias bielorrussa e portuguesa. Portanto, os objetivos da pesquisa são (i) analisar o mercado internacional de cerveja, dinâmica de volumes e preços de venda e enquadramento regulatório; (ii) analisar o mercado da cerveja bielorrussa e portuguesa e determinar as suas perspetivas; e (iii) analisar a competitividade das cervejarias bielorrussas e portuguesas no mercado internacional da cerveja.
Para atingir os objetivos foram aplicadas técnicas e métodos para analisar a competitividade do mercado, tais como análise de Porter, análise SWOT, PEST entre outras, recorrendo à análise qualitativa e quantitativa de dados primários e secundários (utilizando bases de dados da OCDE, do Instituto Nacional de Estatística e estatísticas governamentais, entre outros).
De acordo com os resultados da análise de todos os dados recolhidos, o mercado da cerveja portuguesa é maior do que o da Bielorrússia (volumes de produção, consumo e exportação). A empresa portuguesa UNICER é uma empresa bem conhecida e com maior nível de competitividade em comparação com a empresa bielorrussa «Krinitsa». No entanto, esta tem oportunidades para se desenvolver, lançar novos produtos, entrar em novos mercados e aumentar as vendas nos já existentes.
Реферат
Неопределенные условия развития международного рынка пива, связанные со снижением потребления пива в пользу слабоалкогольных напитков, привели к необходимости определения конкурентных преимуществ пивоваренных компаний на международном рынке. В то же время интересно проанализировать конкурентоспособность белорусских и португальских пивоваренных заводов на международном рынке пива с учетом различного местоположения, финансового положения, государственного регулирования и т. д.
Основная цель этого исследования - изучить ситуацию на международном рынке пива, чтобы
оценить перспективы развития белорусскихи португальских производителей пива. Поэтому цели исследования следующие (i) проанализировать международный рынок пива, динамику объемов
продаж и цен, нормативную базу; (ii) проанализировать рынок пива Республики Беларусь и
Португалии и определить его перспективы; (iii) проанализировать конкурентоспособность
белорусских и португальских пивоваренных заводов на международном рынке пива.
Методология исследования предполагает использование методов и способов для анализа конкурентоспособности рынка, такие как анализ Портера, анализ SWOT и PEST и другие, с использованием качественного и количественного анализа, а также первичные и вторичные данные (с использованием источников из ОЭСР базы данных, национального института статистики и государственной статистики и другие).
В соответствии с результатами, полученными в ходе исследования, можно сказать, что португальский рынок пива больше, чем белорусский по объему производства, потребления и поставок на экспорт. Португальская компания UNICER, хорошо знакомая для потребителей,
обладает более высоким уровнем конкурентоспособности по сравнению с ОАО «Криница», однако у нее есть возможность развиваться, выпускай новые продукты, выходить на новые рынки
и увеличивать продажи на ужесуществующих.
Acknowledgements
Firstly, I would like to acknowledge my beloved family: my parents for the unconditional support and for providing me all the opportunities throughout my life. I would also like to acknowledge my sister and friends for their love and belief in me. My deepest thanks go to my boyfriend for his love, support and help during all difficult situations. Without all of you I would have never reached this.
I would like to say thanks to OJSC «Krinitsa» for my first job experience, possibility to develop my skills and self-realizing, for data used in the research. I am very grateful to Portuguese company
“Informa D&B” for providing necessary data and information about UNICER.
Another thanks go to my supervisor, who has given to me valuable advices, has had time and has been helpful during this research: Ana Paula Monte.
Acronyms
ABV – Alcohol by volume BYN - Belarussian ruble
CAGR - Compounded Average Growth Rate CIS – Commonwealth of Independent States CP – Competitive position
CPM – Competitor Profile Matrix
CRM – Customer Relationship Management daL - decalitre
EU – European Union FP – Financial Position
GATT - General Agreement on Tariffs and Trade hl – hectolitre
IP – Industry Position JSC – Joint Stock Company MFN - Most Favored Nation
OJSC – Open Joint Stock Company
PEST – Political, Economical, Social, Technological PET - polyethylene terephthalate
SCC - Sociedade Central de Cervejas e Bebidas SP – Stability Position
SPACE Matrix - Strategic Position and Action Evaluation Matrix SWOT – Strengths, Weaknesses, Opportunities, Threats VAT - value-added tax
WTO – World Trade Organisation UK – United Kingdom
Table of Contents
List of Figures ... vii
List of Tables ... viii
Introduction ...1
1.1 Theory of International Trade ...3
1.2 The system of International Trade regulation ...6
1.3 The industry and business’ competitiveness in the global market ... 11
2. Research Methodology ... 21
2.1. Objective of the study and Research Hypotheses ... 21
2.2. Data and collection methods ... 21
2.3. Methods and techniques of industry and company’s competitiveness analysis ... 22
3. Presentation and Analysis of the Results ... 26
3.1 Analysis of the Belarussian and Portuguese beer market... 26
3.1.1 The brewery market and industry in Portugal ... 28
3.1.2 The brewery market and industry in Belarus ... 34
3.2 The competitiveness of the companies in the international market ... 41
3.2.1 The competitiveness of OJSC «Krinitsa» (Republic of Belarus) ... 41
3.2.2 The competitiveness of UNICER (Republic of Portugal) ... 51
3.2.3 The comparison of the performance of the two companies UNICER and «Krinitsa» ... 59
3.3 The prospects of development for Belarusian and Portuguese company ... 63
Conclusions, Limitations and Future Research Lines ... 68
References ... 70
List of Figures
Figure 1. An illustration of SPACE matrix chart ... 17
Figure 2. A value-chain analysis ... 18
Figure 3. Competitor Profile Matrix ... 20
Figure 4. Porter’s five strengths ... 28
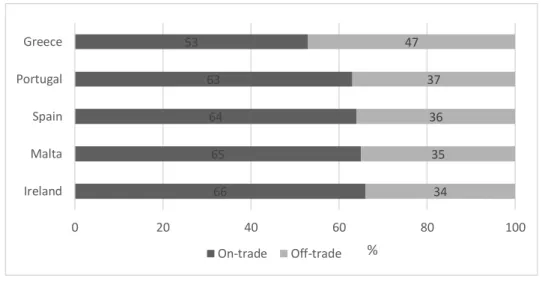
Figure 5. Sales volume on-trade/off-trade in 2016 (in %) ... 31
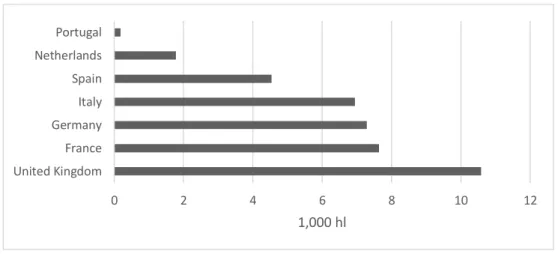
Figure 6. Import volumes in 2016 (in 1,000 hl) ... 32
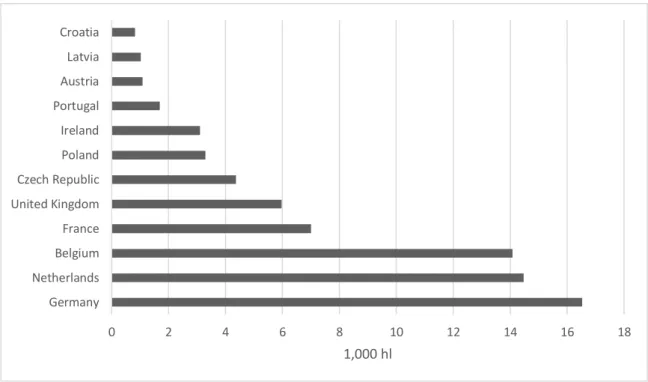
Figure 7. Export volumes in 2016 (in 1,000 hl) ... 33
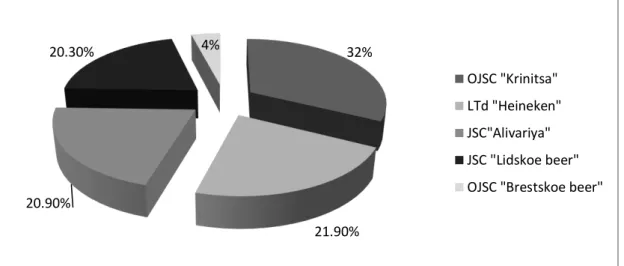
Figure 8. Distribution of beer production among enterprises of the Republic of Belarus ... 36
Figure 9. Share of imported beer in consumption in Belarus, % ... 38
Figure 10. The structure of OJSC «Krinitsa»... 43
Figure 11. Value chain of OJSC «Krinitsa»(primary activities) ... 47
Figure 12. Value chain of OJSC «Krinitsa»(secondary activities) ... 48
Figure 13. SPACE Matrix of OJSC «Krinitsa» ... 50
Figure 14. Indicators for SPACE Matrix of OJSC «Krinitsa» ... 50
Figure 15. The structure of UNICER ... 53
Figure 16. Value chain of UNICER ... 54
Figure 17. SPACE Matrix of UNICER ... 58
Figure 18. Indicators for SPACE Matrix of UNICER ... 59
Figure 19. The trend for sales of OJSC «Krinitsa» in 2018 ... 64
Figure 20. The trend for sales of UNICER in 2018 ... 65
Figure 21. The trend for export sales of OJSC «Krinitsa» in 2018 ... 66
List of Tables
Table 1. Ratio analysis ... 24
Table 2. PEST - analysis of world beer market ... 27
Table 3. Beer production in Portugal from 2010 till 2016 (in 1,000 hl) ... 28
Table 4. Beer consumption in Portugal from 2010 till 2016 (in 1,000 hl) ... 29
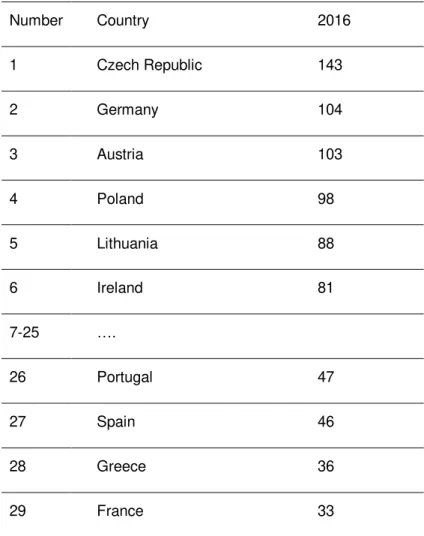
Table 5. Beer consumption per capita in 2016 (in liters) ... 30
Table 6. Import volumes in 2016 (in 1,000 hl) ... 32
Table 7. Export volumes (in 1,000 hl) ... 33
Table 8. Beer production in Belarus from 2010 till 2016 (in 1,000 hl) ... 36
Table 9. Beer consumption in Belarus from 2010 till 2016 (in 1,000 hl) ... 37
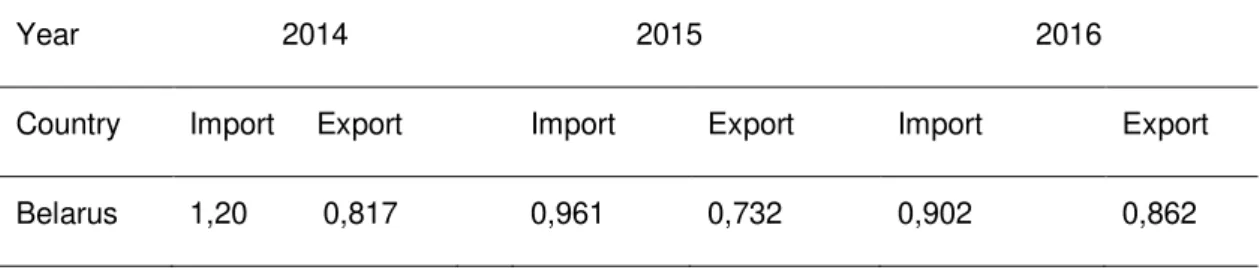
Table 10. Export and import volumes (in 1,000 hl) ... 37
Table 11. Export and import volumes in first 7 months of 2016 and 2017 year (in 1,000 hl) ... 38
Table 12. The subsidiaries and representatives of OJSC «Krinitsa» in foreign countries ... 42
Table 13. Export volumes of OJSC «Krinitsa» in 2015 and 2016 year (in 103 Euro) ... 44
Table 14. Geographical structure of export volumes of OJSC «Krinitsa» in 2015 and 2016 year (in 103 daL and Euro) ... 44
Table 15. Economic indicators of OJSC «Krinitsa» activities in 2015 and 2016 year ... 46
Table 16. Consumer price index for alcohol beverages from 2013-2016 ... 46
Table 17. SWOT analysis for OJSC «Krinitsa» ... 49
Table 18. The subsidiaries and representatives of UNICER in Portugal and in foreign countries ... 52
Table 19. Economic indicators of UNICER activities in 2015 and 2016 year... 55
Table 20. Export volumes of UNICER in 2015 and 2016 year (in 103 Euro) ... 55
Table 21. SWOT analysis for UNICER ... 57
Table 22. Ratio-analysis for UNICER and OJSC «Krinitsa» in 2016 ... 60
Table 23. Competitor Profile Matrix for OJSC «Krinitsa» and UNICER ... 62
Introduction
Beer is one of the most popular beverages all over the world. The mass market of this product is presented by several big multinational companies, which create oligopoly on this market. That is why it is very difficult to compete with them for ordinary producers even if they have necessary capacity, financial and human resources, good quality of products. At the same time, several changes on the market (decreasing of consumption, decrease of population’s purchase power, changes in
consumers’ preferences, healthy lifestyle, etc.) lead to new barriers for improving performance of the company.
Portuguese and Belarusian companies are in a similar situation, although 44% of UNICER’s capital
is owned by Carlsberg Group (a global brewer). OJSC «Krinitsa» and UNICER are not the giants of world beer industry, but they produce quality goods and sell them on domestic and foreign markets. For this reason, the main purpose of the research was chosen as to study the situation in the international beer market in order to estimate the prospects of Belarussian and Portuguese beer
companies’ development.
To achieve the main purpose of the study is important to define and analyse the following aspects: international beer market, dynamics of sale volumes and prices, regulatory framework; Belarussian and Portuguese beer market; competitiveness of Belarussian and Portuguese breweries in the international beer market.
The first section of the research is the literature review related to the theory of international trade and the system of international trade regulation. These theoretical aspects will help to understand the origin and the reasons of international trade and show different ways of trade regulation on the world market and how it influences on the development of the companies. The last subsection will present information about definitions of companies and industry’s competitiveness and how it can be estimated.
The second section will include objectives and hypotheses of the study and methods, which will be
applied in the research for defining company’s competitiveness. The main methods, which are used
in the research, are modern strategic techniques used by companies for defining their position on the market: SWOT analysis, Porter’s framework, The Space Matrix, PEST analysis, etc.
The hypotheses will be stated and verified during the research to check that international beer market is characterized by a decrease in sale volumes and that the competitiveness of Portuguese company is higher than Belarussian one.
also will include the comparison of financial rates to estimate financial condition of the companies. At the end of the section, the prospects of development will be represented according to different ways of forecast of sales for 2018 year.
1. International Trade as the main form of international economic
relations
1.1 Theory of International Trade
The most common definition of international trade is that it is goods and services exchange amongst the countries of the world economy (“Introduction to international trade”, 2017). Other definition is very similar to the first one. International trade is the exchange of capital, goods, and services across international borders or territories (Vasudeva, 2011).
Other statement says that international trade is the trade between residents of different countries (Kozak & Gribincea, 2016). The residents can be physical agents, commercial and non-commercial organizations. International trade means the unbound goods and services exchange among trade agreement members. For this reason, both parties must be sure that they will get benefit, in other case the agreement will not be concluded. International trade in goods was the first. Only at the end of the 20th century, different forms of financial transactions began to play the main role (Kozak &
Gribincea, 2014).
An important feature of international trade is geographic and commodity structure. Geographical structure of international trade is the distribution of the trade flows between countries and their groups, which are created on the territorial or organizational basis (Kozak & Gribincea, 2014). Territorial geographical structure includes data of international trade of countries, which are situated in the same part of the world. At the same time, it can be a big group of countries (developed countries, developing countries, countries with economies in transition). Organizational geographical structure includes data of international trade between countries, which belong to political associations or are grouped according to some principles (oil-exporting countries, countries that have debts, etc.) (Kozak & Gribincea, 2014).
economies’ of each country. A country has the competitive advantages only if internal prices on export are lower than the world prices. It is caused by different production costs, which depend on two groups of factors. The first group of factors is formed by natural competitive advantages. There are some examples: climate, availability of mineral fossils, soil fertility etc. The second group of factors is included the gained competitive advantages, which have been achieved in the process of the development of economy. These advantages are characterized by scientific, technical and economic level of the development of the country, industrial and social infrastructure, scales of research projects (Kozak & Gribincea, 2014).
What are the reasons of international trade existing? First of all, each nation should produce goods for which its domestic costs are lower than other nations have. At the same time, country should exchange those goods for products that have higher domestic costs compared to other nations (“Introduction to international trade”, 2017). In addition to comparative advantage, other reasons for trade are (“Introduction to international trade”, 2017):
- Differences in resources’ quantity: countries have different amounts of land, labor, and capital. For example, Saudi Arabia may have a lot of oil, but perhaps not enough water. Japan may be able to produce technological goods of high quality, but it may lack a lot of natural resources.
- Benefits of specialization: this factor can be explained by economies of scale from specialization, when long run average cost declines as output increases.
- Political benefits: countries can have close relations with some others, which dive them more trade opportunities.
- Efficiency gains: domestic firms should be obligated to become more efficient in order to be competitive in the global market.
- Benefits of increased competition: a higher degree of competition leads to lower prices for consumers, greater responsiveness to consumer wants and needs, and a wider variety of products. The theories and models of international trade have different approaches and reasons for analyzing and explaining international trade existence, but there is a common idea that international trade gives benefits to each country from a normative point of view. Actually international trade is not just a competitive game, but it has positive effects on social welfare and consumers’ surplus. It is beneficial for the group of countries trading in spite of such disadvantages as job outsourcing to foreign countries or demand for goods and services replacing from one country to another (Goldin & Reinert, 2007).
At the same time, all economic theories of international trade say that it increases efficiency. Increased international trade give the benefits to the country: to alleviate poverty in result of job creation, increased competition, improvements in education and in health, and technological learning. However, the influence of trade openness depends on many things, such as the relationship between trade reforms and other reforms and corresponding actions at the national and international levels (Kling, 2008).
the prices in world markets and the prices that will be in home markets without trade. So, if the difference is large, a country earns a large advantage from trade and vice versa (Kling, 2008). Another important benefit that international trade gives to the country is dynamism and innovation within an economy. It leads to improvements and developments in manufacturing quality and productivity. We can suppose that the closed economy has inefficient industries. The most closed countries tend to be the poorest in the world. In addition, countries that have reduced trade barriers tend to be among the fastest-growing nations (Kling, 2008).
International trade has some specific features that differ it from domestic trade. There can be listed government regulation of international trade; independent national economic policy; social and cultural differences between countries; financial and commercial risks (“Main Specific Features of International Trade”, 2017).
The first feature that should be discussed is socio-cultural differences between countries. All countries differ from each other in culture and customs, language, priorities. Despite these differences do not influence on the international trade significantly, but they perplex the relations between the governments of different countries and add many new objects to the job of the international companies. If company wants to work with another companies without distrust, it is important to have knowledges of the customs and laws of it (“Main Specific Features of International
Trade”, 2017).
The second feature of international trade is financial and commercial risks. There are two main financial risks, such as currency and credit risks. The countries have different currency systems. It determines the exchange of one currency for another (Dubey, Mishra & Iyer, 2015). In the case of the instability of exchange appears a currency risk. It is a risk of the foreign exchange losses in results of exchange rate change of the currency of price comparative to the currency of payment during the period of the signing of foreign trade contract and making the payments under this agreement (Dubey, Mishra & Iyer, 2015). The main importer’s problem is the necessity of buying foreign currency in order to pay for goods. Currency risk appears for the importer when the exchange rate of the currency of price is increased relative to the currency of payment. Exporter also may have the problem of foreign currency exchange. He losses when the exchange rate of the currency of price falls relative to the currency of payment. At the same time, another important question is time for transportation of goods to foreign country (Dubey, Mishra & Iyer, 2015). That is why the exporter has credit risk and suffers from inconveniences associated with the distance and time between transportation and payment.
Commercial risks associated with the possibility not to get profit or have losses in the process of trade. It can be in the following situations: refusal of payment by the customer; changes in product prices; reduced demand for goods; bankruptcy of the buyer; different restrictions of transferring funds to the country of the exporter (“Main Specific Featuresof International Trade”, 2017).
1.2 The system of International Trade regulation
Each country performs using their own legal system. The government has under his strict control the international trade, monetary and financial relations. So the government of each independent country makes its own system of regulations: export and import licensing, import and export quotas, duties, embargoes, export subsidies with its trade and fiscal policy. The policy can be directed to the regulation of the foreign currency inflow and outflow and regulation of standards regarding to quality, safety, health safety, hygiene, patents, trademarks, packaging of products and the amount of information that is provided on the packaging (Aggarwal & Huelin, 2011).
Government regulation of international trade has influence on trade relations with other countries. The main purposes of foreign trade regulation are (Aggarwal & Huelin, 2011):
- the volume change of exports and imports; - the structure changes of foreign trade;
- providing the country with the necessary resources.
There are two different types of foreign trade policy: liberalization (free trade policy) and protectionism. They characterize the measure of government intervention into international trade. Liberarization is the minimum of goverment intervention in foreign trade, which is based on the basis of market forces of supply and demand. Protectionism is the policy, which means the protection of the domestic market from foreign goods with the help of tariff and non-tariff instruments (Fouda, 2012).
The basic of foreign trade regulation is a market in the conditions of free trade policy, because the protectionism practically puts out the mechanism of demand and supply. So economic potential and competitiveness of separate countries is different at the global market. Though, market forces can be unprofitable for the less developed countries. Boundless competition from the more developed countries can lead to some negative aspects in less-developed countries. The protectionism encourages to the development of some industries in the country. However, the extraction of the flow of foreign goods reduces the interest of domestic companies, what can lead to decreasing of scientific and technological progress, the efficiency of production (Fouda, 2012).
There are four forms of protectionism (“International trade policy”, 2017):
- selective protectionism (it is turned against some countries or some goods); - industrial protectionism (it exists to protect some industries);
- collective protectionism (this type is used by the countries of one economic integration organization to direct against the countries, which do not belong to a union);
There are social, economical and political arguments supporting protectionist measures in each
country. For this reason, let’s write some of them: increase of domestic employment; diversification for the advantage of stability; protection of new industries; protection from dumping (“International trade policy”, 2017).
A major reason for protection is unemployment and in fact, this claim is reasonable. Import goods decrease the demand for the same domestic goods and can lead to unemployment in areas where
they are made. However, these human resources can’t stay without using, because we live in a world of limited ones. But free trade does not so much affect employment, as it changes the type of employment. The unemployment causing by free trade is the short-term one that can be solved by such methods, as professional retraining, moving to a new place (Kozak & Gribincea, 2016). The next argument is diversification for the advantage of stability. This argument touches the fact that trade barriers are obligatory for industrial diversification. In reality, diversification provides internal stability and helps to protect the national economy from the decline in production in foreign countries from unplanned fluctuations in supply and demand for one or two products. Nevertheless, at the same time the costs of diversification can be huge, significant and inefficient. Moreover, this argument cannot be attributed to already diversified economies (Kozak & Gribincea, 2016).
Another argument is protection of new industries. This argument of protecting new industries can be approved by the fact that their production begins to be competitive only after some time (Kozak &Gribincea, 2016). They have to achieve a competitive level of production costs only through some time. For example, the automobile production in Brazil and South Korea has reached the competitiveness because of national protection. However, there are other examples where such measures did not help. Thus, the automobile production has stayed weak in Argentina and Australia (Kozak & Gribincea, 2016).
The last argument is protection from dumping. Dumping is the sale of goods lower than their costs. This measure can be used to exclude competitors, for establishing monopoly and increasing of the prices (Kozak & Gribincea, 2016).
Therefore, it is necessary for state to find a balance between the two tendencies: free trade and protectionism. Each policy has its advantages and disadvantages, which depend on such things as the circumstances, time and place of use (Kozak & Gribincea, 2016).
There are two groups of the state regulation instruments of international trade. The first one is tariff methods. They regulate mostly the imports and protect national companies from foreign competition, because they make foreign goods less competitive. The second one is nontariff methods, which are directed to imports and exports. They help to bring more national goods on the world market, making them more competitive (Kozak & Gribincea, 2016).
1) the average level of customs tariff. This indicator is calculated only for the import goods which are imposed by duties. It is determined as the average rate of import duties, in accordance with the evaluation of imported goods;
2) the average level of nontariff barriers. It is determined as the share of value of the imports or exports, which are subject to the restrictions.
Customs tariff is the main and the oldest instrument of foreign trade policy. This is a systematic group of customs rates, which are imposed on import or export goods of the country’s customs territory. A customs duty is a tax on goods and services which are moved across the customs border of the country (Kozak & Gribincea, 2016).
Three main functions of duties can be named: fiscal, protectionist and balance. Fiscal function concludes with the cases, when duties are used as way of getting money for the state. This function refers to import and export duties. Protectionist function concludes the cases, when duties are used to protect domestic companies from foreign goods. The third function is balance one. It includes the cases for preventing from undesirable exports of goods, on which domestic prices are lower than on the world market (Kozak & Gribincea, 2016).
It should be added that the other trade restrictions are also used for international trade regulation. There are more than 800 methods of non-tariff restrictions, which are often used (Kozak & Gribincea, 2013). For example, administrative, financial, credit and others. More than half of world trade is the subject of non-tariff barriers that create major threat to the global trading system. According to the United Nations’ figures, Middle East countries and North African countries (57,69%) and developed countries (48,24%) most frequently use non-tariff methods in their export of agriculture products; in the export of mineral products and fuels - Europe and Central Asia (6,72%); in the export of industrial products - Latin America and the Caribbean (11,68%) (Kozak & Gribincea, 2013).
The prevalence of non-tariff barriers is explained by the fact that their use is the prerogative of the government, bacause they are not regulated by international agreements. Governments can apply any type of non-tariff barriers, which is not acceptible with the tariffs, regulated by World Trade Organization (WTO). At the same time, non-tariff barriers usually do not influence on increase of the goods price at once. So a consumer does not perceive their effect in the form of an additional tax (Kozak & Gribincea, 2016). Non-tariff barriers can be divided into the following groups: quantitative, hidden and financial ones.
Quantitative restrictions include quotas, licensing, “voluntary” export restraints (Kozak & Gribincea, 2016). Hidden non-tariff barriers include: technical barriers, internal taxes and charges, public procurements, local content requirements. Financial methods of trade policy include: dumping, subsidies, export crediting.
agreements. It means that trade measures are regulated by participating countries. For example, the General Agreement on Tariffs and Trade, the General Agreement on Trade in Services (Amadeo, 2018). The goverment can use each of approaches in any variations.
So now it is necessary to provide information about organisations and agreements between countries which are directed to monitor, control and regulate international trade. First of all, it is World Trade Organization (WTO). WTO is the leading world trade controller. It controls realization of many-side trading agreements and pacts, make decisions in trade debates, conducts many-sided trade negotiations, monitors national trade police of countries-participants, cooperates with international special organizations (Kozak & Gribincea, 2016).
The main goals of the WTO are liberalization of international trade by means of regulation mostly with tarrif-barriers and at the same time decrease of the import duties level in series, elimination of different non-tarrif barriers and quantity limitations (Kozak & Gribincea, 2016). Achievement of these goals will guarantee the reinforcement of the global economy, investment growth, rise of employment level and incomes worldwide. The main principles of the WTO are (Kozak & Gribincea, 2016):
1) Non-discrimination. It means that members of the WTO do not have to discriminate their trade partners and foreign goods. It is realized on the basis of regime of the most favored nation (MFN) treatment;
2) The members of the WTO should make more beneficial conditions;
3) After for a season the amount of trade barriers should be reduced in the countries-members of the WTO;
4) Predictability. It means that countries should inform about their use of certain instruments of trade policy and publish legislative and normative acts regarding the trade policy in the media; 5) Fair competition. It means conduction of competitive fight using fair and legal methods, which
don’t break common standarts of bussiness. The main types of bussiness practice, which are forbidden by the majority of competitive legislations, are: agreements between competing firms producing identical or similar products; abuse of dominant position; merging of companies; 6) Promotion of development and economic reforms. This principle can be achieved through the
creation of the conditions of the potential benefits of participation in the international trade for its members.
The main rules of trade in goods are defined in the General Agreement on Tariffs and Trade 1994,
which consists of four parts: “Generalities”, “Rules of trade policy”, “Procedural issues” and “Trade and Development” (Kozak & Gribincea, 2016). There are four basic rules fixed by the General Agreement on Tariffs and Trade (GATT) in practice of international trade regulation (“World Trade
Organisation”, 2018):
GATT requires that protection was carried out using tariffs. The use of quantitative restrictions (import quotas, bileteral quotas, prohibitions and etc.) is prohibited.
II. The second rule: tariff rates must be decreased and be bound to avoid further increases. States should provide that the tariffs and other measures, used to protect the domestic market, should to be reduced and, where it is possible - to be eliminated through multilateral trade negotiations. As a result of trade negotiations, the WTO member states agree to open their domestic markets to the foreign goods and to “bind” themselves with corresponding obligations. The tariffs, that are reduced and bound in such a way, are not liable to increase, and this is indicated in the national Schedule of concessions of the country. Schedule of concessions is an integral part of the legal system of the GATT (“World Trade Organisation”, 2018).
III. The third rule:the trade on the basis of the Most Favored Nation (MFN). The essence of the terms of this regime is to ensure that trade should not be discriminatory. MFN is the term, which is fixed in international trade agreements that provide concession of the contracting parties to each other all the rights, preferences and privileges, which are given or will be given to any third country. IV. The fourth rule:trade on the basis of national treatment. The principle of national treatment complements the MFN principle and it assumes that the imported product that crosses the border after the payment of duty and other charges, should receive the treatment that is no less favorable than the treatment obtained by similar goods produced by domestic producers. Therefore, the state cannot impose on imported goods the internal taxes (for example taxes on sale) at higher rates than those applied to similar domestic products after the goods arrived to the country after paying the duties on the customs. And the rules that regulate the sale and purchase of goods in the domestic market should not be more stringent towards to imported goods (“World Trade Organisation”, 2018). The international regulation of trade in services is based on the General Agreement on Trade in Services (GATS) (Kozak & Gribincea, 2016). It aims to promote the economic growth of all trading partners and the development of developing countries, through the expansion of trade in services, and seeks to achieve this by applying to trade in services the rules of the GATT. The GATS involves international trade in services, with the exception of services provided by public authorities, and many air transport services (Kozak & Gribincea, 2016).
The GATS, firstly, is a comprehensive agreement, because it contains the main rules that refer to all types of services, appendixes oncerning specific services and sectors. It also contains the schemes of specific commitments for each member (Kozak & Gribincea, 2013). The GATS, secondly, is the framework agreement, which provides the initial conditions and rules that further will be specified and corrected by the parties. The structure of the GATS contains six parts (Kozak & Gribincea, 2013):
”Scope and definition”, ”General obligations and disciplines”, “Specific commitments”, “Progressive liberalization”, “Institutional provisions”, “Final provisions”. The most important neral obligations include the following (Kozak & Gribincea, 2016):
2) transparency of rules on trade in services. This commitment involves the creation of information and contact points;
3) mutual recognition of qualifications required for the provision of services;
4) the rules concerning monopolies, exclusive service suppliers and other business practices that restrict competition;
5) the measures aimed at liberalization of trade, in particular, to ensure greater participation of developing countries.
Specific commitments are the commitments assumed by separate countries on certain service sectors (Kozak & Gribincea, 2016). Country is obliged to assume the obligations of market access, national treatment and other obligations in each of the selected service sectors. Service delivery is executed by four elements (Kozak & Gribincea, 2016):
1) cross-border supply, i.e. the provision of services across the border. Neither supplier nor customer of a service are moved across the border, it is crossed only by the service;
2) consumption abroad, i.e. move of consumers to the country of export;
3) commercial presence, i.e. the creation of commercial presence in the country where services should be provided (the opening of a branch or subsidiary);
4) presence of natural persons, i.e. a temporary relocation of individuals to another country with the purpose of providing services there.
The determination of such modes of service delivery is aimed at enhancing of identification of appropriate regulating measures (Kozak & Gribincea, 2016).
After understanding that government of each country and different organizations regulate international trade, it is necessary to define ways of industry and business’ competitiveness analysis in the global market.
1.3 The industry and
business’ competitiveness in the global market
Nowadays the role of competitiveness is increasing. The growth of international trade, export and import volumes of capital, the quantity of international trade participants leads to the fact that competitiveness obtains global character (Shestopalova, 2009). The problem of growing competitiveness is actual for producers that export their goods. However, domestic goods are involved in the process of international competitiveness, because they compete with foreign goods (Shestopalova, 2009).
methods. For example, on the basis of improving quality or services, price decreasing, decreasing of operating costs (Shestopalova, 2009).
The competitiveness of the company is the characteristic of the company’s ability to build up own
competitive advantages for achieving excellence in production and sale of goods. The factors of competitiveness are the character of innovation, level of labour capacity, management efficiency, resource existence, and market share of the company and sale methods (Shestopalova, 2009). The competitiveness of the industry depends on existence of resources and efficient use of them,
particularity of production, technologies, employer’s skills, the level of scientific potential
(Spiridonova, 2009).
The country specializes on the production and export of certain goods depending on the competitiveness of some economy industries. The competitiveness of the country defines its position in the world economy. One of the most important criterion of competitiveness is the volume of demand on goods (Spiridonova, 2009). In this case, it is interesting to analyse the indicators of international trade of the country: the scale of export and its structure, country’s share in world export, balance in each goods’ section.
First of all, the competitiveness of industry should be discussed to understand its influence on
company’s competitiveness. The factors of industry competitiveness are (Spiridonova, 2009): - Industry structure;
- Existence of high competitive companies; - Developed industry infrastructure;
- The system of scientific, production, commercial cooperation in the industry and with another country;
- The system of product distribution; - Labor capacity;
- The level of export orientation and import dependence of the industry.
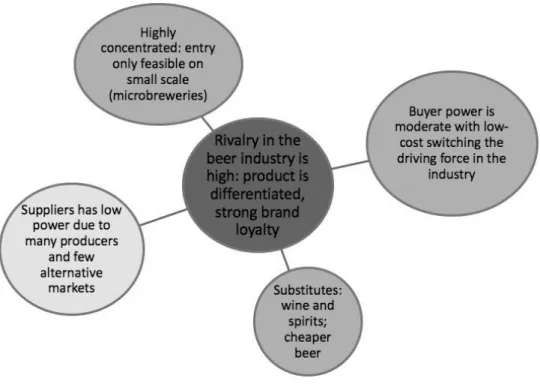
This list of factors can be changed or completed according to the industry particularity (Spiridonova, 2009). Therefore, the most known method of industry competitiveness analysis is Porter’s Five Forces Analysis. Since 1979 this method has become one of the most popular business strategy tool. The main purpose of it is to determine the attractiveness of the industry. The framework of
Porter’s analysis includes the following competitive forces (Porter, 1998):
1) Industry rivalry (it means the analysis of competition degree among existing firms: how many rivals do you have? Who are they? How quality their products are?).
The force of competition depends on the following factors: the number of competitors, the rate of industry growth, the degree of differentiation, cost structures, the objectives of competitors, exit barriers.
2) Threat of substitutes (This refers to the opportunity of customers to find another way of doing what you do).
3) Bargaining power of buyers (How many buyers are on your market? How big are their orders? Do your buyers have possibility to buy from your rivals and dictate any terms to you?).
This force is determined by the following indicators: the concentration and size of buyer, the importance of the purchase to the buyer, the level of product standardization, the costs and opportunity to change supplier, the possibility of vertical integration.
4) Bargaining power of suppliers (How many suppliers do you have? How unique are their goods? Is it possible to switch from one supplier to another? And how expensive it is? The behavior of suppliers and their power can compress industry profits. Therefore, the control of suppliers activities can be beneficial. The power of suppliers are affected by the following factors: concentration among suppliers, the degree of substitutability, the amount of vertical integration, switching costs and the extent to which the buyer is important to the supplier.
5) Barriers to entry (How easy is it to get into your industry or market? How expensive it is for new company would it cost?)
When barriers to entry are high, new companies will have problems with the access and will receive a quick reaction from existing firms. When the barriers are low, the reaction will be slower, so there are more opportunities for new companies. There are some factors, which create barriers: economies of scale, product differentiation, capital requirements, switching costs, access to distribution channels, cost advantages independent of scale (Porter, 1998).
The state of industry competition depends on these five basic competitive forces. The assembled strength of them defines profit potential in the industry (Spiridonova, 2009). Any company should try to understand the nature of its competitive forces. It wants to achieve its objectives and establish appropriate strategy. If a company does it and appreciate the most important one, it will have a stronger position in the market. However, the nature and power can be changed, so it is necessary to monitor them (Spiridonova, 2009).
Another well-known technique of external environment’ analysis is PEST-analysis. PEST-analysis is
the analysis of “Political, Economic, Social and Technological” spheres. This analysis is effective for planning of strategy, marketing, business and product development (Koumparoulis, 2013).
The goal of PEST-analysis is to identify as many factors, which are outside of the control of organization, but at the same moment can have impact on it. For each factor, it is possible to ask and find answers on the following questions: What are the main political factors? What are the important economic factors? What cultural aspects are the most important? What technological innovations can appear? The company should use this analysis on regular basis to maximize all advantages (Newton & Bristoll, 2013).
Economic factors include inflation, tax and duties, interest and exchange rate. The company should also consider other factors as unemployment, skills, wage patterns, labor cost trends, the current cost of living and the availability of credit. These factors are very important, because, for instance, rising inflation will affect prices and purchasing power of consumers, what can lead to decrease of demand (Newton & Bristoll, 2013).
Social factors, that should be identified, are the following: age distribution, population growth rate, employment level, income statistics, education and career trends, cultural conventions. Social and cross-cultural aspects play a significant role, when the company decides to sell goods internationally and the success mostly depends on the depth of the research. Nowadays technological factors are
key factors, which can have an impact on company’s processes and future. Automation, improved quality of products and equipment, cost savings, use of outsourcing to control cost are the main activities, which can give a competitive advantage to the company (Newton & Bristoll, 2013). Industry analysis gives to the company opportunity to develop the best strategy against the competitors and their acts (Spiridonova, 2009). The main key of developing a competitive strategy is to determine the origin of the competitive forces.
When companies develop their competitive strategy, they wish for long and profitable way of competing in the market. However, there is no universal strategy. The strategy based on conditions of each country, industry, company’s capital and skills can be successful (Spiridonova, 2009). German marketing specialist Gunther von Briscorn (quoted by Spiridonova, 2009) characterizes the content and principles of modern market as simple scheme. The market is the sea. On the waves of the market consumers are situated. Their behavior is characterized by the set of their needs. Therefore, it means that the producer need to do their best to satisfy the needs of objective markets using different strategies of competitive advantages (Spiridonova, 2009).
At the same time, the process of maintenance of international competitive advantage is polysyllabic (Spiridonova, 2009). In addition, in most cases, the process is studied in terms of company’s particularity, its goals, mission, tasks, markets, etc. However, competitive advantage determines
company’s position on the market. The competitive advantage is company’s ability to act in one or
some directions, in which the competitors do not want or do not have possibility of being in line with the level of created value or costs. Low costs show company’s ability to develop, produce and sell similar product with less costs in comparison with competitors. If company sell this product at the same price as competitors, they will get profit. Differentiation is company’s ability to provide unique and better value in new products, special user features or services to consumers. Competitive advantage simultaneously has to be an advantage for consumer (Spiridonova, 2009).
On international market, innovations give competitive advantage, anticipate new needs and form the market. There are the most typical examples of such innovations (Spiridonova, 2009):
- New technology (the changes in technologies can create new opportunities for the development of new goods, new marketing or logistics methods);
- The changes in price or the existence of production components; - The changes of government regulation.
So how long it is possible to keep international competitive advantage? It depends on some factors. The first one is the origin of advantage. The second one is the habit of buying definite brand. The third one is fixed costs, connected with the entry to new industry. The fourth factor is the costs of new fixed assets, which should be created for new production. The fifth factor is the access to the channels of realization. The last one is possible competitor’s responses (Shestopalova, 2009). To estimate competitive position of the company it is necessary to answer some important questions (Shestopalova, 2009):
1) How well is actual strategy working?
In this case, it should estimate quantitative and qualitative aspects of the strategy. The quantitative indicators include financial results which have been produces using this strategy. The qualitative indicators include completeness, internal consistency, rationale and suitability. So the better
company’s performance is, the less the radical changes should be done.
2) What are the company’s strengths and weaknesses, external opportunities and threats? The company should make SWOT analysis to answer on this question. This analysis helps to understand firm’s situation. The most important parts of analysis are to draw conclusions about all
analysis’s spheres and make right decision of future development on base of them. 3) Are the company’s prices and costs competitive?
It is necessary for the company to use such tools as benchmarking and value chain analysis. These tools help to determine whether the company is performing in particular of cost-effective activities, its costs are in line with rivals and which business processes should be improved. Value chain analysis shows how a company manages its value chain activities relative to competitors (Shestopalova, 2009).
To answer on all of these questions some methods will help. Nowadays there are a lot of different business analysis techniques, which are used by the companies to define their place on the market and understand the ways of development. The most popular are SWOT analysis, The Space Matrix, Value chain analysis, Core competence, Power structure, Value Perform analysis, which are presented later.
SWOT analysis is a widely used strategy analysis and the tool for strategy development. The acronym SWOT is coming from the words: strengths, weaknesses, opportunities and threats. This method is easy to understand, highly visual and applicable to many levels of the organization, although the data is based on perceptions, beliefs and personality preferences, what is one of the disadvantage of this method (Sarsby, 2016). The completion of SWOT analysis will help to determine
company’s position on the market against the competitors, find the best opportunities for future and highlight current and possible threats (Newton & Bristoll, 2013).
Strengths are internal factors, which can help the company to support its opportunities or overcome threats. They can include financial strengths (effective balance sheet, cash flow, income statements and credit rating), technological advantages and innovations, customer services (in marketing, sales) and talented, skilled, motivated people. Weaknesses are also internal factors, but they do not give possibility to take advantage from opportunities. The examples are financial weaknesses, old technologies, service weaknesses as long delivery time (Sarsby, 2016).
Opportunities are external factors and the company does not have control over them, but they are helpful for development. For instance, it can be competitors, which came out the market; new social trends, innovations. Threats are also external factors and it is impossible to have control over them, they are harmful for the organization and can lead to slowdown of the development. They are new competitors, brand damaging factors, among others (Sarsby, 2016).
Step three is the development of a SWOT matrix for each possible business alternative. Last step of the analysis means including the results into the decision-making process to define which business alternative best meets the organization’s strategic plan (Harrison, 2010). There are two methods (matching and converting), which can be used by organizations during applying the results of SWOT analysis to making decisions. Matching means to correspond strengths and opportunities to create core advantage. Converting means to modify threats and weaknesses into strengths and opportunities (Newton & Bristoll, 2013).
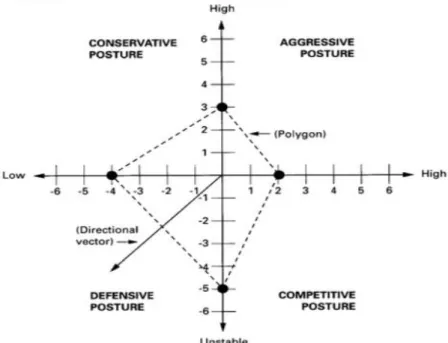
Competition is one of the core things that can lead to failure or success of the organization. That is why it is important to determine strengths relate to its competitors. The SPACE matrix is an effective tool for analysing the competitive position of the company. The method is based on external and internal dimensions, two for each. The internal dimensions are financial strength and competitive advantage; the external ones are industry strength and environmental stability. The result will show the strategic position of the company, which can be aggressive, competitive, conservative or defensive (Radder & Louw, 1998).
The factors of every SPACE Matrix’ box can be presented as follows (Gürbüz, 2013):
Financial Strength (FS) is an internal dimension, which can be characterized by return on investment, leverage, liquidity, capital, risk involved in business.
Competitive Advantage (CA) is also an internal dimension with the following factors: market share, product quality and product life cycles.
Industry Strength (IS) is an external dimension which can include growth and profit potential, financial stability, technological know-how.
Environmental Stability (ES) is also an external dimension, which can be presented by technological change, rate of inflation, price range of competing products.
dimension is calculated. CA and IS values are plotted on the x axis and FS and ES on the y axis. The sum of CA and IS values on one side and FS and ES values on another side will give the final x and y value of the organization’s strategy type (Gürbüz, 2013).
The aggressive type of strategy is typical for an industry with stable economic conditions. In this situation, FS usually empowers a company to protect its CA. It is possible to try to increase market share, cut costs, make cash flow edge. Entry of new competitors leads to improvements and protection of competitive products (Radder & Louw, 1998).
The competitive type is common for an attractive industry but with unstable economic conditions. In this situation, the company can improve the product line, strengthen marketing program, cut costs, and invest into productivity (Radder & Louw, 1998).
The conservative type is a characteristic of a low growth, but stable market. The main focus is on FS and companies can reduce their product lines, cut costs, develop new products and try to enter more attractive markets (Radder & Louw, 1998).
The last type is defensive, that is typical for unattractive industry. In this situation, companies do not have enough financial resources and competitive products. They could try to stop producing unprofitable goods, reduce costs, minimise investments (Radder & Louw, 1998). At the Figure 1 it is presented SPACE matrix chart.
Figure 1. An illustration of SPACE matrix chart Source: Radder & Louw, 1998, p.557.
value and look for ways to add more value. This analysis was discussed by Porter in his book «Competitive advantage» (Porter, 1985).
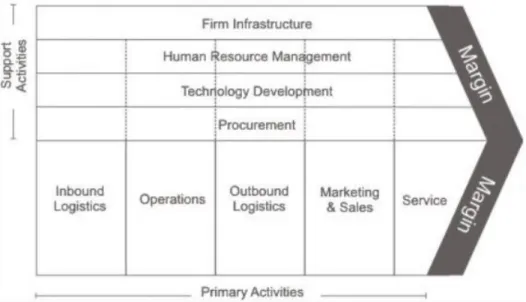
A value chain is a set of activities that the company accomplish to create value for its customers. Value Chain concentrates how inputs are changed into the outputs produces for consumers. In this situation a chain of activities common to all businesses. The activities are divided into primary and support, as presented on the Figure 2.
Figure 2. A value-chain analysis Source: Porter, 1985, p.272.
Primary activities include the production, sale, maintenance and support of a product. The activities are the following (Porter, 1985):
- Inbound logistics consists of all the processes connected with receiving, storing, and distributing inputs internally. The relationships with the suppliers are a key factor in creating value.
- Operations include the transformation activities, which turn inputs into outputs that are sold to customers. In this case, operational systems create value.
- Outbound logistics are the activities of delivering products to customer (collection, storage, distribution systems).
Marketing and sales are the processes, which influence on clients to purchase from the company instead of competitors.
Service include the activities connected with maintaining the value of product, after it has been purchased (Porter, 1985).
Support activities maintain the primary functions and include the following ones (Porter, 1985): - Procurement consists of activities to get the resources, which it needs to operate (finding
- Human resource management are activities to recruit, hire, train, motivate, reward its workers. - Technological development include activities connected with managing and processing
information.
- Infrastructure are the functions that allow the company to support daily operations (accounting, legal, administrative, and general management) (Porter, 1985).
There are four basic steps that should be followed to use the Value Chain analysis. The step one is to understand sub-activities for each primary activity. There are three categories of sub- activities: direct activities, for instance online sales; indirect activities, for example, keeping the CRM1
up-to-date; quality assurance, for example, editing advertisements (Porter, 2001).
The step two is to understand sub-activities for each support activity. In this step it needs to see how value support activities can create value within the primary activities using the same parameters as in step one for direct, indirect activities and quality assurance. The step three is to identify links. This step is very time-consuming. It is important for the company, when it would like to increase competitive advantage from the value chain. The last step four is to look for opportunities or solutions to optimize value chain (Porter, 2001).
Taking into account the fact that all companies have a goal of increasing their net income, because it leads to the development of the business and allows to innovate, produce new products and satisfy the requirements of the costumers, it is necessary to provide financial analysis during competitiveness analysis.
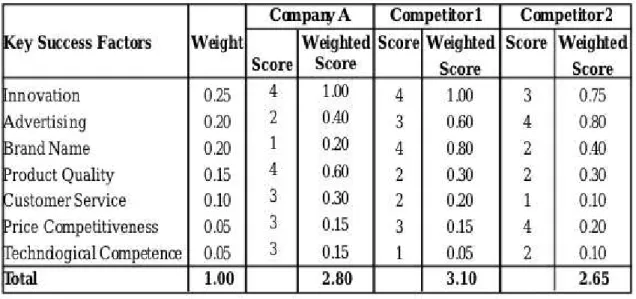
The whole picture of competitiveness on the market can be presented by Competitor Profile Matrix or Competitive Matrix. This is a tool that helps the companies identify themselves against their major competitors using the special factors. There are three steps to construct this matrix for a company. The first step is to define the main factors for the company and the weight to them according to their importance. In the step two, it is important to identify major competitors. The factors can be internal and external. Then different ratings should be given, for example, from 1 to 4 considering their importance to the organization. The same method should be applied to competitors. In the last step, the company need to multiply the weight by the rating for each factor to get a weighted score (Sohel & Rahman, 2014). The example of Competitor Profile Matrix is presented in the Figure 3.
1CRM (customer relationship management) is a program that companies use to manage and analyse customer
Figure 3. Competitor Profile Matrix Source: Sohel & Rahman, 2014, p. 43.
2. Research Methodology
2.1. Objective of the study and Research Hypotheses
The main purpose of this research is to study the situation in the International beer market in order to estimate the prospects of Belarussian and Portuguese beer companies’ development and find ways of development for Belarusian company on the basis of benchmarking. In accordance to the purpose of the research, the objectives are as follows:
1. To analyse international beer market, dynamics of sales’ volume and prices, as well as regulatory framework;
2. To analyse Belarussian and Portuguese beer market and to determine its prospects;
3. To analyse competitiveness of Belarussian and Portuguese breweries in the international beer market.
During conducting the research, it is intended to verify the following hypotheses:
1. Nowadays International beer market is characterized by a decrease in sale volumes; 2. Belarussian breweries have difficulties with entering foreign markets;
3. It is easier for Portuguese companies to develop and sale their products all over the world in comparison with Belarussian companies;
4. The competitiveness of Portuguese company is higher than Belarussian one.
2.2. Data and collection methods
statements of different companies, using techniques based on ratio analysis and common size statements methods.
2.3. Methods and techniques of industry and company’s competitiveness analysis
For the companies’ competitiveness analysis, it will be applied the following methods and techniques: - SWOT analysis is a popular method to analyse internal and external factors that influence on a
company’s success;
- Porter’s framework helps to analyse the competitiveness level of an industry;
- The Space Matrix is an essential method for analysing the competitive position of an organization; - PEST analysis is used to describe the environment in which a company operates (Political, Economic, Social and Technological);
- Value chain analysis - is an analysis that shows primary and support activities that add value to company's final product;
- Competitive Matrix –is the tool, that allow to define new opportunities for the company’s growth thanks to comparison against the competitors.
The methodology and ways of applying the techniques to the company strategy are presented in the literature review, chapter 1.3.
ABC analysis is another well-known technique, used in the research, based on the Pareto Principle for determining which products or services should get priority in inventory management (Ravinder & Misra, 2014). During the analysis company’s goods are characterized into three groups: A, B and C, for example, according to the volumes of sales. The group A includes products which annual or month consumption value is the highest (70-80% of the annual consumption value). The group C has, on the contrary, the lowest consumption value (lower than 5% of the annual consumption value). The group B is the middleclass, with a medium consumption value (15-25% of annual consumption value) (Ravinder & Misra, 2014).
Financial analysis will be provided for evaluation of companies’ performance. Financial Analysis is the process of determining the financial strength and weaknesses of the company by forming relationship between elements of financial statements. This analysis can be used by managers for evaluating the operational and financial efficiency of the company; by investors for making, by lenders and creditors for determining the credit worthiness; by employee for deciding economic status of the company (Ravinder & Anitha, 2013).
periods (Ravinder & Anitha, 2013).
As a part of financial analysis, ratio analysis should be used. It is a useful technique that gives opportunity to understand financial results and trends over periods and provides important indicators
of company’s performance (Tracy, 2012). Moreover, ratio analysis provides ways for the company to compare the financial state against other companies within your industry. There a lot of available financial ratios, for this reason it is important to make right decision and choose more applicable ratios (Tracy, 2012).
It is possible to group the commonly used ratios into four categories: activity, liquidity, solvency and profitability (Lan, 2012).
Activity ratios show how efficiently a company exploits its assets. These ratios provide information for investors about the overall operational performance of a business. The following ratios are included in this group: inventory, receivables, payables and assets turnover. The activity ratios measure how many times per year inventory of other indicator is restored or receivables are collected (Lan, 2012).
Liquidity ratios are one of the most widely used ratios, probably after profitability ratios. These ratios
are very important to creditors. They show a company’s ability to meet its short-term obligations. It is necessary to add that vital level of liquidity varies from industry to industry, because some industries are more cash-intensive than others (Higgings, 2012). That is why the liquidity ratios of companies cannot be comparable to each other in definitely different industries. This group includes current, quick and cash ratio (Lan, 2012).
Solvency ratios show a company’s ability to meet its longer-term obligations. Analysis of these ratios provides information about a company’s capital structure and the level of financial leverage is used by the company. Some ratios of this group allow to understand whether a company has necessary cash flows to pay always interest payments and other fixed charges. There are such ratios as debt-to-asset, debt-to-capital, debt-to-equity ratios and interest coverage ratio (Lan, 2012).
The last group is profitability ratios. They are the most widely used ratios in financial analysis. These ratios include gross, operating and net profit margins ratios and return on assets and equity. They
measure the firm’s ability to earn an acceptable return. It is possible and necessary to compare them against other companies of the industry and its close competitors during analysis. Nevertheless, margins will vary among industries. For instance, companies, operating in industries where it is to produce substitutes, will typically have low margins. Industries with unique products with high barriers to entry generally will have higher margins (Higgings, 2012).
To finalize, it is possible to say that presented ratios provide useful information for the companies that can be used for comparison across industries and sectors and definition of their performance stage.