MASTERS IN FINANCE
Heading in the right direction?
We begin the coverage of DIA with a BUY recommendation. The Price Target for final FY18 is Eur 4.19, which represents an upside of 25% against the current price.
In July 2017, the company quoted at Euro 6.41 per share (best value in the year), but after disappointing results and peers outperforming, DIA became the most-shorted share in the Stoxx Europe 600 Index reaching the current Euro 3.40. This trend may continue if the investments in Argentina become affected by the financial instability in the country (which requested financial assistance to the IMF).
In order to reduce the high dependence from the Iberian Market, being more than 70% of their sales generated in Portugal and Spain, DIA is investing in Paraguay almost Euro 40 million, to open 90 stores until 2022.
DIA is currently ranked in the investment grade used by Standard & Poor's as BBB- and for Moddy’s as Baa3 risk investment. As such, if the company underperforms, the credit agencies may downgrade DIA to a non-investment/speculative grade increasing abruptly the cost of debt. For example, an increase of 2% in the cost of debt will decrease the Equity Value in Euro 510 million (or Euro 0.82 per share).
Company description
DIA is a Spanish multinational company specialised in the distribution of food, household and personal care (“HPC”) products. The company operates in Spain, Portugal, Argentina, Brazil and Paraguay with close to 7,388 stores. In 2017 its sales exceeded Euro 8,8 million.
“DIA - DISTRIBUIDORA INTERNACIONAL
DE
A
LIMENTACIÓN
,
S.A”
COMPANY REPORT
F
OOD RETAIL
22
M
AY2018
S
TUDENT
:
H
UGO SEIA
[email protected]
Recommendation: BUY
Vs Previous Recommendation ---
Price Target FY17: 4.19 €
Vs Previous Price Target ---- €
Price (as of 21-MAY-18) 3.12 €
Source: Bloomberg.
52-week range (€) 3.04-6.41
Market Cap (€m) 1.942.064
Outstanding Shares (m) 622.456
Source: Bloomberg; Analyst’s estimation.
Source: Company’s report.
(Values in € millions) 2015 2016E 2017F
Revenues EBITDA Net Profit EPS P/E
Source: Company’s report; analyst’s estimations. Company vs PSI20 0 50 100 150 200 01-01-08 01-03-08 30-04-08 29-06-08 PSI20 Company
(Values in € t housands) 2017 2018E 2019E 2020E Revenues 8 776 210 9 249 974 9 741 796 10 233 748 EBITDA 495 872 549 710 569 426 606 165 EBITDA Margin (%) 5.65% 5.94% 5.85% 5.92% EBIT 247 073 314 027 310 141 316 900 EBIT Margin (%) 2.82% 3.39% 3.18% 3.10% Net Prof it 174 001 109 539 200 522 198 299 NWC/ Sales (%) -9.33% -9.23% -9.18% -9.10% Capex/ Sales (%) 3.45% 3.74% 3.96% 4.17% Net debt 891 271 682 282 689 869 653 370
DIA COMPANY REPORT
Table of Contents
COMPANY OVERVIEW ... 3
STATEGY ... 5 BUSINESS MODEL ... 6 SHAREHOLDER STRUCTURE ... 7 GEOGRAPHIC PRESENCE ... 7RETAIL INDUSTRY ... 9
THE FOOD RETAIL INDUSTRY ... 9
SECTOR TRENDS IN EUROPE ... 10
RETAILING TRENDS IN LATIN AMERICA ... 13
VALUATION ...15
WACC AND G ASSUMPTIONS ... 16
METHODOLOGY RESULTS ... 17
SCENARIO ANALYSIS ... 18
MULTIPLES APPROACH ... 19
APPENDIX ...20
FINANCIAL STATEMENTS ... 20
DIA COMPANY REPORT
Company overview
Distribuidora Internacional de Alimentación, S.A. (“DIA” or “the company”) is an international corporation with headquarters in Spain and engages in the food, home and personal care (“HPC”) products competitive retail markets and became specialised in managing proximity stores.
DIA was originally founded in 1979 with the opening of its first store in Madrid, introducing the concept of the discount store on the Spanish food and retail sector. The company relies on three fundamental principles for their business: (i) highly competitive pricing and proximity to customers, (ii) multiple and flexible store formats and (iii) a low-cost distribution model.
These guidelines allowed the company to quickly expand in Spain before deciding to start the internationalisation process, first to Portugal, in 1993, and then Greece, Turkey and France in the years after.
In July 2011, the company became listed at Madrid Stock Exchange after a spin-off from Carrefour. In the Initial Public Offering (“IPO”), its shares quoted at Euro 3.50 implying a total equity value of Euro 2,378 million. Before the company’s IPO, DIA ceased the French, Greek and Turkish operations.
Currently, DIA has market-leading positions as a food discounter in Spain (#1, 8.6% market share), Portugal (#3, 4.5%), Argentina (#1, 12.4%) and Brazil (#1, 7.0%). In the annual study Global Powers of Retailing 2018 released by Deloitte, DIA was considered the 98th largest retailer around the world.
In 2017, gross sales under banner reached Euro 8,800 million, relying on an extensive network of more than 7,388 stores (owned stores integrated in the COCO model and franchised stores) in Spain, Portugal, Brazil and Argentina, distributed as follows: 0 1 000 2 000 3 000 4 000 5 000 Argentina Brazil Portugal Spain
Figure 1: Total stores by country and business model
COCO Franchise
In 2011, the IPO set up the
company’s equities value
at Euro 2,370 million.
DIA COMPANY REPORT
As illustrated below, in 2017 more than 60% of the company’s revenues belong to the Iberian market (Spain and Portugal). DIA is focusing to rapidly expand into the Latin American countries - as Brazil, Argentina and more recently Paraguay, where the first stores will open in 2018.
DIA operates under different store formats, including DIA Market, DIA Maxi, Clarel, La Plaza de Dia or Minipreço providing a broad range of products at unbeatable prices to their customer.
As a final remark, from an historical point of view, DIA is above performance of the IBEX 35. For example, in July 2011, if an investor had purchased Euro 100 of DIA’s shares, this portfolio would be currently valuated at Euro 131.09 plus Euro 30.69 of dividends in cash.
In July 2017, the company quoted at Euro 6.41 per share (best value in the year) but after disappointing results and outperforming peers, DIA became the most-shorted share in the Stoxx Europe 600 Index reaching the current Euro 3.40.
0 2 000 4 000 6 000 8 000 10 000 2011 2012 2013 2014 2015 2016 2017
Figure 2: Revenue breakdown
Spain Portugal Argentina Brazil
0 50 100 150 200 250 300 Ju n -1 1 O ct -1 1 F e b -1 2 Ju n -1 2 O ct -1 2 F e b -1 3 Ju n -1 3 O ct -1 3 F e b -1 4 Ju n -1 4 O ct -1 4 F e b -1 5 Ju n -1 5 O ct -1 5 F e b -1 6 Ju n -1 6 O ct -1 6 F e b -1 7 Ju n -1 7 O ct -1 7 F e b -1 8
Figure 4: DIA Performance Vs. IBEX 35
DIA IBEX 35
Source: Company’s report
Source: Company’s report Figure 3:
DIA COMPANY REPORT
Strategy
The company aims to follow consumer’s trends and offer the best prices on the market, through several private label brands that target different segments of the retail food market and HPC products.
The main focus of the Group is to achieve organic growth through the expansion in several new markets, such as in Latin America.
Furthermore, the Group established several medium and long-term priorities namely (i) continue to improve its business model, (ii) adapt the company to the digital world and (iii) create and implement new business opportunities.
For instance, the company acquired the Castanola Investments for the creation of a new website for the Group and started to introduce online shopping in their offer. The franchise stores shall pursue the objectives set by the company, as they are the main gateway to enter in a new market and represent the Group’s image for new clients.
In addition, the company set several drives that define the business model pursued by DIA, as follows:
• Proximity segment: DIA is specialised in the proximity store model,
providing to the clients an everyday experience.
• Customer-focused: The Group follows customer’s trends.
• Best value of money: The best quality product at the lowest prices. For
example, to increase bargaining power, DIA settled multiple agreements with rivals such as, for example, with Casino, in Spain, for its private label products.
• Quality own brand: Company’s private labels aim to offer the best quality
at the lowest prices.
• Loyalty program: “Club DIA” allows customers to have immediate
access to several discounts in products. Nowadays, more than 80% of the sales of DIA are through the use of this card.
• Continuous efficiency and improvement: To offer the most competitive
prices, it is necessary to ensure efficiency in all the processes.
• Franchise store model: The Company aims to consolidate the position
as franchise leader in Spain and the number 3 retailer in Europe.
• Profitable growth: The recent expansion to Latin American countries is
one of the main concerns of the Group that takes advantage of the increasing demand for food and HPC products.
Digital transformation is
one of goals set by DIA.
DIA COMPANY REPORT
• Focus on an omni-channel approach: The implementation of an online
channel, as an approach to increase the sales and proximity to customers.
Business model
The company relies on self-owned stores – 50% of the company’s stores - and in the franchise stores – the remaining 50% - to sustain its continuous organic growth. In this regard, the company uses three different management models, as follows:
• Company Owned Company Operated (“COCO”); • Company Owned Franchised Operated (“COFO”) and • Franchised Owned Franchised Operated (“FOFO”).
Using the COCO stores, DIA remains with “a foot on the ground” being aware of the market dynamics and allowing the company to introduce new concepts in the market, prior to presenting such concepts to the franchise stores. In addition, as the complexity of the business increases with the size of the stores, DIA remains managing the largest size stores.
In the franchise business model, the company depends on a private investor for operating the store’s day-a-day operations, remaining the store as legally owned by DIA (or not) depending on the initial investment performed by the private individual or company.
Initially, the company started to bet in the franchise business modelthrough stores operated in a FOFO model. In 2009, the company introduced the COFO model, allowing small investors to manage a franchise store model without a relativity high investment.
In the franchise model, the investor must purchase all the products from DIA and the final prices to the consumer are strict to a maximum price settled by the company.
DIA’s stores are segmented in three principal categories as: the proximity stores (until 700 sqm), supermarket stores (above 700 sqm) and HPC stores.
Furthermore, the proximity stores represent almost 80% of the total stores managed by the company, followed by the HPC stores using the banner Clarel. These reach almost 17% of the total stores and supermarket business represents the 3% remaining stores.
Nowadays, as mentioned above, the conception of self-owned labels for different product segments is a tremendous sector trend and DIA has several private labels regarding a wide range of products.
DIA COMPANY REPORT
Shareholder Structure
Since 2011 that DIA’s shares are traded in the Madrid Stock Exchange (“IBEX 35”). DIA has 622.5 million outstanding shares being the company’s main shareholder Letterone Investment Holding S.A. with 18% of DIA’s shares. Furthermore, almost all the remaining capital (80%) is held by private investment funds.
It is worth mentioning that Letterone Investment Holding S.A. became a shareholder of the company with purchase of 15% of capital in January 2018. In this deal, the investor paid over Euro 407,504 thousand for 93.4 million company’s stocks, which meant a DIA’s equity valuation of Euro 2,774.9 million.
Geographic Presence
DIA is physically present in 5 countries, as illustrated below, namely: • Iberia markets: Spain and Portugal;
• Emerging markets: Brazil, Argentina and Paraguay.
From a pure sales perspective, the company’s principal market is Spain with 4,713 stores (of a total of 7,388) accounting with 56% of the total sales (2017). In addition, the ratio of sales by store in Spain stood at Euro 1.024 million, in 2017. Inside the Iberia markets, Portugal is gradually losing its importance as the sales associated to this market are consistently decreasing. In 2017, it only represented 7.86% of the total revenue distributed in 630 stores.
Notwithstanding, in 2017, Iberia markets are the most relevant segment, with almost 64% of the total revenue of the company. Portugal and Spain together registered €5,505 million in sales and in a total of 5,343 stores.
Figure 6: DIA’s presence
Source: Company’s website
Investing company % of Capital
LETTERONE INVESTMENT HOLDINGS SA 18.00% BAILLIE GIFFORD & CO LIMITED 10.48% COLUMBIA WANGER ASSET MANAGEMENT INC 3.28% AMERIPRISE FINANCIAL INC. 3.05% LSV ASSET MANAGEMENT via its funds 3.00% DELORES HOLDINGS LTD 2.98% NORGES BANK INVESTMENT MANAGEMENT (OSLO) 2.97% VANGUARD GROUP INC via its funds 2.52% TIGER GLOBAL MANAGEMENT 2.39% MARSHALL WACE LLP 2.19%
Figure 5: Shareholder Structure
Source: Sabi
Iberia markers are the
most relevant segment.
DIA COMPANY REPORT
Furthermore, in the Emerging market segment, Brazil stands out accounting with 20% of the company’s sales in 2017 among the 1,115 stores in the country. For these stores, 691 operate under the franchise business model.
As illustrated in the figure 7, the sales in Brazil are constantly increasing since 2011 and improved almost 50% between the historical years under analysis (2011 and 2017).
Moreover, Brazil’s macroeconomic context played in the company’s favour, as a severe economic recession created the ideal conditions for the company’s expansion, based on the proximity and low-price policies. In addition, Brazilian customers were very receptive to the company’s loyalty program, that there surpassed the 4 million members barrier.
Argentina is one of the Emerging markets where the company is present. The sales on this country have been severely punished by the hyperinflation registered in the country and the abrupt Argentinian peso devaluation. Nonetheless, the company remains committed with its expansion plan in Argentina as, in 2017, the total stores increased from 872 to 930, due to the franchise model widely used in this country. In Paraguay, the company settled a distribution centre by the end of 2016. Until the end of 2017, the company did not have any store in the country, but DIA started an investment of almost Euro 40 million to open in the country 90 stores until 2022. The initial target will be to scale up to 22 stores, with long term expectations of 90 stores within 5 years.
Nevertheless, the Emerging markets represent 35% of the total sales and 25% of the total number of stores. In these countries, the company expects to benefit from rapid growth, supporting the expansion of the company and contrasting with the low levels of expansion on the Iberia markets.
0 2 000 4 000 6 000 8 000 10 000 2011 2012 2013 2014 2015 2016 2017
Figure 7: Revenue breakdown
Spain Portugal Argentina Brazil Source: Company’s report
Recent investment in
Paraguay…
DIA COMPANY REPORT
The growth strategy in Emerging markets is set by the use of the franchise business model and, after a quick expansion, followed by the opening of large COCO stores.
Not all investments performed by the Group are being made in the Latin American countries.
In 2003, DIA entered China and reached about 200 convenience stores in Shanghai. China’s market is highly competitive, resulting in the company’s revenues declining to Euro 181.5 million in 2017 and its losses increasing by 35% to Euro 21.4 million. In the beginning of 2018, DIA left the China market and sold its local stores to a unit of the Chinese retail giant Suning Group.
Retail industry
The retail industry comprises the companies that produce and sell goods and services.
As a HSBC bank industry report remarks, this is a broad industry comprised by specialised retailers, in areas such as:
• Food retailers; • Beverages; • Food and HPC; • General retailers and • Luxury items retailers.
The food retail industry
The food retail industry is the largest sub-sector of the retail industry in terms of revenue and it is mainly focused on the sale of consumer goods (groceries) but also non-food products as HPC and similar products.
This sub-sector of the retail industry plays an important role in the global economies and markets, as it links between producers to the final consumers, bringing advantages to both sides. In this role, retailers have the ability to offer the final consumer a wide variety of goods in the same place and to easily absorb a large production batch of a single product from its suppliers.
Furthermore, most players on this industry use standardise stores, each one adjusted to the target customer and a wide of products offered, as follows:
• Hypermarkets, are the most complete stores. Usually, these stores have between 2,500 m2 and 5,000 m2;
… and disinvested in
China.
DIA COMPANY REPORT
• Supermarkets, include stores between 400 m2 and 2499 m2 and offer only essentially food products and a limited number of non-food products; • Discount stores, non-defined size and sell a very limited quantity of
products at low prices;
• Convenience stores, are small stores located close to customers with a small variety of food products;
• Cash and Carry, are stores that target small retailers usually from the HORECA channel selling products in bulk at low prices;
Sector Trends in Europe
The European food retail sector is constantly being affected by globalization as market competition is more aggressive than ever, customers are always more demanding and producers depend less of the traditional food retail chain to sell their products.
The large Groups playing in this industry are quickly adapting to this dynamic environment and aim to boost their sales.
A CBI - Ministry of Foreign Affairs of the Netherlands’s study foresees that this sector will remain stable in Europe, as it is not expected an increase higher than 2% per year. In this context, the competition is severe and to remain in this market on the long run, the major players of this industry will have to face challenges, as:
• Adapting the supply chain to technologies – Standardisation of the
barcodes and RFID technology used into the communication between manufacturers and retailers, increasing the efficiency of the supply chain, reducing costs to producers and retailer and lowering the prices to customers;
• Changing competitive landscape – E-commerce will have a bigger
influence on the global market competition, as it offers new sales opportunities for a cheaper price for square metres in stores. On the other hand, for the customer, the price will remain the most important criteria on selecting the product. It is also expected an increase of the private labels market share in the EU countries where they have relatively low importance (e.g. Eastern and Southern Europe);
Retail market is in a very
mature stage.
DIA COMPANY REPORT
• Demographic shifts - The most influencing trend seems to be
urbanisation, as it will have a major impact on this market (in 2014 more than 73% of European citizens already lived in cities). These consumers want to have easy and quick access to food, which means making supermarkets closer to the customer. An aging population demands a smaller proportion, an easy-to-open packaging and readable labels. Growing ethnic and cultural diversity will lead to retail having more variety of products;
• Growing consumer’s concerns about sustainability – Customers are
more aware of the ecologic footprint caused by their consuming habits. Therefore, the whole supply chain will be forced to became more sustainable, especially on the environmental impact of processes and transportation. Organic and slow food movements will continue to grow but remain relatively niche markets.
• Increased awareness of health and wellbeing – This trend will force
producers and retailers to be more aware of the products composition, as consumers demand healthier products, e.g. lesser salt, calories and fat but more fibres.
• Increase in consumer service demands – Customers are more
demanding concerning the range of product available as personalisation becomes a trend. Moreover, customers are also demanding 24/7 accessibility, with online sales opportunities (e-commerce) increasing.
• Increase in regulatory pressure – The fat tax concerns are increasing
as many EU states implement this tax. Movements defending animal’s wellbeing are increasing as well as environment and sustainability are becoming a big concern.
Figure 8: The grocery landscape in Europe should be significantly reshaped by 2025
Source: Planet Retail.
Figure 10: Actual and projected
population structure in EU
Source: World Bank
Figure 11: EU organic market development
2004-2013 (billion €)
Figure 9: Sold volume of prepared meals in
DIA COMPANY REPORT
The major players in this sector are well aware of these challenges and all of them are attempting to grow sales and offer the lowest prices in a very competitive environment.
Furthermore, in attempting to reduce costs and prices to the final consumer, many of the retailers are creating private labels that result from agreements between retailers and manufacturers, where the manufacturer’s products are sold using the retailer’s brand. This process cuts out intermediates in the supply chain, reducing costs and allowing these products to have a more competitive price than international brand products. Manufactures are allowed to produce taking advantage of the installed capacity, allowing them to reduce production costs even more.
Therefore, the private label products have rapidly gained market share. In the grocery products, private labels have a significant importance in countries such as Switzerland (45%), United Kingdom (41%) and Spain (41%).
Moreover, many retailers have been creating joint purchase agreements to gain bargaining power and reduce product prices. These agreements are widely used for the acquisition of private label goods, reducing even more the costs of these products.
To increase sales, retailers have been introducing several non-food products, as electronic products and home accessories, enabling customers to have an increasingly broad variety of products.
In addition, European retailers are rapidly expanding to other EU countries or even to the emerging markets, in an attempt to grow sales. One of the main strategies to expand is to acquire local companies, with an already implemented supply chain and benefiting of the existing brand awareness of the acquired company.
However, some retailers choose to create joint ventures with local retailers, establishing a franchise store, as well as betting in the creation of their own subsidiaries in the new countries.
The scale of large European retailers has an immediate consequence in the traditional retail business, as small businesses could not offer the widely variety of products at the lowest price that are available at big retailer’s stores. For this reason, one of the trends of the food retail in Europe is the partnership between the traditional retailers and the large European retailers. This partnership benefits both sides, as large retailers profit from the connection between traditional retailers and the customer, as the big retailers increase their brand awareness and remain close to customers.
Private labels gained a
significant importance.
DIA COMPANY REPORT
Finally, it is worth mentioning that technological advances will transform the way customers interact with retailers. In the long run, online shopping and stores with self-checkout systems will be the standard of this industry, cutting even more the costs and prices for consumers.
The last trend in the European food retail sector is the introduction of in-store technology and the creation of e-commerce platforms. Both trends have the same premise, make shopping easier and quicker.
Retailing trends in Latin America
The Latin American countries have been dealing with a negative macroeconomic performance in the recent years. In this situation, consumers are forced to increasingly seek for products at the lowest prices possible. The retailers answer this demand investing in private labels to reduce prices to their customers.
As their clients are become more open to private labels, retailers are expanding the range of products that they offer as private label, as well as strengthening the positioning of those brands. Private labels allow retailers to quickly respond to trends that emerge from fast-changing consumer purchasing habits.
In these countries, alcoholic drinks and products for babies, such as nappies/diapers and baby food, are less likely to be replaced by cheaper brands or products.
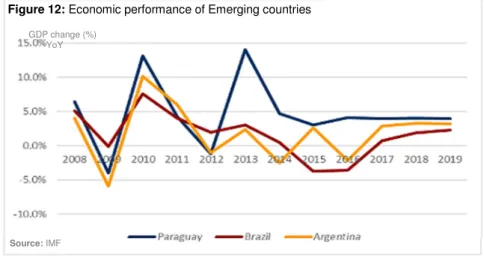
Brazil and Argentina are two of the larger economies within the Latin American countries. Since 2012, those economies faced uncertainty as their GDP decrease, inflation rates and unemployment levels rose and exchange rates remained volatile. All these factors are currently affecting their consumer’s disposable income and their ability to spend.
Figure 12: Economic performance of Emerging countries
Source: IMF
Online shopping will
dramatically change the
industry.
GDP change (%) YoY
DIA COMPANY REPORT
To stimulate consumers, the retailers offer the possibility to pay in interest-free instalments. This strategy is widely used in Brazil as the consumers were very receptive to it.
In Latin American countries the big retailers are not dominant yet, as traditional business continues to stand as deep-rooted in these countries culture.
Promotions, notably, the ones where the consumer buys several items of the same product at a lower price, have been a key tool used by retail players during tough economic cycles.
Figure 13: Market Concentration of Packaged Food by Company in Argentina
DIA COMPANY REPORT
Valuation
For determining the equity’s value of DIA, we decided to use the Discount Cash Flow (“DCF”) methodology. This way, for the purpose of the valuation model, we forecasted the future cash-flows of the company based on the analysis performed to the retail market industry in Europe (particularly in Portugal and Spain) and in the emerging countries (as in Brazil, Paraguay and Argentina) duly identifying the fundamental drives of such industry. Please note that all the amounts were estimated in Euros.
In addition, for the data collected, as illustrated in figure 15, we estimate that the Iberian markets will continue to loss relative importance in the total sales of the company. 0 € 1 000 000 € 2 000 000 € 3 000 000 € 4 000 000 € 5 000 000 € 6 000 000 € 2017 2018 E 2019 E 2020 E 2021 E 2022 E
Figure 14: Sales forecast
Spain Portugal Argentina Paraguay Brazil
DIA COMPANY REPORT
Furthermore, for discounting the Free Cash Flow (“FCF”), we used the Weighted Average Cost of Capital (“WACC”) methodology as it is a better approach to the cost-opportunity faced by different investors to perform such investment in DIA.
WACC and g assumptions
In order to determine the WACC of DIA, we have taken into consideration a risk-free rate corresponding to the yield of an investment in a German Bund with a 10-year maturity.
As a reference for the risk premium demanded for the equity investors, we assumed the implied risk premium for the S&P 500 for January 2018.
The beta levered applicable to DIA was extrapolated from the beta levered observed in the retail food industry after the necessary adjustments.
Afterwards, the WACC determined to discount the FCF of DIA was 3.78%, as illustrated in figure 13.
For the perpetual growth (also known as “g”) applicable to the perpetual FCF of the company, we applied a 1% nominal rate.
Please note that this estimated perpetual growth outcomes from the fact that: • In Europe, the retail industry is highly competitive and is a very mature
market as the historical data of the company denotes a decreased in performance and in the price share, as evidenced in figure 15;
Source: Analyst’s estimation; Bloomberg and
Damodaran
Figure 16:
Figure 17: Total return of DIA, Jerónimo Martins, IBEX 35 and Bloomberg Euro 500 Food Index
DIA COMPANY REPORT
• The investments performed by the company in the Americas are risky and could not originate such good results as forecasted;
• The recent investments of the company in Argentina could be at stake after the country required financial assistance to the International Monetary Fund.
Methodology results
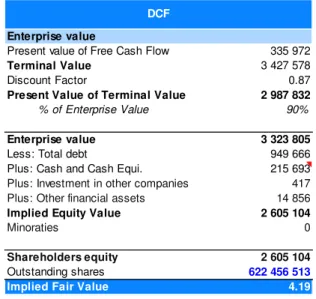
As mentioned before, the company was valuated using DCF methodology. With the sum of the discounted Free Cash Flows generated by the Company, it was determined an Enterprise Value of Euro 2,605 million. Therefore, the target price was set at Euro 4.19 per share, as follows:
Based on the current quotation of DIA, we issued a BUY recommendation as an investment in the company will generate an expected return of 36%.
Figure 18: DCF Valuation
Source: Analyst estimation
Enterprise value
Present value of Free Cash Flow 335 972
Terminal Value 3 427 578
Discount Factor 0.87
Present Value of Terminal Value 2 987 832
% of Enterprise Value 90%
Enterprise value 3 323 805
Less: Total debt 949 666
Plus: Cash and Cash Equi. 215 693
Plus: Investment in other companies 417
Plus: Other financial assets 14 856
Implied Equity Value 2 605 104
Minoraties 0
Shareholders equity 2 605 104
Outstanding shares 622 456 513
Implied Fair Value 4.19
DCF
Source: Analyst estimation
Price (at May, 21 2018) 3.12 €
Dividends FY17 in 2018 0.07 €
Implied Fair Value 4.19 €
Expected return 36%
Total return
DIA COMPANY REPORT
Please note that, for the target price calculated, the changes in the working capital were determined taking into considering the following assumptions:
Scenario analysis
The scenario analysis performed aims to measure the sensibility of the DCF model to changes in the rates of the perpetual growth (g) and WACC, used in the discount rate.
Please note that because a large value of the company outcomes from the terminal value, the share price is very sensible to any changes regarding the perpetual growth rate integrated into the model. The projected perpetual rate is a conservative value and, for that reason, we anticipated a scenario where the company goes under a slow increase in results. If the company performs better than anticipated that will boost the company’s value.
Furthermore, the company faces a financial risk arising from the current atypical period of low interest rates, that can influence the WACC used as discount rate. A sharp change in the interest rates can greatly influence the valuation of the Company. For example, a 2% increase in the cost of debt would make the equity value of DIA decrease approximately by Euro 510 million (or Euro 0.79 per share).
1.31% 2.31% 3.31% 4.31% 5.31% 6.31%
Implicit WACC 3.49% 3.71% 3.93% 4.15% 4.36% 4.58%
Stock Price 4.19 € 3.74 € 3.37 € 3.04 € 2.75 € 2.49 €
Total cost of debt (%)
Figure 22: Scenario analysis – Cost of debt increases
Source: Analyst estimation
Figure 21: Scenario analysis
Source: Analyst estimation 4.19 € 2.99% 3.49% 4.28% 4.78% -0.50% 2.83 € 2.34 € 1.77 € 1.49 € 0.00% 3.43 € 2.78 € 2.06 € 1.73 € 0.50% 4.26 € 3.36 € 2.43 € 2.01 € 1.00% 5.51 € 4.19 € 2.91 € 2.38 € 1.50% 7.61 € 5.42 € 3.57 € 2.85 € 2.00% 11.81 € 7.48 € 4.51 € 3.50 € 2.50% 24.54 € 11.62 € 5.98 € 4.43 € WACC P er p et u al g ro w th
Source: Analyst estimation
Current assets
Operation Cash 2% of the year's sales Trade and other receivebles 5% of the year's sales Inventory 6% of the year's sales Loans to customers Average from the past 4 years Current Liabilities
Trade and other payables 22% of the year's sales Other current financial
liabilities (Personnel and supplier of fixed assets)
Average from the past 4 years
DIA COMPANY REPORT
In addition, DIA is currently ranked in the investment grade used by Standard & Poor's as BBB- and for Moddy’s as Baa3 risk investment. As such, if the company underperforms, the credit agencies could downgrade DIA to a non-investment/speculative grade that would translate into a sharp increase in the cost of debt.
Multiples approach
The multiples approach as a relative valuation method often used in the financial industry to value a company or simply to confirm the results obtained through the DCF model valuation.
In order to apply this methodology to the valuation of DIA, we selected comparable peers from the food retail industry.
The selected peers are multinational European food retail companies quoted in the major European indices.
Finally, as expected, DIA trades closer to the median multiples of companies selected. Please note that we excluded the P/E ratio from Casino Guichard Perrachon as is an outlier in our sample.
It can be observed that the TEV/Revenue multiple is higher than the peers multiples, which suggest a healthy store turnover, however the TEV/EBITDA of DIA is lower than the average, which points lower operational margins.
Figure 23: Industry multiples
Source: Bloomberg
TEV / LTM Total Revenue TEV / LTM EBITDA Price / LTM EPS Dividend yield
DIA 0.53x 7.06x 20.49x 4.88%
Peers
Carrefour 0.31x 10.88x --- 2.55%
Casino Guichard Perrachon 0.47x 12.25x 6.20%
Jerónimo Martins 0.63x 11.30x 26.41x 3.74%
Metro 0.25x 5.83x 20.11x 3.91%
Tesco 0.35x 6.47x 16.95x 1.46%
Industry average 0.40x 9.34x 21.16x 3.57%
DIA COMPANY REPORT
Appendix
Financial Statements
CONSOLIDATED STATEMENTS OF FINANCIAL POSITION at 31 December
(Expressed in thousands of Euros)
Forecast
2017 2018 2019 2020 2021 2022
ASSETS
Property, plant and equipment 1 363 963 1 479 900 1 605 691 1 742 175 1 890 260 2 050 932
Goodwill 553 129 533 413 550 606 548 741 546 472 544 808
Other intangible assets 42 709 36 886 37 966 38 766 39 082 38 175
Investments accounted for using the equity method 974 417 417 498 577 477
Trade and other receivables 73 084 91 291 96 171 101 019 105 935 110 069
Other non-current financial assets 75 013 70 444 67 765 67 970 70 298 69 119
Consumer loans from financial activities
-Deferred tax assets 253 983 246 907 271 661 271 706 261 064 262 834
Non-current assets 2 362 855 2 459 258 2 630 276 2 770 876 2 913 688 3 076 414
Inventories 569 644 547 749 577 024 606 114 635 610 660 412
Trade and other receivables 221 846 456 457 480 854 505 095 529 675 550 343
Consumer loans from financial activities 1 070 5 050 4 722 4 266 3 777 4 454
Current tax assets 64 717 67 406 68 171 67 845 67 035 67 614
Current income tax assets 369
Other current financial assets 18 430 16 507 17 597 18 067 17 650 17 455
Other assets 7 387 7 795 7 784 7 776 7 686 7 760
Cash and cash equivalents 340 193 400 692 317 727 312 576 327 888 339 264
Non-current assets held for sale 39 663
Current assets 1 263 319 1 501 655 1 473 879 1 521 738 1 589 320 1 647 302
TOTAL ASSETS 3 626 174 3 960 913 4 104 155 4 292 614 4 503 007 4 723 717
EQUITY AND LIABILITIES
Capital 62 246 62 246 62 246 62 246 62 246 62 246
Reserves 304 676 370 423 490 737 609 716 731 696 851 641
Net profit for the period 109 579 200 522 198 299 203 301 199 907 207 279
Other components -150 418 -150 418 -150 418 -150 418 -150 418 -150 418
Equity attributable to equity holders of the Parent 326 083 482 774 600 863 724 845 843 432 970 748
Non-controlling interests -100
Total Equity 325 983 482 774 600 863 724 845 843 432 970 748
Non-current borrowings 961 945 872 442 816 654 787 212 777 003 779 611
Provisions 42 556 56 500 49 100 48 499 49 164 50 816
Other non-current financial liabilities 2 491 2 491 2 491 2 491 2 491 491
Deferred tax liabilities 2 206 2 206 2 206 2 206 2 206 2 206
Non-current liabilities 1 009 198 933 639 870 451 840 409 830 864 833 124
Current borrowings 269 519 210 532 190 943 178 733 172 290 170 055
Trade and other payables 1 710 828 1 998 010 2 104 798 2 210 907 2 318 500 2 408 968
Current tax liabilities 85 692 86 641 87 692 86 380 86 601 86 828
Current income tax liabilities 10 913 107 973 106 776 109 470 107 642 111 612
Other current financial liabilities 148 865 141 344 142 632 141 871 143 678 142 381
Liabilities directly associated with non-current assets held for sale 65 176
Current liabilities 2 290 993 2 544 500 2 632 842 2 727 360 2 828 712 2 919 845
DIA COMPANY REPORT N S O L ID A T E D IN C O M E S T A T E M E N T S e ye ar s en de d 31 D ec em be r re ss ed in t ho us an ds o f E ur os ) F o re ca st N ot es 20 17 20 18 20 19 20 20 20 21 20 22 M E S TA TE M E N T 8 62 0 55 0. 00 9 12 9 14 2. 79 9 61 7 07 0 10 1 01 8 94 10 5 93 5 00 11 0 06 8 59 in co m e 15 5 66 0. 00 12 0 83 0. 75 12 4 72 5. 94 13 1 85 3. 67 13 3 26 7. 59 12 7 66 9. 49 L IN C O M E 8 77 6 21 0. 00 9 24 9 97 3. 54 9 74 1 79 6. 00 10 2 33 7 47 .5 4 10 7 26 7 67 .2 6 11 1 34 5 28 .9 5 a nd o th er c on su m ab le s us ed -6 8 08 5 96 .0 0 -7 1 81 8 76 .9 1 -7 5 49 0 19 .8 8 -7 9 22 3 27 .5 7 -8 3 16 6 52 .3 0 -8 6 31 4 50 .6 5 nn el e xp en se s -8 08 9 43 .0 0 -8 50 3 55 .3 1 -9 07 9 28 .3 2 -9 51 9 57 .2 1 -9 93 0 99 .5 0 -1 0 31 9 83 .3 4 tin g ex pe ns es -6 45 0 71 .0 0 -6 54 0 60 .9 6 -7 00 4 99 .6 6 -7 37 2 02 .4 9 -7 72 7 42 .2 7 -7 98 0 42 .9 4 tis at io n an d de pr ec ia tio n; Im pa irm en t -2 48 7 99 .0 0 -2 35 6 83 .9 5 -2 59 2 84 .4 5 -2 89 2 64 .4 5 -3 14 6 87 .7 8 -3 33 5 57 .7 0 es o n di sp os al o f f ix ed a ss et s -1 7 72 8. 00 -1 3 96 9. 87 -1 4 92 2. 59 -1 6 09 5. 73 -1 7 79 2. 72 -1 7 46 3. 40 U LT S F R O M O P E R A TI N G A C TI V IT IE S 24 7 07 3. 00 31 4 02 6. 53 31 0 14 1. 10 31 6 90 0. 08 31 1 79 2. 68 32 2 03 0. 92 ce in co m e 4 83 0. 00 10 5 49 .5 0 9 07 5. 13 9 02 7. 66 8 37 0. 57 9 25 5. 71 ce e xp en se s -6 5 86 8. 00 -1 6 08 0. 46 -1 4 14 1. 48 -1 3 15 7. 20 -1 2 61 3. 32 -1 2 39 5. 87 o f c om pa ni es a cc ou nt ed fo r us in g th e eq ui ty m et ho d 28 8. 00 F IT B E F O R E T A X F R O M C O N TI N U IN G O P E R A TI O N S 18 6 32 3. 00 30 8 49 5. 58 30 5 07 4. 75 31 2 77 0. 53 30 7 54 9. 94 31 8 89 0. 76 e ta x -5 5 35 0. 00 -1 07 9 73 .4 5 -1 06 7 76 .1 6 -1 09 4 69 .6 9 -1 07 6 42 .4 8 -1 11 6 11 .7 7 F IT A F TE R T A X F R O M C O N TI N U IN G O P E R A TI O N S 13 0 97 3. 00 20 0 52 2. 12 19 8 29 8. 59 20 3 30 0. 85 19 9 90 7. 46 20 7 27 9. 00 n et o f t ax es o f d is co nt in ue d op er at io ns -2 1 43 4. 00 P R O F IT 10 9 53 9. 00 20 0 52 2. 12 19 8 29 8. 59 20 3 30 0. 85 19 9 90 7. 46 20 7 27 9. 00 F IT F O R T H E P E R IO D A TT R IB U TA B LE T O E Q U IT Y H O LD E R S O F T H E E N T 10 9 57 9. 00 F IT F R O M C O N TI N U IN G O P E R A TI O N S F IT F R O M D IS C O N TI N U E D O P E R A TI O N S es fr om c on tin ui ng o pe ra tio ns a tt rib ut ab le t o no n-co nt ro lli ng in te re st s -4 0. 00 a nd d ilu te d ea rn in gs p er s ha re , in e ur os 0. 18 0. 32 0. 32 0. 33 0. 32 0. 33
DIA COMPANY REPORT
DIA, S.A.
(Expressed in thousands of Euros)
DCF Valuation
2014 2015 2016 2017 2018 2019 2020 2021 2022
Sales 8 116 217 9 021 669 8 795 455 8 776 210 9 249 974 9 741 796 10 233 748 10 726 767 11 134 529
% growth 10.0% -2.6% -0.2% 5.1% 5.0% 4.8% 4.6% 3.7%
Goods and other consumables used -6 350 654 -7 018 881 -6 767 370 -6 808 596 -7 181 877 -7 549 020 -7 922 328 -8 316 652 -8 631 451
Personnel expenses -704 940 -847 233 -833 643 -808 943 -850 355 -907 928 -951 957 -993 099 -1 031 983
Operating expenses -535 029 -644 034 -633 513 -645 071 -654 061 -700 500 -737 202 -772 742 -798 043
Losses on disposal of fixed assets -11 558 -12 340 -10 811 -17 728 -13 970 -14 923 -16 096 -17 793 -17 463
Total costs -7 602 181 -8 522 488 -8 245 337 -8 280 338 -8 700 263 -9 172 370 -9 627 583 -10 100 287 -10 478 940
% sales 93.7% 94.5% 93.7% 94.3% 94.1% 94.2% 94.1% 94.2% 94.1%
EBITDA 514 036 499 181 550 118 495 872 549 710 569 426 606 165 626 480 655 589
% margin 6.3% 5.5% 6.3% 5.7% 5.9% 5.8% 5.9% 5.8% 5.9%
Depreciation and Amortisation -190 129 -195 617 -240 580 -248 799 -235 684 -259 284 -289 264 -314 688 -333 558
% sales 2.3% 2.2% 2.7% 2.8% 2.5% 2.7% 2.8% 2.9% 3.0%
EBIT 323 907 303 564 309 538 247 073 314 027 310 141 316 900 311 793 322 031
Gross cash flow 400 669 392 934 441 780 409 396 439 801 460 876 495 250 517 353 542 878
Capex 345 798 386 156 426 549 463 088 493 323
% sales -3.7% -4.0% -4.2% -4.3% -4.4%
Increase/Decrease in NWC -35 282 -40 017 -37 785.82 -41 036 -30 736
Change in other operational assets -68 489 40 131 -1 901 -11 526 -438
Change in other operational liabilities 46 778 -7 547 781 -941 3 849
Free cash-flows to all investors 244 552 67 060 109 168 105 885 84 578
Change in non-operation assets (excess cash) 51 024 -92 801 -14 991 5 452 3 222
Investments accounted for using the equity method -557 0 81 78 -99
Other current financial assets (90%) -1 731 982 423 -375 -175
Operational and non-operational CF 195 816 158 879 123 655 100 731 81 631
Forecast period Actual
2014 2015 2016 2017 2018 2019 2020 2021 2022
Operating Cash 162 324 180 433 175 909 175 524 184 999 194 836 204 675 214 535 222 691
Trade and other receivables 244 592 272 484 330 207 294 930 547 749 577 024 606 114 635 610 660 412
Inventory 553 119 562 489 669 592 569 644 547 749 577 024 606 114 635 610 660 412
Loans to customers 6 362 6 548 6 220 1 070 5 050 4 722 4 266 3 777 4 454
Total Current Assets 966 397 1 021 954 1 181 928 1 041 168 1 285 547 1 353 606 1 421 168 1 489 532 1 547 967
% sales 11.9% 11.3% 13.4% 11.9% 13.9% 13.9% 13.9% 13.9% 13.9%
Trade and other payables 1 693 113 1 518 843 1 952 848 1 710 828 1 998 010 2 104 798 2 210 907 2 318 500 2 408 968 Other current financial liabilities (Personnel and
supplier of fixed assets) 136 189 145 679 134 642 148 865 141 344 142 632 141 871 143 678 142 381
Total Current Liabilities -1 829 302 -1 664 522 -2 087 490 -1 859 693 -2 139 354 -2 247 431 -2 352 778 -2 462 178 -2 551 350
% sales 22.5% 18.5% 23.7% 21.2% 23.1% 23.1% 23.0% 23.0% 22.9%
Net Working Capital -862 905 -642 568 -905 562 -818 525 -853 807 -893 824 -931 610 -972 646 -1 003 382
% sales -11% -7% -10% -9% -9% -9% -9% -9% -9%
DIA COMPANY REPORT
Disclosures and Disclaimers
Report Recommendations
Buy Expected total return (including expected capital gains and expected dividend yield) of more than 10% over a 12-month period.
Hold Expected total return (including expected capital gains and expected dividend yield)
between 0% and 10% over a 12-month period.
Sell Expected negative total return (including expected capital gains and expected
dividend yield) over a 12-month period.
This report was prepared by Hugo Seia, a Master in Finance student of Nova School of Business & Economics (“Nova SBE”), within the context of the Field Lab – Equity Research.
This report is issued and published exclusively for academic purposes, namely for academic evaluation and masters graduation purposes, within the context of said Field Lab – Equity Research. It is not to be construed as an offer or a solicitation of an offer to buy or sell any security or financial instrument.
This report was supervised by a Nova SBE faculty member, acting merely in an academic capacity, who revised the valuation methodology and the financial model.
Given the exclusive academic purpose of the reports produced by Nova SBE students, it is Nova SBE understanding that Nova SBE, the author, the present report and its publishing, are excluded from the persons and activities requiring previous registration from local regulatory authorities. As such, Nova SBE, its faculty and the author of this report have not sought or obtained registration with or certification as financial analyst by any local regulator, in any jurisdiction. In Portugal, the author of this report is not registered with or qualified under COMISSÃO DO MERCADO DE VALORES MOBILIÁRIOS (“CMVM”, the Portuguese Securities Market Authority) as a financial analyst. No approval for publication or distribution of this report was required and/or obtained from any local authority, given the exclusive academic nature of the report
.
The additional disclaimers also apply:
USA: Pursuant to Section 202 (a) (11) of the Investment Advisers Act of 1940, neither Nova SBE nor the author of this report are to be qualified as an investment adviser and, thus, registration with the Securities and Exchange Commission (“SEC”, United States of America’s securities market authority) is not necessary. Neither the author nor Nova SBE receive any compensation of any kind for the preparation of the reports.
DIA COMPANY REPORT
Germany: Pursuant to §34c of the WpHG (Wertpapierhandelsgesetz, i.e., the German Securities Trading Act), this entity is not required to register with or otherwise notify the Bundesanstalt für Finanzdienstleistungsaufsicht (“BaFin”, the German Federal Financial Supervisory Authority). It should be noted that Nova SBE is a fully-owned state university and there is no relation between the student’s equity reports and any fund raising programme.
UK: Pursuant to section 22 of the Financial Services and Markets Act 2000 (the “FSMA”), for an activity to be a regulated activity, it must be carried on “by way of business”. All regulated activities are subject to prior authorization by the Financial Conduct Authority (“FCA”). However, this report serves an exclusively academic purpose and, as such, was not prepared by way of business. The author - a Masters’ student - is the sole and
exclusive responsible for the information, estimates and forecasts contained herein, and for the opinions
expressed, which exclusively reflect his/her own judgment at the date of the report. Nova SBE and its faculty have no single and formal position in relation to the most appropriate valuation method, estimates or projections used in the report and may not be held liable by the author’s choice of the latter.
The information contained in this report was compiled by students from public sources believed to be reliable, but Nova SBE, its faculty, or the students make no representation that it is accurate or complete, and accept no liability whatsoever for any direct or indirect loss resulting from the use of this report or of its content. Students are free to choose the target companies of the reports. Therefore, Nova SBE may start covering and/or suspend the coverage of any listed company, at any time, without prior notice. The students or Nova SBE are not responsible for updating this report, and the opinions and recommendations expressed herein may change without further notice.
The target company or security of this report may be simultaneously covered by more than one student. Because each student is free to choose the valuation method, and make his/her own assumptions and estimates, the resulting projections, price target and recommendations may differ widely, even when referring to the same security. Moreover, changing market conditions and/or changing subjective opinions may lead to significantly different valuation results. Other students’ opinions, estimates and recommendations, as well as the advisor and other faculty members’ opinions may be inconsistent with the views expressed in this report. Any recipient of this report should understand that statements regarding future prospects and performance are, by nature, subjective, and may be fallible.
This report does not necessarily mention and/or analyze all possible risks arising from the investment in the target company and/or security, namely the possible exchange rate risk resulting from the security being denominated in a currency either than the investor’s currency, among many other risks.
The purpose of publishing this report is merely academic and it is not intended for distribution among private investors. The information and opinions expressed in this report are not intended to be available to any person other than Portuguese natural or legal persons or persons domiciled in Portugal. While preparing this report, students did not have in consideration the specific investment objectives, financial situation or particular needs
DIA COMPANY REPORT
of any specific person. Investors should seek financial advice regarding the appropriateness of investing in any security, namely in the security covered by this report.
The author hereby certifies that the views expressed in this report accurately reflect his/her personal opinion about the target company and its securities. He/ She has not received or been promised any direct or indirect compensation for expressing the opinions or recommendation included in this report.
The content of each report have been shown or made public to restricted parties prior to its publication in Nova SBE’s website or in Bloomberg Professional, for academic purposes such as its distribution among faculty members for students’ academic evaluation.
Nova SBE is a state-owned university, mainly financed by state subsidies, students tuition fees and companies, through donations, or indirectly by hiring educational programs, among other possibilities. Thus, Nova SBE may have received compensation from the target company during the last 12 months, related to its fund raising programs, or indirectly through the sale of educational, consulting or research services. Nevertheless, no compensation eventually received by Nova SBE is in any way related to or dependent on the opinions expressed in this report. The Nova School of Business and Economics does not deal for or otherwise offer any investment or intermediation services to market counterparties, private or intermediate customers.
This report may not be reproduced, distributed or published, in whole or in part, without the explicit previous consent of its author, unless when used by Nova SBE for academic purposes only. At any time, Nova SBE may decide to suspend this report reproduction or distribution without further notice. Neither this document nor any copy of it may be taken, transmitted or distributed, directly or indirectly, in any country either than Portugal or to any resident outside this country. The dissemination of this document other than in Portugal or to Portuguese citizens is therefore prohibited and unlawful.