F
ACULDADE DEE
NGENHARIA DAU
NIVERSIDADE DOP
ORTOAutomatic comparison of interactomes
Igor Guterres de Carvalho
Mestrado Integrado em Engenharia Informática e Computação Supervisor: Rui Camacho
Co-Supervisor: Jorge Vieira Co-Supervisor: Cristina Vieira
Automatic comparison of interactomes
Igor Guterres de Carvalho
Abstract
Cells are the basic building blocks of life. The cell nucleous houses DNA, where genes are. On the other hand, most genes contain the information needed to make functional molecules called proteins. Using protein protein interactions (PPI) it is possible to create biological networks which can be named interactomes. The knowledge on interactomes is essential for our understanding of cellular functions and the origin of many diseases. However, it is not trivial to compare such networks, since the name of proteins varies from species to species, besides that, networks were mostly established in model species such as humans and only 10% of protein interactions were predicted.
Since there is a lot of common metabolic networks among different species one can use the information of a specific interactome of a well-studied species and look for "missing interactions" in a, not so well, studied species. Biological research will then focus on detecting the predicted interactions in the less studied species instead of making a "blind search for interactions".
The main goal of this dissertation is to design, implement and test, a tool (EvoPPI), that enables the comparisons of interactomes that belongs to same or different species and to identify those genes that encoded interacting proteins in the two interactomes.
It is possible to automate tedious and time-consuming tasks that researchers need to do when dealing with protein interactome data but at the same time keep the require flexibility. Experiment tests revealed positive results and the software application is already fully functional and very useful for researchers in the field of biological sciences.
Resumo
As células são o bloco de construção básico da vida. O núcleo da célula contem DNA, onde se encontram os genes. Por outro lado, a maioria dos genes contém as informações necessárias para criar moléculas funcionais chamadas proteínas. A utilização de interacções proteínas-proteínas (PPI) possibilita a criação de redes biológicas denominadas interatomas. O conhecimento dos interactomas é essencial para a compreensão das funções celulares e a origem de muitas doenças. No entanto, a comparação de redes biológicas é um processo trabalhoso e moroso, uma vez que o nome das proteínas varia entre espécies e as redes até agora identificadas foram maioritariamente estudadas em espécies modelo tal como humanos, onde se prevê que apenas 10% das interações tenham sido determinadas.
A existência de uma grande quantidade de redes metabólicas comuns entre diferentes espécies, possibilita a utilização de informação do interatoma de uma espécie bem estudada para encontrar "interações em falta" em espécies menos estudadas. Desta forma a pesquisa biológica conseguirá prever interações em espécies menos estudadas em vez de fazer uma “pesquisa cega de inter-acções”.
O objetivo principal desta dissertação é projetar, implementar e testar, uma ferramenta infor-mática (EvoPPI), que permite a comparação de interactomas pertencentes a espécies iguais ou diferentes e identificar os genes que codificam proteínas que interactuam em dois interactomas.
È possivel automatizar tarefas demoradas e repetitivas que os investigadores têm de fazer quando lidam com dados de interactomas mas ao mesmo tempo manter a flexibilidade requerida. Os testes experimentais demonstraram resultados positivos e o software está completamente fun-cional e já se revela bastante útil para os investigadores no campo das ciêncas biológicas.
Acknowledgements
Firstly, I would like to express my sincere gratitude to professor and supervisor Rui Camacho (FEUP) for his willingness. I extend the same gratitude to my co-supervisor, Cristina Vieira (i3S) for her patience and motivation in answering my questions.
I would also to thank Jorge Vieira (i3S) and Sara Rocha (i3S) for all the knowledge transmitted in a new field of study which was fundamental to my progress.
To my family for all the support during this interesting challenge. In particular to my brother Mário Carvalho for his patience, motivation and for the computer tips that were crucial.
Lastly, but definitely not least, a very special thank you to all my friends from FEUP, that were always available when help was needed. In particular, I want to thank Ricardo Neves who provided insight and expertise in some crucial decisions, that without him this would be a long and more difficult journey.
“Great things in business are never done by one person. They’re done by a team of people.”
Contents
1 Introduction 1
1.1 Context . . . 1
1.2 Motivation and goals . . . 1
1.3 Structure of the Dissertation . . . 2
2 Literature review 3 2.1 Concepts . . . 3 2.1.1 Gene . . . 3 2.1.2 Protein . . . 3 2.1.3 Interactome . . . 3 2.2 Data visualization . . . 6 2.3 Technologies . . . 7
2.3.1 Hypertext Markup Language (HTML) and Cascading Style Sheets (CSS) 7 2.3.2 Node.js . . . 7
2.3.3 Model-View-Controller (MVC) . . . 8
2.3.4 Asynchronous JavaScript And XML (AJAX) . . . 9
2.3.5 HyperText Transfer Protocol (HTTP) . . . 9
2.3.6 Database . . . 10
2.3.7 WebGL . . . 11
2.3.8 Blast . . . 11
2.4 Conclusions . . . 12
3 EvoPPI - Platform for interactome analysis 13 3.1 Context . . . 13
3.1.1 Concepts . . . 13
3.1.2 Input Data . . . 14
3.2 Architecture and design . . . 15
3.2.1 Deployment diagram . . . 15
3.2.2 Use cases . . . 16
3.3 Implementation . . . 17
3.3.1 Input and file generation . . . 17
3.3.2 Species interactome comparison . . . 19
3.3.3 Output representation and export . . . 26
3.3.4 Script . . . 27
CONTENTS
4 Case Studies 31
4.1 Test Environment . . . 31
4.2 Considerations . . . 31
4.3 Upload data . . . 32
4.4 Same species interactome analysis . . . 33
4.4.1 Analysis data set . . . 33
4.4.2 Methodology . . . 33
4.4.3 Results . . . 33
4.5 Different species analysis . . . 36
4.5.1 Analysis data set . . . 36
4.5.2 Methodology . . . 36
4.5.3 Results . . . 38
4.6 Species interactome prediction analysis . . . 39
4.6.1 Interactome prediction results . . . 40
4.7 Script case . . . 41
5 Conclusion and future work 43 5.1 Future work . . . 43
References 45 A Examples of Biological Information 49 A.1 Dictionary file example . . . 49
A.2 Fasta file example . . . 50
A.3 BLAST output file example . . . 53
A.4 Interactome file example . . . 56
List of Figures
2.1 Summary of web page features of repositories of PPI or genetic-genetic interac-tions. Dark blue – feature is present; light blue – feature is not present; green – feature is not present, but it is possible to structurally resolve interaction information. 6
2.2 Node.js processing model . . . 8
2.3 MVC model . . . 8
2.4 Comparing the traditional web application with AJAX model [Jes05] . . . 9
2.5 BLAST algorithm . . . 12
3.1 Deployment Model . . . 15
3.2 Use case model . . . 16
3.3 General scheme . . . 17
3.4 Scheme of the applied method for same species comparison . . . 20
3.5 BLAST schema . . . 22
3.6 Scheme of the applied method for species comparison . . . 24
3.7 Activity diagram related to compare species . . . 24
3.8 Scheme representing levels . . . 25
3.9 Front-end flow chart . . . 29
4.1 Upload page . . . 32
4.2 Same species parameters . . . 33
4.3 Results for CG1007 . . . 34
4.4 Flybase gene CG10007 (Tango9) information . . . 34
4.5 Results for Gapd (Gapdh1) . . . 35
4.6 Flybase gene Gapd (Gapdh1) information . . . 36
4.7 Experiment one (polo) compare different species parameters . . . 37
4.8 Experiment two (TRIM32) compare different species parameters . . . 37
4.9 Results related to Drosophila and Oryctolagus comparison . . . 38
4.10 Results related to Oryctolagus and Drosophila comparison . . . 39
4.11 Level two results related to Oryctolagus and Drosophila comparison . . . 39
4.12 Predict interactome parameters . . . 40
4.13 Predict interactome results . . . 40
LIST OF FIGURES
List of Tables
2.1 Number of interactions for a paricular organism in the main publicity available protein-protein interaction databases . . . 4 2.2 Information on the number of organisms available and URL of publicly available
protein-protein interaction databases . . . 5 4.1 Testing machine specifications . . . 31
LIST OF TABLES
Abbreviations
BLAST Basic Local Alignment Search Tool CSS Cascading Style Sheets
DNA Deoxyribonucleic acid GBFF GenBank File Format HTTP Hypertext Transfer Protocol HTML HyperText Markup Language MVC Model View Controller
NCBI National Center for Biotechnology Information PPI Protein Protein Interactions
SQL Structured Query Language
RNA Ribonucleic acid
UI User Interface
WebGL Web Graphics Library XML Extensible Markup Language
Chapter 1
Introduction
The cell is the fundamental unit of all living organisms and is known as the building block of life. The basic functions of cells are the result of complex interactions between DNA, RNA, proteins and small molecules. Proteins are encoded by genes and the study of the interactions among proteins (protein interactome) is considered to be essential to predict how the way an organism looks like (phenotype) from the information contained in the genome. A large effort has been made for model organisms in order to characterize their protein interactome but it is unclear whether all interactions have been characterized for any organism. This process is time consuming and costly and thus it is feasible, at present for model organisms. Therefore it is important to have a simple way of comparing the information from different experiments within and between species.
The protein interactions are stored in many different databases, in different formats, and none allows the flexible comparison of data between different species.
1.1
Context
There are a lot of incomplete interactomes from a reduced number of species and it is predicted that thousands of molecular interactions are still to be discovered, these could be predicted from the comparison of the partial data obtained from different experiments for the same and different species. Therefore, computational processes are imperative to explore the existing data.
1.2
Motivation and goals
The main goal of this dissertation is to develop a software application that helps researchers to improve their work by comparing data automatically from different experiments and transferring knowledge automatically from one well studied species to other less well studied species, reducing the cost, time and effort needed to perform their work.
Introduction
There are still only a few known interactomes in a reduced number of species, but these are essential for understanding cellular functions and the origin of many diseases.
1.3
Structure of the Dissertation
Besides the introduction, this document is composed by four additional chapters. Chapter 2 intro-duces some basic biology and protein protein interaction concepts that are important to understand the problems with which this dissertation deals. Furthermore, it is described technology concepts that can be used on this dissertation. Chapter 3 describes defined concepts that were essential to understand and for the development process. Shows the basic system architecture and design. Ex-plains how each functionality was implemented within the system work-flow. Chapter 4 presents case studies that gives a chance to use and test data of a real-world problem, explaining details from many different points. Chapter 5 sums up the fulfillment and how important was to imple-ment the automatic tool. It also presents future possible improveimple-ments.
Chapter 2
Literature review
In this chapter, we first present some key biological concepts, then we review the available tools to address the problems at hand and show their limitations. Lastly, we briefly review the available tools that are useful for the implementation of a software application aimed at solving the existing problems.
2.1
Concepts
Key biological concepts are now reviewed.
2.1.1 Gene
Genes are the basic units of heredity that are encoded in the nuclear DNA. Most genes encode one or multiple proteins that may interact with proteins encoded by the same or other genes, in order to perform their function. Abnormal protein interactions may damage a healthy cell and lead to disease.
2.1.2 Protein
Proteins, known as the gene product, are the most active biomolecules of cells. Proteprotein in-teractions (PPI) lead to complex networks that must be characterized in order to better understand how living organisms work.
2.1.3 Interactome
The interactome is the set of all interactions(PPI) inside the cells. Within the cell, most interac-tions occur between proteins (protein interactome). PPI data have been obtained by many different experimental methodologies (in-vivo, in-vitro, in-silico) giving rise to a large volume of data that
Literature review
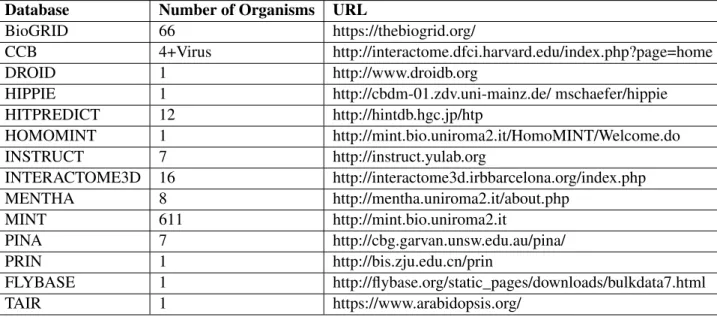
has been stored at several large centralized repositories, that may show some overlap, includ-ing BioGRID [CaOB+17]; CCSB [RTC+14]; DroID [MPY+11]; FlyBase [AFG+16]; HIPPIE [ALANS17]; HitPredict [LNP15]; HomoMINT [PCG+05]; INstruct [MDWY13]; Interactome3d [MCA12]; mentha [CCC13]; MINT [LBP+12]; PINA [CPK+12]; PRIN [ZGY+10] and TAIR [BRL+15]. Each database is focused on a particular organism or set of organisms, and the data was compiled in different ways, and thus, often, a database shows a set of interactions not found in the others. Not all organisms are covered by the different databases (shown in tables 2.1 and 2.2).
Table 2.1: Number of interactions for a paricular organism in the main publicity available protein-protein interaction databases
Database Data set Organism #Interactions
BioGRID1 BioGRID Homo sapiens 369 198
Hippie2 Hippie Homo sapiens 287 357
Interactome 3D3 Interactome 3D Homo sapiens 58 931
Tair4 Nbrowse interactions Arabidopsis thaliana 8 993
Tair Protein interaction Arabidopsis thaliana 2 656
Flybase5 Physical interactions Drosophila melanogaster 35 445
Flybase Genetic Interactions Drosophila melanogaster 16 144
PRIN6 High Coverage Orysa sativa 1 144 911
PRIN Multi Species Confidence Orysa sativa 45 852
BioGRID7 BioGRID Zea mays 18
BioGRID BioGRID Malus domestica 0
1https:wiki.thebiogrid.orgdoku.phpstatistics 2http:cbdm-01.zdv.uni-mainz.de mschaeferhippie 3http://interactome3d.irbbarcelona.org/index.php 4https:www.arabidopsis.org 5http:flybase.orgstatic_pagesdownloadsbulkdata7.html 6http:bis.zju.edu.cnprin 7http:bis.zju.edu.cnprin 4
Literature review
Table 2.2: Information on the number of organisms available and URL of publicly available protein-protein interaction databases
Database Number of Organisms URL
BioGRID 66 https://thebiogrid.org/
CCB 4+Virus http://interactome.dfci.harvard.edu/index.php?page=home
DROID 1 http://www.droidb.org
HIPPIE 1 http://cbdm-01.zdv.uni-mainz.de/ mschaefer/hippie
HITPREDICT 12 http://hintdb.hgc.jp/htp HOMOMINT 1 http://mint.bio.uniroma2.it/HomoMINT/Welcome.do INSTRUCT 7 http://instruct.yulab.org INTERACTOME3D 16 http://interactome3d.irbbarcelona.org/index.php MENTHA 8 http://mentha.uniroma2.it/about.php MINT 611 http://mint.bio.uniroma2.it PINA 7 http://cbg.garvan.unsw.edu.au/pina/ PRIN 1 http://bis.zju.edu.cn/prin FLYBASE 1 http://flybase.org/static_pages/downloads/bulkdata7.html TAIR 1 https://www.arabidopsis.org/
2.1.3.1 Database features and limitations
It is worthwhile to refer that Flybase and TAIR are also the main genetic information resource for Drosophila and Arabidopsis species, respectively. In all the databases webpages, it is pos-sible to download all PPI data that can be divided in data sets. Further in all except TAIR, it is also possible to use the webpages of the repositories to do PPI searches for a protein of in-terest, using different search parameters such as gene symbol, UniProt identifier, or Entrez gene id. In all databases except PRIN [ZGY+10] the results can be retrieved in a table format. Only MINT webpage [LBP+12] allows the download in the same table of the PPI of homonimous (with the same name) proteins. The results can be obtained as networks in BioGRID [CaOB+17], DroID [MPY+11], FlyBase [AFG+16], HIPPIE [ALANS17], HitPredict [LNP15], HomoMINT [PCG+05],Interactome3d [MCA12], mentha [CCC13], MINT [LBP+12], PINA [CPK+12]; PRIN [ZGY+10]. Databases like BioGRID [CaOB+17], DroID [MPY+11], HIPPIE [ALANS17], Hit-Predict [LNP15], and mentha [CCC13] present results with confidence scoring for the interactions. All databases allow link-outs to get information about the proteins. None allows the direct com-parison of different protein interactomes available for the same species, nor the comcom-parison of interactomes from different species, where orthologous genes have different names.
Literature review
Figure 2.1: Summary of web page features of repositories of PPI or genetic-genetic interactions. Dark blue – feature is present; light blue – feature is not present; green – feature is not present, but it is possible to structurally resolve interaction information.
It is difficult to say that a given database is better than the others, since different researchers will attach different confidence levels to different datasets obtained using different methodologies. Just counting how many times a given interaction has been reported in the different databases may be misleading because some datasets have been obtained by adding more data to already existing datasets available in other databases. Moreover, for the purpose of hypothesis testing it is sometimes preferable to have a list of possible interactions that include a large number of true interactions, even though some false positives will be included, than to have a very small list of true interactions. When comparing different species, especially distantly related ones, it is not always obvious what are the orthologous genes, since a one to one relationship is not always found due to gene duplications (either whole genome duplications and local duplications) that may have occurred in the lineage leading to one of the two species being compared. Therefore, researchers may need to evaluate the impact of the use of different criteria for orthology determination on their conclusions. In conclusion, the spread of the data over many different databases, the lack of a simple way of comparing the many different interactomes available for the same species, the different confidence levels that different researchers attach to different data sets, the lack of a flexible way for testing the impact of the use of different criteria for orthology determination, and the lack of a tool to transfer (infer) an interactome for a species for which there is none and where gene names are different, motivated the development of an application that allows addressing all these issues.
2.2
Data visualization
Data is collected and analyzed to create information suitable for making decisions. When huge volumes of information are available it is important to present information quickly and clearly.
Literature review
While tables are often more appropriate to perform additional analyses the graphical representation of data can improve human cognition by enhancing the human visual system’s ability to see pattern and trends.
2.3
Technologies
In this section we present the Web technologies and database needed for building the developed web application as well as others that are useful for further development (displaying data in graph-ical format for instance) that were not implemented due to limitation.
Currently with growth and usage of web technologies web applications bring benefits to the client, because there is no need to install software on several client computers.
2.3.1 Hypertext Markup Language (HTML) and Cascading Style Sheets (CSS) HTML and CSS8are the most important source technologies for building web pages. HTML pro-vides the structure of the page. CSS describes the representation of the structure page, represents colors, layout and fonts of the page.
2.3.2 Node.js
Node.js9 is a server side platform, built on chrome’s JavaScript runtime, for easily building fast and scalable network applications. Applications written in node.js can run in Unix and Windows operative systems. It also provides a rich library of various JavaScript modules which simplifies the development of web applications. Using the JavaScript language, node offers the possibility to program on server-side in a way that is similar to programming on the client side.
Traditional server, usually makes a complex query request to the database, which causes the server to block while waiting for a database response. Unlike traditional servers, Node.js uses the non-blocking feature. Below in figure 2.210shows the non-blocking process.
8https://www.w3.org/standards/webdesign/htmlcss
9https://www.tutorialspoint.com/nodejs/nodejs_introduction.htm
10Image collected from
Literature review
Figure 2.2: Node.js processing model
2.3.3 Model-View-Controller (MVC)
During the development of a web application sometimes there is an increase of structure com-plexity, which could cause confusion to the programmer. Therefore, exists a pattern called MVC (figure 2.3) in order to organize folders and files, which separates the user-interface from the sub-stance of the application [SSV+15]. The MVC is composed by three parts:
• Model - It is responsible for manipulating and validating the application data.
• View - The view is responsible for managing the user interface. Usually there are many views in a single application.
• Controller - The controller is responsible for receiving the user requests and translate them into actions that the Model should take. Then it sends back the response to the appropriate view.
Figure 2.3: MVC model
Literature review
2.3.4 Asynchronous JavaScript And XML (AJAX)
AJAX (figure 2.4) consists of a set of specific programming techniques for web applications. This technique allows to perform actions on the web-page without a fully refresh page. This does not mean that no connections are done to the server. The browser still make requests to the server but asynchronously.
Figure 2.4: Comparing the traditional web application with AJAX model [Jes05]
2.3.5 HyperText Transfer Protocol (HTTP)
The goal of HTTP is to provide a convenient way to transfer files, according to the client-server model, with a special predominance in transferring data from server to client.
The HTTP standard defines various methods and the methods used in this thesis are:
• GET : used to collect information identified by the request URI (Uniform Resource Identi-fier).
Literature review
2.3.6 Database
Data is composed by number, text or any facts. Nowadays, data grows exponentially and exists in several formats, which is essential to process them by a computer. The process could follow a standard language that store, access and manipulate, creating the definition of database. So, a database is an organized collection of digital data.
2.3.6.1 SQL
SQL is a standard language for accessing and manipulating databases. Acordding to W3C (World Wide Web Consortium) [W3S99] SQL can:
• execute queries against a database • retrieve data from database • insert records in a database • update records in a database • delete records in a database 2.3.6.2 MongoDB
MongoDB11 is an open-source document database known as NOSQL database. The relational database has a typical design that shows number of tables and the relationship between these tables. While in MongoDB there is no concept of relationship and follow the structure in favor of JSON-like documents.
Database is a physical container for collections. Each database gets its own set of files on the file system. A single MongoDB server typically has multiple databases.
The advantages of mongoDB are:
• Schema less : MongoDB is document database in which one collection holds different different documents. Number of fields, content and size of the document can be differ from one document to another.
• Structure of a single object is clear • No complex joins
• Deep query-ability. MongoDB supports dynamic queries on documents using a document-based query language that’s nearly as powerful as SQL
• Ease of scale-out: MongoDB is easy to scale
• Conversion / mapping of application objects to database objects not needed
• Uses internal memory for storing the (windowed) working set, enabling faster access of data
11https://www.tutorialspoint.com/mongodb/mongodb_overview.htm
Literature review
2.3.7 WebGL
WebGL (Web Graphics Library)12is the new standard for 3D graphics on the Web, It is designed for the purpose of rendering 2D graphics and interactive 3D graphics. WebGL provides similar functionality of ES 2.0 (Embedded Systems) and performs well on modern 3D graphics hardware. It is a JavaScript API that can be used with HTML5. HTML5 has several features to support 3D graphics such as 2D Canvas, WebGL, SVG, 3D CSS transforms, and SMIL.
The advantages of WebGL are:
• WebGL applications are written in JavaScript. Using these applications, you can directly interact with other elements of the HTML Document. You can also use other JavaScript libraries for example jquery and HTML technologies to enrich the WebGL application. • WebGL is an open source. You can access the source code of the library and understand
how it works and how it was developed.
• JavaScript is a half-programming and half-HTML component. To execute this script, there is no need to compile the file. Instead, you can directly open the file using any of the browsers and check the result. Since WebGL applications are developed using JavaScript, there is no need to compile WebGL applications as well.
• JavaScript supports automatic memory management. There is no need for manual allocation of memory. WebGL inherits this feature of JavaScript.
• Since WebGL is integrated within HTML 5, there is no need for additional set up. To write a WebGL application, all that you need is a text editor and a web browser.
2.3.8 Blast
Blast [NCB11] is a technology implemented for biologists , and the tool’s goal is to find similarity between nucleotide or protein sequences. More specifically, BLAST uses an alignment process, which consists in matching up two or more sequences to achieve maximal levels of identity, for the purpose of assessing the degree of similarity and the possibility of homology (a gene related to a second gene). It also uses HSP(High-scoring Segment Pair) that finds highest alignment scores in a given search. Below in figure shows an example of matching two sequences(query and target sequence) with HSP. The tool has several formats when retrieving data such as, HTML, XML and plain text.
Literature review
Figure 2.5: BLAST algorithm
2.4
Conclusions
Collecting, storing and analyzing experimental data within context of scientific investigation re-quires cost, time and effort. So it is important to process scientific data and present them quickly and clearly. Cost, time and effort constraints can be lowered by developing an application contain-ing major approaches.
Web applications are important because of flexibility that they offer, in the sense that is possi-ble to access application from any computer. Nowadays since there is a lot of technology for web applications it is easier to update, maintain and support.
After processing the data the use of computer graphics are important to assist researchers in a way that amplify human cognition.
So the combinations of methods such as, visualization techniques within a web application allows researchers to see concepts in a more interesting and often more useful manner.
Chapter 3
EvoPPI - Platform for interactome
analysis
This chapter, starts by presenting the architecture and design of the implemented solution. Later, structures and characteristics of data will be detailed, as well as, details about platform implemen-tation.
3.1
Context
In this dissertation, all data related with species interactomes was collected from several databases as shown in Table 2.1.
Data is generated experimentally within context of scientific investigation and sometimes this data is unorganized. Therefore it was important to study the data structure and its characteristics, to be possible to parse and store it in a more organized way.
3.1.1 Concepts
Before introducing the collected data and since it uses concepts that may not be completely clear for readers, these concepts will be first introduced to make the following sections more under-standable.
• Query species/interactome: Usually the most studied species/interactome. It is used as a reference to compare with another species/interactome - target species/interactome. • Target species/interactome: It is generally the least known species/interactome and it
should be similar with query species/interactome. This species/interactome should become more known using query species/interactome genes correspondence.
EvoPPI - Platform for interactome analysis
• Fasta file format1: Nucleotide sequences must be in FASTA format. FASTA format
con-sists of a single definition line, beginning with a ">" and followed by optional text, and subsequent lines of sequence.
• Interactome file: A list of genes interactions within the same species. Represents the actual interactome.
• Blast2:BLAST [NCB11] finds regions of similarity between biological sequences. The
pro-gram compares nucleotide or protein sequences to sequence databases and calculates the statistical significance. This is the main approach used to establish gene homologies (corre-spondences) in different species.
• Locus_tag3: The locus_tag is a systematic gene identifier that is assigned to each gene. The
locus_tag must be unique for every gene of a genome.
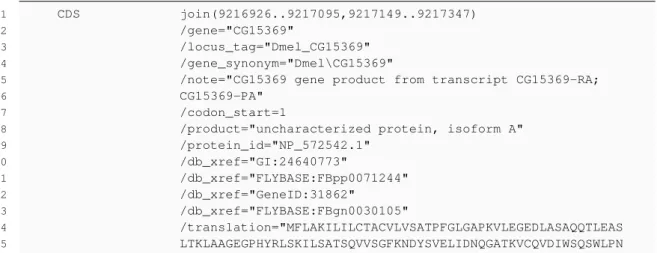
3.1.2 Input Data
In this subsection two types of files with relevant data will be explained in detail. In particular, it will be explained a file that belongs to NCBI [Nat11] database and the PPI data files that exists in several large centralized repositories.
3.1.2.1 GBFF Data file
In biology, it is possible that a gene is known by several different names (synonyms). In a GBFF (GenBank File Format) data file (see listing 3.1) the official gene name and its synonyms are repre-sented by /gene and /gene_synonym tags respectively. Two different unique identifiers, /locus_tag and /db_xref="GeneID:", are relevant too, because they are unique references. Lastly, the /trans-lation tag gives the protein sequence associated with a given CDS (coding sequence) of a gene. These files are available at NCBI database under the genome option and are also available for thousands of organisms.
3.1.2.2 Protein protein interaction Data
Protein-protein interactions (PPI) data are stored at many different databases in different file for-mats, although in all of them, the actual interactions are shown as pair of elements in different columns. The relevant stored information can be gene names and unique identifiers of several types. Therefore the automatic parsing of such files to produce data in a single standard format to be used by EvoPPI is a complex problem. It should be noted that the same database often changes the actual file structure by adding new layers of information as additional columns. The most commonly used interactome databases are shown in table 2.1
1https://www.ncbi.nlm.nih.gov/genbank/eukaryotic_genome_submission/#FASTA 2https://blast.ncbi.nlm.nih.gov/Blast.cgi
3https://www.ncbi.nlm.nih.gov/genbank/eukaryotic_genome_submission/#locus_tag
EvoPPI - Platform for interactome analysis
1 CDS join(9216926..9217095,9217149..9217347)
2 /gene="CG15369"
3 /locus_tag="Dmel_CG15369"
4 /gene_synonym="Dmel\CG15369"
5 /note="CG15369 gene product from transcript CG15369-RA;
6 CG15369-PA"
7 /codon_start=1
8 /product="uncharacterized protein, isoform A"
9 /protein_id="NP_572542.1" 10 /db_xref="GI:24640773" 11 /db_xref="FLYBASE:FBpp0071244" 12 /db_xref="GeneID:31862" 13 /db_xref="FLYBASE:FBgn0030105" 14 /translation="MFLAKILILCTACVLVSATPFGLGAPKVLEGEDLASAQQTLEAS 15 LTKLAAGEGPHYRLSKILSATSQVVSGFKNDYSVELIDNQGATKVCQVDIWSQSWLPN
Listing 3.1: GBFF fragment example from NCBI database
3.2
Architecture and design
3.2.1 Deployment diagram
In figure 3.1 it is shown the deployment diagram of architecture and technologies of EvoPPI. The diagram is composed by two nodes: client and server. The leftmost node consists on the interactions between the client and the web browser (front-end). On the other hand, the rightmost node is composed by three essential interconnected components: node.js, BLAST, and file system. These components combined, should perform all the essential operations after receiving client side requests (back-end).
EvoPPI - Platform for interactome analysis
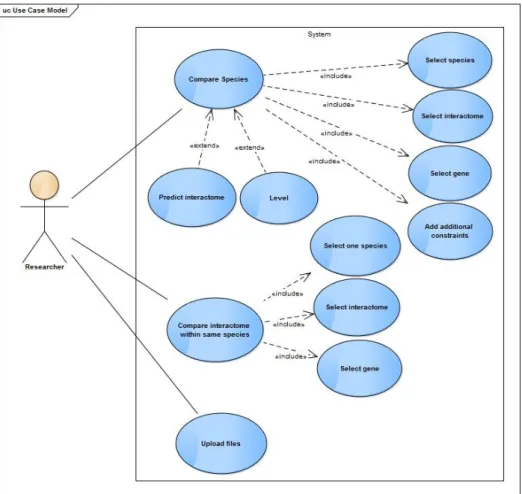
3.2.2 Use cases
It was designed an architectural software approach using the use case model as shown in figure 3.2. Next it will be explained the system behavior:
• The user should be able to upload data the data files needed by EvoPPI.
• The user should be able to compare different interactomes from same species, which in-cludes defining three options: select species, select interactomes and select gene.
• The user should be able to compare different species by specifying several options, such as, select species, select the gene, select interactomes and add additional constraints.
• The user should be capable of generating an interactome for a species by giving information from another species.
• The user should be able to expand the results
Figure 3.2: Use case model
EvoPPI - Platform for interactome analysis
3.3
Implementation
The software was implemented using Node.js applying different public modules in order to support the development process. The built platform uses the MVC architecture and it was designed to run on an Internet browser supporting multiple devices and operating systems. It can be separated in three logic parts:
• Input and file generation; • Species comparison; • Output data export.
A general schema of the implemented system is presented in figure 3.3, where each logical component is represented. These logical components were developed from scratch and they will be described next in sections 3.3.1, 3.3.2 and 3.3.3.
Figure 3.3: General scheme
3.3.1 Input and file generation
As it is represented in figure 3.3, it is possible to upload two different kinds of files (GBFF and PPI database files) 3.1.2. Each file will be used to generate one or more internal files which allow distribution of the information. Some of these files can be used for calling external tools (BLAST).
EvoPPI - Platform for interactome analysis
It is possible for the user to upload each file separately, which will update only the internal files related to it.
In order to simplify the data processing several modules from Node.js were used:
• Stream module - This module was used on upload process. It creates a pipe that takes the output of one stream (client) and feeds it into the input of another stream (server).
• File System module - The file system module is used after storing the data to read files and construct internal files data structure.
Subsection 3.3.1.1 explains in more detail each generated internal files structure. 3.3.1.1 File generation
While for intra-species comparisons only two types of files are needed (dictionary and interactome file), in order to perform the comparative analysis of two species, three files are needed, and will be created to store the data provided on upload process. Next, each file structure will be explained in more detail:
• Dictionary file: The dictionary file (see listing 3.2) is created after parsing GBFF file. As the name implies it contains a list of gene information. As it was explained in previous sections each gene can have several distinct names. Consequently the dictionary needs to have a list of all these synonyms, a locus_tag and the gene_id that represent unique identifiers.
1 Dmel_CG17636 CG17636 Dmel\CG17636 EG:23E12.1 5740847
2 Dmel_CG17707 CG17707 Dmel\CG17707 EG:23E12.3 5740408
3 Dmel_CG3038 CG3038 dbeta3GnT Dmel\CG3038 EG:BACR37P7.1 GalT3 30970
Listing 3.2: example fragment of the dictionary file
• Fasta file: The fasta file (see listing 3.3) is generated after parsing GBFF file but unlike the dictionary only the locus_tag and translation are relevant. Each block contains a line beginning with greater than sign followed by the locus_tag and subsequent lines represent the translation. The file structure was built this way, in order to ensure compatibility with BLAST tool that will receive this file as input.
1 >LOC104970773 2 MLCHLMWKIIALRNRSGKLSVQLEIRTFLVLTVHMPRGYQDARRFRINVLITLAIFIFIFSLTLQVIINI 3 STLSKFQPPQTLQRMQVENSSVKTQFFLLGVSDHPELQSALFAVFLSIYSVTLMGNLGMILLITASPPLH 4 TPMYFFLRILSFVDACYSSVIAPKLLVGLISDKKTISYNGCAAQLYFFCCLEDIESFLLTVMAYDQYIAI 5 >CLIC6 6 MAGVAELDGGAPRPRSPSGGPALQAERRDEPEAAGPKAQREEAREGPAEAPGGEGAGAAATAAGPEGEGP
Listing 3.3: example fragment of the fasta file
EvoPPI - Platform for interactome analysis
• Interactome file: The Interactome file (see listing 3.4) that EvoPPI needs, contains all interaction between genes/proteins, more specifically, each line is made up of a pair of interacting genes/proteins separated by a tab.
1 PP1CA SNF1 2 HSPA14 STIP1 3 HSP90AB1 STIP1 4 NR3C1 STIP1 5 PTEN SLC9A3R1 6 calA TNNI2 7 CALM TNNI2 8 calA TNNI2 9 TNNT3 TNNC1 10 TNNT3 TNNI2
Listing 3.4: example fragment of the interactome file
3.3.2 Species interactome comparison
Interactomes mediate most cellular processes and the importance of understanding how a biolog-ical system works require analysis of comprehensive interaction data for all the proteins encoded by genes. For years through experiments, several types of data were generated, creating a large volume that was compiled and stored in several large centralized repositories. Some interactomes data are available in several databases, but each has different data set with different focus and set of unique interactions not found in the others.
The main objective of this thesis is to transform a complex, manual and time-consuming anal-ysis process into an automated tool. The platform should require as little information as possible from the user, adding parameters if necessary. It should also be able to automatically compare interactomes within the same species or between different species, by giving a specific gene that needs to be studied.
3.3.2.1 Same species
Within an organism the PPI varies (from a few to dozen) in different databases (table 2.1). So, to get a complete set of interactions for any gene, the data from the different interactomes must be integrated.
• Searching species, genes and interactomes - When the web interface is loaded, the first task is to search and list the species, this task is accomplished by listing each dictionary file name since there is only one for each species. The remaining searches are carried out according to the species information given by the user and consists in searching all the genes and interactomes inside dictionary file and the interactome file respectively.
EvoPPI - Platform for interactome analysis
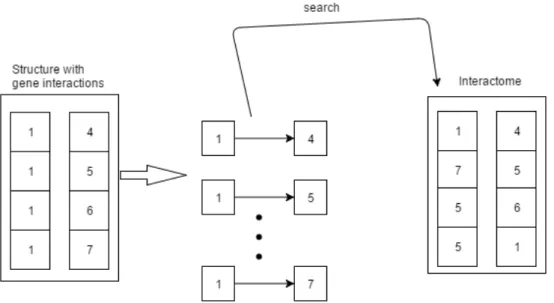
• Algorithm overview - Later, as soon as all necessary data are filled by the user and the request is made to the server for comparison, the algorithm starts. This algorithm will then use the data chosen by the user. This data is composed by: query interactome, target interactomeand a gene to be studied, that is located on query species dictionary.
The first step is to look for all the interactions of the gene to be studied inside the query in-teractomeand target interactome then these interactions are stored in a structure constructed to accommodate this type of data. Once all the interactions are extracted and stored then the comparison algorithm starts. This algorithm consists of going through the interactions one by one and checking if they are contained in the target interactome. In figure 3.4, it is possible to verify that the gene named "1" was chosen to be studied. This gene is present in query interactome. Hence all interactions that this gene has inside query interactome are listed. After, it is verified if those listed interactions on query interactome are present or not in target interactome.
Figure 3.4: Scheme of the applied method for same species comparison
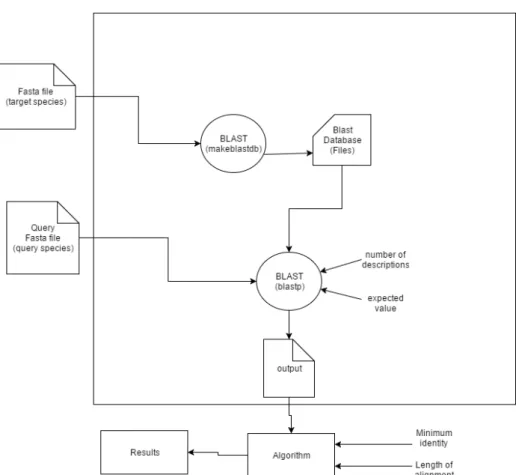
3.3.2.2 Compare two different species
In this subsection the main goal is to compare interactomes of two different species, but unlike the component where comparison of interactomes are made within the same species, here the names of the homologous genes varies from species to species. Therefore, during the development of this component it became necessary the integration of a tool that find equivalent genes between different species. This was accomplished by using the BLAST tool.
• Tool - BLAST is a software developed particularly for biologists, more specifically in the field of research. It contains a fast and effective algorithm that finds similar sequences,
EvoPPI - Platform for interactome analysis
by locating short matches between two sequences and extending the local homology by using local alignment algorithm. In other words, it requires a query sequence to search for, and a sequence to search against (also called the target sequence) or a sequence database containing multiple such sequences.
Figure 3.5 gives a blast schema that shows its work-flow inside the application. For this dissertation it is important to note that two commands to find similar genes between species are executed: makeblastdb and blastp. Before running BLAST its input files need to be generated, namely the target species fasta file and query species fasta file. After generating the target species fasta file that is explained in section 3.3.1, the first BLAST command can be executed (makeblastdb). This command generates a BLAST database file that will be the input of the blastp command. After the user chooses the gene to study, the query fasta filethat is composed by sequence of the chosen gene and its genes interactions on query interactome, is generated. In order to run the blastp command input parameters need to be specified namely, Number of descriptions and expected value. These parameters meaning are detailed bellow:
– Expected value and Number of descriptions4:The Expect value (E) is a parameter that describes the number of hits one can "expect" to see by chance when searching a database of a particular size. The lower the E-value, or the closer it is to zero, the more "significant" the match is. The number of descriptions is the maximum number of correspondence genes returned by BLAST in one hit. So, this values is used by the biologists (user) to obtain a more accurate result.
– Query sequence (Fasta file): From the moment the gene name is specified, the first step before executing the blast is to fetch all the gene information inside the query species interactome. By doing this last operation, a structure is then created with all pairs of interactions of the chosen gene. Then with this structure it is possible to create the query file in fasta format. So this file will contain information about the gene and all the genes it interacts with.
– Target sequence(BLAST database)5: This file, previously explained, contains all the information about the target species.
Finally after the blastp command is executed, the output will represent the correspondent genes on target species for the chosen gene and its interations on query species.
4https://www.ncbi.nlm.nih.gov/books/NBK279675/ 5https://www.ncbi.nlm.nih.gov/books/NBK279688/
EvoPPI - Platform for interactome analysis
Figure 3.5: BLAST schema
EvoPPI - Platform for interactome analysis
• Parse output file and algorithm - First, it is important to analyze the BLAST output struc-ture and extract the relevant data. An example of BLAST output is shown in listing 3.5. For the purpose of this dissertation it is important to focus on the first four elements of each line: – First and Second elements: The first column is the gene of the query species and the
second column is the gene of the target species that is equivalent to it. – Third element: Percentage of identity between the two sequences. – Fourth element: Size of the aligned high-scoring segment pair(HSP6).
1 RAB5A LOC101247094 65.025 203 63 3 14 214 4 200 2.33e-091 266
2 RAB5A LOC101261973 64.249 193 65 2 22 214 12 200 2.39e-085 251
3 RAB5A LOC101265393 59.314 204 75 3 13 214 3 200 8.21e-085 249
4 RAB4A LOC101257123 55.238 210 92 1 9 218 2 209 7.68e-079 235
5 RAB4A LOC101253324 51.923 208 100 0 9 216 2 209 4.55e-072 218
6 RAB4A LOC101263286 51.923 208 100 0 9 216 2 209 5.59e-072 218
7 RAB4A LOC101257123 55.288 208 91 1 27 234 4 209 8.25e-077 231
Listing 3.5: example fragment of the blast output
The next phase after the analysis of the structure is to parse the file according to the condi-tions given by the user. These condicondi-tions are related to HSP and percentage of identities. So the first procedure on parsing is to filter all results where the HSP size is lower than the size given by the user. Next procedure is to filter results that have percentage of identities lower than the percent given by the user.
After this filtering process is complete, this data is inserted in an internal structure. This internal structure stores genes that interact with chosen gene in the same query species in-teractome. In addition, for each one, the equivalent genes that belong to target species. Figure 3.6 gives an example of such structure where gene A is the gene chosen by the user for the query species and the genes 1 and 2 represent the equivalent genes for the target species. The genes named B and C represent genes for which the chosen gene interacts with on query species interactome. After the creation of the structure the algorithm will be ap-plied. Using this structure, the correspondence genes on target species will be combined in all possible combinations. Each gene combination represents a possible interaction on tar-get species, next for each possible combination, the algorithm will search the tartar-get species interactomein order to find out if this interaction is contained on its interactome or not. Finally the result of the algorithm is stored in a matrix designed to accommodate this type of data and that is presented in section 3.3.3.
EvoPPI - Platform for interactome analysis
Figure 3.6: Scheme of the applied method for species comparison
In Figure 3.7 an overview of the different species process is shown as a simple activity diagram composed by layers. Where layers are linked, which represents the information sent between them when an activity is performed.
Figure 3.7: Activity diagram related to compare species
EvoPPI - Platform for interactome analysis
• Levels - When comparing interactions of genes between species, from time-to-time a more detailed research is needed. Therefore the concept of levels was applied in order to expand the analysis data. This means that the user can see the direct interaction involving the chosen gene and those direct interaction involving the gene with which the chosen gene interacts. After the request action for next level is specified , the first step is to fetch all genes that in-teracts with the gene previously specified on the first level. Once all the genes are collected, it will be retrieved all the interactions, related to each, within query species interactome. However, it should be noted that it was taken into account that repeated interactions could be found, so it was necessary to, not include these interactions in order to avoid repeated data. So, following the genes processing operation, the system will perform all the proce-dures executed on the previous level(query file generation, blast execution, parse file output and comparison species algorithm) with a slightly difference, number of genes and interac-tions increased.
Figure 3.8 gives a visual representation of the interaction by levels of a given gene. For example, as the figure illustrates, if the interaction is of level 1, then the system will look for interactions involving initial gene and all genes which gene A interacts. On the other hand, if the interaction is of level 2, then the system will look for interactions involving genes, B, C and D and all genes that interacts with each, in this case genes E, F, G, H and so on.
EvoPPI - Platform for interactome analysis
• Predict interactome - Since gene names in different species are different it may be useful to transfer the information of the entire interactome of one species into another species(predict interactome). For this the user specifies no gene name. It should be noted that this action takes a long time because an interactome file may contain thousands of interactions, mean-ing that it will be sent to blast thousand of gene information followmean-ing by operations that need to be performed.
3.3.3 Output representation and export
The last step of the comparison module consists on the results presentation and subsequently the results export. Therefore in this section the types of representation for each of the comparative analyzes will be explained, namely the results for, same species comparison, comparison between different species, including levels and prediction procedures.
3.3.3.1 Same Species results
In the comparison between different interactomes within same species and after the application of the algorithm, it was decided that the representation should be a matrix composed by two columns. The first column lists genes for which the chosen gene interacts with. The second column lists three elements related to comparison results, namely, "interactome1", "interactome2" and "inter-actome1 and interactome2". So, for each element it means that, if the result is "inter"inter-actome1", the interaction pair is only present in the query species interactome, if the result is "interactome2", the interaction pair is only present in the target species interactome. Lastly, if the result is "interac-tome1 and interactome2" means that the interaction pair is present in both interactomes.
3.3.3.2 Different species results
The presentation of results regarding the comparison between different species is followed by the internal comparison algorithm. As explained in previous section during the comparison algorithm each correspondence gene combination, represents a possible interaction on target species. There-fore, it was decided that a 5-column matrix structure will be created, where the first and third columns represents the query species gene interactions and second and fourth columns represents the target species possible interactions. More precisely, the first column lists the chosen gene. The next and second column represents all the correspondence genes(according to the blast output) re-lated to the specified gene. The third column lists all the genes for which the chosen gene interacts with. The fourth column represents all the correspondence genes(according to the blast output) of the genes that interacts with the chosen gene. Lastly, the fifth column represents the results of the comparison algorithm, which should contain the following elements:
• "species1 and species2": It means that the interaction of the chosen gene is present in both species.
EvoPPI - Platform for interactome analysis
• "species1": In this case the interaction of the chosen gene is contained only in query species.
• "species2": This result means that the interaction is present in the target species but not in the query species. An important point to note is that in addition to this result columns one and three are also modified. These columns now contain a null parameter, implying that it is not possible to conclude which genes refers to, since this interactions is only present in target species. To get around this situation one would need to reverse the comparison species analyzed.
In relation to the levels it will be an expanded matrix according to the level requested by the user, where the significant difference will be noticed in the first column of the matrix where instead of appearing only the gene under study, it will also contain the genes of the following levels. 3.3.3.3 Predict species interactome results
Since the interactome prediction functionality is only focused on showing which possible interac-tions exists in target species, the comparison factor will not be applied in this case. Then, like the different species results, it will be displayed the same matrix table, but with a null element in the last column that refers to the comparison element.
3.3.3.4 Exportation
Besides browsing, users can download results as tab separated files. Two different types of data projections are provided: interactome predicted data and species comparison data. Both interac-tome predicted data and species comparison data can be exported in tab-separated values (TSV) format, with a slightly difference. Interactome predicted data is exported containing two values that represents all possible gene interactions from the target species. Concerning the comparison data, it can be transferred in the same format as it is presented to the user on the web browser page. 3.3.4 Script
Performing a large scale comparative analysis without using EvoPPI could mean that some re-sults are ready after weeks or months, since manual processing of species requires several steps. To overcome this issue, EvoPPI plataform was implemented as described in previous chapters. However, the platform usage may require several steps to be performed, one by one with BLAST executing between them. So, an alternative approach has been implemented, which in time to time can be advantageous and convenient, depending on the user condition at the moment. This alternative consists of a script that aims to offer the possibility of executing the entire procedure in one step in background through the command line. This script is composed not only by a set of instructions that call the essential modules, but also needs a configuration file to be parsed. This configuration file should contain a set of parameters that are also essential elements of the EvoPPI plataform for the comparison analysis. These parameters are: species under study, interactomes,
EvoPPI - Platform for interactome analysis
gene and additional constraints. An example of the configuration file is shown in listing 3.6. In order to run the script in a command line the user only needs to specify the command "node" followed by the name of the script.
1 Drosophila_melanogaster.txt Drosophila_melanogaster.txt
2 Drosophila_melanogaster_teste.txt Drosophila_melanogaster_teste2.txt
3 CG17636
4 0.05 204 3 100
Listing 3.6: example of configuration file
3.3.5 Front-end
In an Web-based application, the front-end is a segment of the application that interacts with the user and is connected to the server. In this thesis the front-end component was created having in mind the user usability. So, views were implemented following a set of concepts and technologies to provide, not only a finest navigation, but also preventing possible user lapses. The following technologies were used: HTML5, CSS3, Javascript, jQuery (Javascript library) and the Bootstrap framework. Regarding the interface, it was decided to develop a simple design, with few colors, little text and easy to use.
Next, through a flow-chart, structure and behavior of the EvoPPI front-end arhitecture will be described in detail. This flow-chart contains three types of arrows:
• Red-colored arrows represent Asynchrounous Javascript and XML (AJAX) transitions, which sends GET requests through HTTP headers and pulls content from server presenting results into one or more elements of UI.
• Blue-colored arrows represent Asynchrounous Javascript and XML (AJAX) transitions, which sends POST requests through HTTP headers.
• Black-colored arrows represent on-page javaScript events such as, tab switches and win-dow displays. However, it is important to point out that these events do not require AJAX calls and in most cases the content is already present in the browser but in a hidden state. What is also important to note is that white boxes (node) represents user actions on the view and yellow boxes (node) the view behavior after an action. Next figure 3.9 shows EvoPPI flowchart containing the upload view and compare species view.
EvoPPI - Platform for interactome analysis
EvoPPI - Platform for interactome analysis
Chapter 4
Case Studies
In this chapter it is presented a set of case studies. The first case study tests different interac-tomes within Drosophila melanogaster(fruit fly). The following case studies tests Drosophila melanogasterwith a similar species.
4.1
Test Environment
The machine’s specifications where EvoPPI was tested can be consulted in table 4.1. Table 4.1: Testing machine specifications
Testing machine specifications Operative System Ubuntu 16.10 yaketti 64bits
CPU Intel core i7-4710HQ
CPU speed 2.50 GHz
Memory 4 GB
4.2
Considerations
The input files that were uploaded for EvoPPI platform, were collected from two distinct sources: NCBI and DroID. Although it is possible to adapt the EvoPPI code to run on a remote server for a number of reasons discussed below EvoPPI was developed to run on localhost under any operative system. The three main reasons for wanting EvoPPI to run on localhost are the following:
• Private user space, running the platform on localhost enables, without any additional de-velopment, to provide a personal space since each user can have an instance running on their personal machine;
Case Studies
• Confidentiality, running the platform on localhost, prevents sensitive data to travel in an unsecured way. This is especially important in the academic and perhaps even more in the industrial context;
• Costs, running on local machine eliminates completely hosting and possible domain acqui-sition costs.
Since EvoPPI is supposed to run as localhost by researchers that may have little know how on how to install SQL or NoSQL databases. It was chosen to use a flat file system for storing the dictionary, protein fasta and interactome data, making the installation of the application triv-ial. Nevertheless, it is clear that using a database (SQL or NoSQL) would improve the platform performance, however since each user will have a private instance running on his/her machine, the amount of data will not have the proportions if all the users share a remote server.
4.3
Upload data
Firstly, since the EvoPPI needs specific files to execute for the case study analysis, all the infor-mation related to experiment has to be downloaded from above described sources, and further uploaded to the EvoPPI platform.
So, in order to upload files in EvoPPI platform, the user must do the following steps:
1. Visit upload page (Figure 4.1);
2. Drop and Drag file, or select collected input files;
3. Once the upload is complete, the user can submit for file generation.
Figure 4.1: Upload page
Case Studies
4.4
Same species interactome analysis
The aim of this experiment is to compare different interactomes within the same species, which gives the possibility to study interactions of a specific gene that is present in one interactome (query interactome), but may or may not be present in a second interactome (target interactome).
4.4.1 Analysis data set
This experiment studies the Drosophila melanogaster (fruit fly). Through NCBI (GBFF file), nearly 15.000 genes and protein sequence data was collected. Two genes were chosen for experi-ments: CG10007 and Gapd, in addition, two interactome files were collected from DroID, where according to DroID, one was generated from FlyBase and contains 19.356 interactions and the other generated from another database and contains 18.212 interactions. The first interactome file (FlyBase) is used as query interactome and the second as target interactome.
4.4.2 Methodology
The input data (GBFF and interactome files) was uploaded through the upload view within the platform and all essential files were generated (dictionary, fasta and interactome file). Then the species field is filled with existent species provided in input data. After choosing the species the interactome comparison fields information is filtered so that only interactomes from the chosen species is displayed. Next, it was selected the desired interactomes to be compared (mentioned above) and the gene. After performing all these steps, as shown in figure 4.2, it is possible to start this experiment by pressing the Compare button.
Figure 4.2: Same species parameters
4.4.3 Results
From Figure 4.3 and 4.5 it can be seen the results for both genes in a table format with a header and two columns. Where the table header contains the gene synonym, the first column refers to the genes with which the chosen gene interacts and the second column the comparison factor that
Case Studies
shows if the interaction is contained in one of the interactomes or both interactomes under study. The results information are explained in more detail above in section 3.3.3.
4.4.3.1 Results for CG10007 (Tango9)
From the figure 4.3 it can be seen that exists nine interactions and these are only contained in the "interactome1"(query interactome).
Figure 4.3: Results for CG1007
As expected, all the interactions presented in the table that comes from the Flybase interactome can be checked on the FlyBase website as shown in figure 4.4
Figure 4.4: Flybase gene CG10007 (Tango9) information
This result means that all the interactions with gene CG1007 (Tango9) in query interactome are not present in target interactome.
Case Studies
4.4.3.2 Results for Gapd (Gapdh1)
From the figure 4.5 it can be seen that there are eleven interactions that belong to "interactome1", one interaction that is present in both interactomes. Finally, the last 14 interactions are only in the interactome2.
Figure 4.5: Results for Gapd (Gapdh1)
As expected, all the interactions presented in the table, more precisely in the first twelve rows can be checked on the Flybase website as shown in figure 4.4, the remaining rows since they come from the "interactome2" which is an interactome from another database, it isn’t displayed on the website graph. Therefore, this comparison shows that an interaction that has been reported before is missing in the FlyBase dataset.
Case Studies
Figure 4.6: Flybase gene Gapd (Gapdh1) information
4.5
Different species analysis
The purpose of this experiment is to compare the interactomes from different species for a specific gene. This is not a trivial comparison since the protein names varies from species to species, what implies to identify the protein names to perform the comparative study.
4.5.1 Analysis data set
This experiment studies two species: Drosophila melanogaster (fruit fly) and Oryctolagus cu-niculus (rabbit). In Oryctolagus cuniculus there are about 20.000 genes and for the Drosophila melanogasterabout 15.000 genes. In addition two interactomes files were collected, one for the Drosophila melanogasterwith 19.356 interactions, and another one for the Oryctolagus cuniculus with 206 interactions. In this experiment it will be done a comparative analysis in two distinct tests, a well studied species (Drosophila melanogaster) is compared against a less studied species (Oryctolagus cuniculus) and vice-versa. In the first test the gene polo will be used, in the second test the gene TRIM32 will be used.
4.5.2 Methodology
The input data (GBFF and interactome files) was uploaded through the upload view within the platform and all essential files were generated (dictionary, fasta file with the protein sequence and the interactome file). Since we are comparing two different species it is important to establish gene homologies using BLAST.
Case Studies
For gene polo we have used the following parameters, expect value 0.05, length of alignment 100, number of descriptions 4 and minimum identity 40% as shown in figure 4.7.
Figure 4.7: Experiment one (polo) compare different species parameters
For gene TRIM32 we have used the following parameters, expectue value 0.05, length of align-ment 100, number of descriptions 4 and minimum identity 20% as shown in figure 4.8. The value of percentage of identity is lower then the previous because the TRIM32 gene is less conserved than polo.
Case Studies
4.5.3 Results
In figure 4.9 and 4.10 we can see the results for both methods in a table format with a header and five columns. The table sub-headers contains the species information, the first and third columns represents the query species gene interactions, the second column and fourth columns represents the target species possible interactions according to BLAST, finally the fifth column the compari-son factor. The results information are explained in more detail above in section 3.3.3.
All the results of the performed analysis can be saved in tab format file that can be open by spreadsheet programs.
4.5.3.1 Results for gene polo
From the figure 4.9 when the parameters are used it is clear that there are two genes/proteins in the rabbit that are identified as homologous of the polo Drosophila gene, this is not unexpected since in lineage leading to mammals two whole genome duplication have been reported and thus we could expect as much as four homologous genes in the rabbit. Although for this particular case this BLAST parameters seems to be adequate, other genes/proteins may require different parameters therefore users are encourage to try different parameters for every gene to see how their conclusions would change. With a simple to use software application as the one here presented this is certainly feasible.
Figure 4.9: Results related to Drosophila and Oryctolagus comparison
4.5.3.2 Results for geneTRIM32 including second level
From the figure 4.10 when comparing the rabbit and Drosophila for the gene TRIM32 a single gene is identified as homologous in Drosophila. This is not unexpected because for the large majority
Case Studies
of gene there is a correspondence of a maximum of four to one gene, due to two whole genome duplications that happens in lineage leading to mammals. Therefore, when the user chooses a given gene in the rabbit a single gene is expected to be identified as homologous in the fly.
Figure 4.10: Results related to Oryctolagus and Drosophila comparison
By pressing the level button the analysis is expanded to level two effortlessly. As can be seen in figure 4.11 the number of reported interactions is now greater than for level one. It is up to the user to decide when the amount of information is to much to be understandable. This is a powerful option that should be used wisely.
Figure 4.11: Level two results related to Oryctolagus and Drosophila comparison
4.6
Species interactome prediction analysis
When a large set of gene are to be analyzed for a given species comparison it may be more practical to transfer the interactome information from one species to the other.
Next a experiment will be presented, where for sake of simplicity, the query interactome is fictitious with few amount of interactions. In figure 4.12, it will be presented the input data, no gene is specified. As it was mentioned on chapter 3, only the query interactome and the target speciesare used along with same BLAST parameters for every gene. This way the output will be the homologous genes, which have diferent names, of all genes in interactome, present in query speciesdictionary.
Case Studies
Figure 4.12: Predict interactome parameters
4.6.1 Interactome prediction results
The results shown in figure 4.13, predicts Oryctolagus cuniculus interactome giving the Drosophila melanogaster information, and as expected, all the ortologue gene names differs from the query speciesgene names. Since , the aim is basically to present the filtered results returned by BLAST, the last column is ignored.
Figure 4.13: Predict interactome results
Case Studies
4.7
Script case
In order to test the script explained in section 3.3.4, another script was implemented. This imple-mented script is a bash script that in order to run, it must be provided a text file as input, which is composed by a list of genes. For every gene in the list, a gene is replaced in the "config" file and for each gene replaced the original script is executed. The results will be saved in a file for each processed gene. Below in the figure 4.14 shows a visual representation of the bash script operations.
Case Studies


![Figure 2.4: Comparing the traditional web application with AJAX model [Jes05]](https://thumb-eu.123doks.com/thumbv2/123dok_br/19253203.976709/29.892.247.692.313.757/figure-comparing-traditional-web-application-ajax-model-jes.webp)