High-energy interactions
at the Pierre Auger Observatory
Ruben Conceição
∗a†for the Pierre Auger Collaboration
ba
LIP / IST, Lisboa, Portugal
b
Observatorio Pierre Auger, Av. San Martín Norte 304, 5613 Malargüe, Argentina
E-mail:
[email protected]
Full author list:
http://www.auger.org/archive/authors_2015_06.html
The interaction of Ultra High Energy Cosmic Rays (UHECRs) with the atoms of the atmosphere
can occur at center-of-mass energies that surpass 100 TeV, while present human-made
accelera-tors go up to 13 TeV. Therefore it provides a unique opportunity to explore hadronic interactions
at the highest energies. However, the extraction of hadronic interaction properties from the
Exten-sive Air Showers (EAS) characteristics, which are induced by the UHECR, is intrinsically related
to the nature of the primary cosmic ray. As such, to break the degeneracy between hadronic
inter-actions and primary mass composition, a consistent description of the shower observables must
be achieved.
Such detailed studies have been conducted in the last years at the Pierre Auger Observatory, the
largest UHECRs detector in the world. It combines two complementary techniques to measure
the EAS characteristics.
In this talk, we will present the latest measurements on shower observables, both on the
elec-tromagnetic and muonic shower components, and its interpretation in terms of the primary mass
composition. Its impact regarding particle physics will be discussed, in particular the
measure-ment of the proton-air cross section.
Finally, through the joint analysis of the different measurements, it will be shown that none of the
post-LHC high-energy hadronic interaction models can satisfactorily describe the data.
The European Physical Society Conference on High Energy Physics
22–29 July 2015
Vienna, Austria
∗Speaker.
†
R. Conceição gratefully acknowledges the financial support by FCT (SFRH/BPD/73270/2010)
c
Copyright owned by the author(s) under the terms of the Creative Commons
Attribution-NonCommercial-NoDerivatives 4.0 International License (CC BY-NC-ND 4.0). http://pos.sissa.it/
High-energy interactions at the Pierre Auger Observatory
Ruben Conceição
1. Introduction
Ultra High Energy Cosmic Rays are the most energetic known particles and yet their origin
and nature remain a mystery. These particles arrive at Earth with a very scarce flux making its direct
detection practically impossible. Fortunately, the interaction of UHECRs with the Earth atoms at
the top of the atmosphere produces huge particle showers that can be detected. These are known
as Extensive Air Showers (EAS), and can be either sampled at ground or, in moonless nights, can
be detected via the collection of the fluorescence photons that are produced by the atmosphere
nitrogen molecules due to the development of the shower.
The Pierre Auger Observatory [
1
] is the world largest experiment to study UHECRs. It has
a surface detector (SD) composed by more than 1600 Water Cherenkov Detectors (WCD), over
an area of 3000km
2, to sample the charged secondary shower particles that reach the ground. It
comprises also 4 Fluorescence Detector (FD) buildings, each with 6 telescopes, that survey the
whole array.
The hybrid nature of the Pierre Auger Observatory (SD+FD) is one of its strongest features. An
absolute energy scale can be derived for the SD, whose energy reconstruction is model dependent,
using high quality shower events recorded independently by each technique. Also the geometrical
shower reconstruction benefits from the joint analysis. Moreover, hybrid event analyses provide
the observatory with an additional handle on the understanding of EAS physics.
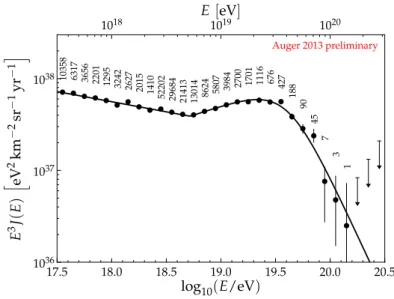
2. UHECR energy spectrum
The cosmic ray energy spectrum encloses information about the UHECRs sources and its
dis-tribution, production mechanisms and propagation. The results of the measurement of the UHECRs
arrival flux from a combined analysis of SD (vertical and inclined events) and hybrid events (SD
+ FD) [
2
] are presented in figure
1
. This energy spectrum has been measured using about 8 years
of data
1, with an exposure that surpasses 30000 km
2sryr. The high energy region is dominated by
SD events as the exposure is higher, while the lowest energy region benefits from the hybrid events.
The exposure calculation for the latter is performed using the periods of the telescopes operation
and applying Monte Carlo simulations to obtain the aperture. All the measurements are combined
into a single energy spectrum through a maximum likelihood fit procedure.
The final result is an energy spectrum with very small statistical uncertainty in most energy
regions. Data has been fitted to a power law bellow the ankle and a power law with a smoothed
suppression above to emphasise the main features of the energy spectrum. Two features are clearly
identified: a change in the spectral index, around log(E/eV) = 18.72, referred to as the ankle;
and a suppression of the flux above log(E/eV)= 19.63. Although this suppression is consistent
with the GKZ effect [
4
,
5
], it could also be explained by the sources exhaustion to accelerate
UHECRs. These two scenarios would have very different mass composition evolutions. In fact, a
large fraction of protons at the highest energy would be an indication of the presence of the GZK
effect. On the other hand, a continuous evolution of the UHECRs towards a heavier composition
would signal the existence of a source exhaustion mechanism. Thus, UHECRs mass composition
is a key element to understand the sources mechanisms and UHECRs propagation.
1
an update of this measurement can be found at the ICRC2015 [
3
].
High-energy interactions at the Pierre Auger Observatory
Ruben Conceição
33
RDI
NTERNATIONALC
OSMICR
AYC
ONFERENCE, R
IO DEJ
ANEIRO2013
17.5 18.0 18.5 19.0 19.5 20.0 20.5
log
10(
E/eV
)
1036 1037 1038E
3J
(
E
)
h
eV
2km
2sr
1yr
1i
10358 6317 3656 2201 1295 3242 2627 2015 1410 52202 29684 21413 13014 8624 5807 3984 2700 1701 1116 676 427 188 90 45 7 3 1 1018E
10[
eV
19]
1020 Auger 2013 preliminaryFigure 5:
The combined energy spectrum of UHECRs as
mea-sured at the Pierre Auger Observatory. The numbers give the total
number of events inside each bin. The last three arrows represent
upper limits at 84% C.L.
Parameter
Result (±s
stat± s
sys)
log
10(E
a/eV)
18.72 ± 0.01 ± 0.02
g
13.23 ± 0.01 ± 0.07
g
22.63 ± 0.02 ± 0.04
log
10(E
1/2/
eV) 19.63 ± 0.01 ± 0.01
log
10W
c0.15 ± 0.01 ± 0.02
Table 2:
Parameters, with statistical and systematic uncertainties,
of the model describing the combined energy spectrum measured
at the Pierre Auger Observatory.
brid spectrum down by 6%. Compared to the previous
pub-lication, the precision in determining the spectral index
be-low the ankle has increased significantly, mainly due to the
addition of the 750 m array. We report a slightly flatter
spec-trum below the ankle (now: 3.23 ± 0.01 (stat) ± 0.07 (sys),
previous publication: 3.27 ± 0.02) and an increase of E
a(now: 18.72 ± 0.01 (stat) ± 0.02 (sys), previous
publica-tion: 18.61 ± 0.01) [22]. The large systematic uncertainties
in
g
1are dominated by the uncertainty of the resolution
model used for correcting the measured flux. At the same
time, the uncertainty in the energy scale of 14% is
propa-gated into the final result.
The combined energy spectrum is compared to fluxes
from three astrophysical scenarios in Fig. 6. Shown are
models assuming pure proton or iron composition. The
fluxes result from different assumptions of the spectral index
b of the source injection spectrum and the source evolution
parameter m. The model lines have been calculated using
CRPropa [30] and validated with SimProp [31].
5 Summary
The flux of cosmic rays above 3⇥10
17eV has been
mea-sured at the Pierre Auger Observatory combining data from
surface and fluorescence detectors. The spectral features are
determined with unprecedented statistical precision. The
fitted parameters are compatible with previous results given
the change in the energy scale. There is an overall
uncer-tainty of the revised energy scale of 14% [23]. Current
re-17.5 18.0 18.5 19.0 19.5 20.0 20.5
log
10(
E/eV
)
1036 1037 1038E
3J
(
E
)
h
eV
2km
2sr
1yr
1i
DE/E = 14 % Proton, b = 2.6, m = 0 Proton, b = 2.35, m = 5 Iron, b = 2.3, m = 0 Combined 1018E
10[
eV
19]
1020 Auger 2013 preliminaryFigure 6:
The combined energy spectrum compared to energy
spectra from different astrophysical scenarios (see text).
References
[1] The Pierre Auger Collaboration, Phys.Lett.
B685 (2010) 239,
arXiv:1002.1975.
[2] R. U. Abbasi et al., High Resolution Flys Eye Collaboration,
Phys. Rev. Lett.
100 (2008) 101101.
[3] T. Abu-Zayyad et al., Astrophys. J.
768 (2013) L1,
arXiv:1205.5067.
[4] V. Berezinsky, A. Z. Gazizov, and S. I. Grigorieva, Phys. Lett.
B612 (2005) 147.
[5] A. M. Hillas, J. Phys.
G31 (2005) R95.
[6] T. Wibig and A. W. Wolfendale, J. Phys.,
G31 (2005) 255.
[7] D. Allard et al., JCAP
0810 (2008) 033.
[8] The Pierre Auger Collaboration, Nucl. Instr. and Meth.
A613
(2010) 29.
[9] D. Ravignani, for the Pierre Auger Collaboration, paper 0693,
these proceedings.
[10] The Pierre Auger Collaboration, Nucl. Instr. Meth.
A523
(2004) 50.
[11] I. Allekotte et al., Nucl. Instr. Meth.
A586 (2008) 409.
[12] The Pierre Auger Collaboration, Nucl. Instr. Meth.
A620
(2010) 227.
[13] The Pierre Auger Collaboration, Astropart. Phys.
34 (2011)
368.
[14] X. Bertou et al., Nucl. Instr. Meth.
A568 (2006) 839.
[15] A.M. Hillas, Acta Physica Academiae Scientiarum
Hungaricae
26 (1970) 355.
[16] D. Newton, J. Knapp, A.A. Watson, Astropart. Phys.
26,
414 (2007).
[17] J. Hersil et al., Phys. Rev. Lett.
6, 22 (1961).
[18] R. Pesce, for the Pierre Auger Collaboration, Proc. 32nd
ICRC (2011), arXiv:1107.4809v1.
[19] The Pierre Auger Collaboration, Phys. Rev. Lett.
101 (2008)
061101.
[20] I. Vali˜no, for the Pierre Auger Collaboration, 31st
International Cosmic Ray Conference (ICRC 09), Ł´od´z,
Poland (7-15 July 2009),
[21] G. Rodriguez, for the Pierre Auger Collaboration, UHECR
Symposium CERN (2012) (to be published).
[22] F. Salamida, for the Pierre Auger Collaboration, Proc. 32nd
ICRC (2011), arXiv:1107.4809v1.
[23] V. Verzi, for the Pierre Auger Collaboration, paper 0928,
these proceedings.
[24] I. Maris, for the Pierre Auger Collaboration, UHECR
Symposium CERN (2012) (to be published).
[25] B. Kegl, for the Pierre Auger Collaboration, paper 0860,
these proceedings.
[26] S. Ostapchenko, Nucl. Phys. B Proc. Suppl.
151 (2006) 143.
[27] M. Tueros, for the Pierre Auger Collaboration, paper 0705,
these proceedings.
[28] V. de Souza, for the Pierre Auger Collaboration, paper 0751,
Figure 1: The combined energy spectrum of UHECRs as measured at the Pierre Auger Observatory. The
numbers give the total number of events inside each bin. The last three arrows represent upper limits at 84%
C.L. [
2
]
3. Primary mass composition
The nature of UHECRs can be inferred from the shower observables. One of the most
com-position sensitive observables measured in Auger is the depth at which the shower reaches its
maximum, X
max. This quantity is measured by the Fluorescence Detector following quality cuts
described in [
6
]. These cuts include reconstruction performance, cuts on the atmosphere
condi-tions, namely the amount of aerosols, and cuts on the field of view so that the distribution does not
get biased.
The primary mass composition was obtained by fitting the energy binned X
maxdistributions
considering a specific hadronic interaction model. Four elements were considered for the primary
mass composition: proton, helium, nitrogen and iron. The results are displayed in figure
2
.
Al-though the fit results clearly depend on the choice of the hadronic interaction model general trends
can be observed. At lower energies (E ∼ 10
18eV) all models prefer a light composition with a
sig-nificant fraction of protons. As the energy increases, the mass composition slowly evolves towards
a heavier composition. At the highest possible FD energies, all the models prefer a composition
dominated by intermediate mass states (helium and nitrogen) with almost no presence of proton
nor iron. It is important to notice that, as this is FD data, there are no events for the energy region
where the suppression of the energy spectrum occurs.
4. Particle physics measurements
The interpretation in terms of primary mass composition depends of the knowledge on the
shower description. This means that the understanding of high-energy hadronic interactions is
crucial. However, this is also an opportunity to do particle physics at energies that surpass those
High-energy interactions at the Pierre Auger Observatory
Ruben Conceição
2.2. OPEN QUESTIONS AND GOALS OF UPGRADING THE OBSERVATORY
13
0 0.2 0.4 0.6 0.8 1 p fraction 0 0.2 0.4 0.6 0.8 1 He fraction 0 0.2 0.4 0.6 0.8 1 N fraction 0 0.2 0.4 0.6 0.8 1 Fe fraction Sibyll 2.1 QGSJET II-4 EPOS-LHC 1018 1019 1020
E [eV]
Pierre Auger Collaboration
Figure 2.9: Estimate of the composition of ultra-high energy cosmic rays at the top of the
atmo-sphere [23]. The X
maxdistributions measured with the Auger Observatory have been fitted by a
superposition of four mass groups accounting for detector resolution and acceptance effects. The
error bars show the combined statistical and systematic uncertainties of the mass estimates, except
those related to the choice of the hadronic interaction models.
LHC [
72
,
73
], QGSJet II.04 [
74
] and Sibyll 2.1 [
75
] have been used for data interpretation to
430get some understanding of the systematic uncertainties related to the modeling of hadronic
interactions.
One striking result is the presence of a large fraction of protons in the energy range of
the ankle. At the same time, according to the Auger data, the anisotropy of the arrival
directions of these protons cannot be larger than a few percent. This is in contradiction to the
435expectations for light particles produced in Galactic sources, given the current knowledge
of propagation in the Galactic magnetic field [
109
,
110
]. Thus the protons at energies as
low as 10
18eV are most likely of extragalactic origin, or one has to accept rather extreme
assumptions about the Galactic magnetic field.
Another surprising observation is the disappearance of the proton component just below
44010
19eV and, at the same time, the appearance of a helium component. There are indications
that a similar transition from helium to the nitrogen mass group could take place at higher
energy, but the statistics of the data of the fluorescence telescopes are not high enough to be
conclusive. We will not attempt here to speculate on the origin of these transitions and only
point out that we do not have enough composition-sensitive data to derive the composition
445at energies higher than 10
19eV, even if we understood hadronic interactions much better
than now.
Finally we want to mention that there are indications for a possible re-appearance of a
proton component at high energy that could be related to the possible anisotropy on small
angular scales observed above 5.5
⇥
10
19eV. With respect to the model scenarios we will
450
discuss below, confirming the existence of a proton population at the highest energies would
indicate another class of sources, possibly distributed over cosmological distances. These
protons are expected to be correlated in arrival direction with their sources and could open
Energy flux suppression region Ankle
Figure 2: Fitted fraction for the scenario of a complex mixture of protons, helium nuclei, nitrogen nuclei,
and iron nuclei. The red dashed line indicates the position of the ankle with the shaded area the energy
region where the flux rapidly decreases. [
7
]
reached currently by the Large Hadron Collider (LHC). In this section we present some of the
particle physics related measurements done at Auger.
4.1 Proton-air cross-section
The depth of the shower maximum, X
max, depends on the shower development. In particular,
the exponential tail of the X
maxdistribution is very sensitive to the primary cross-section. Moreover,
among all the possible hadronic primaries, proton has the smallest cross-section and consequently,
proton induced showers have the deepest X
max. By selecting the deepest showers, if there is a
suf-ficient amount of proton elements in data, it is possible to estimate the proton-air cross-section.
Auger has performed this measurement using FD events with energy in the range log(E/eV ) ∈
[18;18.5] (with an average value of √s = 57TeV) and reported
2a proton-air cross-section of
σ
p−air= [
505 ± 22(stat)
+28−36(syst)]mb (see figure
3
(left)) [
9
]. The main sources of systematic
uncertainties for this measurement are the fraction of photons and helium. The first can be
esti-mated from data while the latter was assumed to be less than 25%.
It is possible to interpret this measurement in terms of proton-proton inelastic cross-section
using a Glauber formalism. This exercise is presented in figure
3
(right). It is interesting to note
that the Auger data point is within 1σ of the accelerator measurements extrapolation.
4.2 EAS muon content in inclined events
Being produced in the decay of charged mesons and having a large probability of reaching the
ground, muons are an important tool to assess the hadronic component of the shower. Although the
SD is sensitive to both the electromagnetic and muonic shower components, in inclined showers
most of the electromagnetic component of the shower gets absorbed in the atmosphere. Hence,
2
an update of this measurement can be found at the ICRC2015 [
8
].
6 these we found that only the elasticity can have a
rele-vant impact on Λη. The previously identified systematic
uncertainty of (−8, +19) mb induced by the modelling of hadronic interactions, corresponds to the impact of mod-ifying the elasticity within±(10 − 25) % in the models.
The selection of events with large values of Xmaxalso
enhances the fraction of primary cosmic-ray interactions with smaller multiplicities and larger elasticities, which is for example characteristic for diffractive interactions. The value of Ληis thus more sensitive to the cross-section
of those interactions. The identified model-dependence for the determination of σprodp -airis also caused by the
com-pensation of this effect.
Also the choice of a logarithmic energy dependence for the rescaling-factor in Eq. (2) may affect the result-ing cross-sections. However, since the required rescalresult-ing- rescaling-factors are small, this can only be a marginal effect.
The systematic uncertainty of 22 % [15] in the absolute value of the energy scale leads to systematic uncertainties of 7 mb in the cross-section and 6 TeV in the center-of-mass energy. Furthermore, the procedure to obtain σp -airprod
from the measured Ληdepends on additional parameters.
By varying the energy distribution, energy and Xmax
res-olution in the simulations, we find that related system-atic changes of the value of σprodp -airare distributed with a
mean-square of 7 mb around zero. We use the root-mean-square as estimate of the systematic uncertainties related to the conversion of Ληto σp -airprod.
The presence of photons in the primary beam would bias the measurement. The average Xmax of showers
produced by photons at the energies of interest is about 50 g/cm2deeper in the atmosphere than that of protons.
However, observational limits on the fraction of photons are < 0.5 % [16, 17]. With simulations we find that the possible under-estimation of the cross-section if photons were present in the data sample at this level is less than 10 mb.
With the present limitations of observations, we can-not distinguish air showers produced by helium nuclei from those created by protons. From simulations we find
TABLE I: Summary of the systematic uncertainties. Description Impact on σprod
p -air
Ληsystematics ±15 mb
Hadronic interaction models +19 −8 mb Energy scale ±7 mb Conversion of Ληto σprod p -air ±7 mb Photons, <0.5 % < +10 mb Helium, 10 % −12 mb Helium, 25 % −30 mb Helium, 50 % −80 mb Total (25 % helium) −36 mb, +28 mb (Energy/eV) 10 log 11 12 13 14 15 16 17 18 19 20
Cross section (proton-air) [mb]
200 300 400 500 600 700 QGSJet01c QGSJetII.3 Sibyll 2.1 Epos 1.99 Energy [eV] 11 10 1012 1013 1014 1015 1016 1017 1018 1019 1020 [TeV] pp s Equivalent c.m. energy -1 10 1 10 102 Nam et al. 1975 [30] Siohan et al. 1978 [31] Baltrusaitis et al. 1984 [2] Mielke et al. 1994 [32] Knurenko et al. 1999 [19] Honda et al. 1999 [20] Belov et al. 2007 [18] Aglietta et al. 2009 [33] Aielli et al. 2009 [34] This work
0.9TeV 2.36TeV 7TeV 14TeV LHC
FIG. 2: Resulting σprodp -air compared to other measure-ments (see [18–20, 30–34] for references) and model predic-tions. The inner error bars are statistical, while the outer include systematic uncertainties for a helium fraction of 25 % and 10 mb for the systematic uncertainty attributed to the fraction of photons.
that σprodp -airis over-estimated depending on the
percent-ages of helium in the data sample. Lack of knowledge of the helium fraction is the dominant source of systematic uncertainty.
We also find that the nuclei of the CNO-group intro-duce no bias for fractions up to∼ 50 %, and accordingly we assign no uncertainty in the cross-section due to these or heavier nuclei.
In TableIwe list the sources of systematic uncertain-ties. As the helium fraction is not known we show the impact of 10, 25 and 50 % of helium respectively. In what follows we include a systematic uncertainty related to a helium fraction of 25 %. In the extreme case, were the cosmic-ray composition to be 100 % helium, the analysis would over-estimate the proton-air cross-section by 300 to 500 mb. Given the constraints from accelerator data at lower energies and typical model assumptions, this ex-treme scenario is not realistic.
We summarise our results by averaging the four values of the cross-section obtained with the hadronic interac-tion models to give
σprodp -air= ! 505 ± 22(stat)+28 −36(sys) " mb at a center-of-mass energy of [ 57 ± 0.3(stat) ± 6(sys) ] TeV. In Fig.2we compare this result with model predictions and other measurements. The measurements at the highest energies are: HiRes [18] and Fly’s eye [2] that are both based on Xmax, Yakutsk Array [19] using
Cherenkov observations and Akeno [20] measuring elec-tron and muon numbers at ground level. All these analy-ses assume a pure proton composition. In the context of a possible mixed-mass cosmic-ray composition, this can lead to large systematic effects. Also all these analyses are based on a single interaction model for describing air
8 (Proton-Proton) [mb] inel σ 30 40 50 60 70 80 90 100 110 [GeV] s 3 10 104 5 10 ATLAS 2011 CMS 2011 ALICE 2011 TOTEM 2011 UA5 CDF/E710 This work (Glauber)
QGSJet01 QGSJetII.3 Sibyll2.1 Epos1.99 Pythia 6.115 Phojet
FIG. 4: Comparison of derived σinel
pp to model predictions and
accelerator data [29]. Here we also show the cross-sections of two typical high-energy models, Pythia6 [35] and Phojet[36]. The inner error bars are statistical, while the outer include systematic uncertainties.
from accelerator measurements to the energy of the anal-ysis. This is achieved by modifying the model-predictions of hadronic cross-sections above energies of 1015eV
dur-ing the air-shower simulation process in a self-consistent approach.
We convert the proton-air production cross-section into the total, and the inelastic, proton-proton cross-section using a Glauber calculation that includes inter-mediate inelastic screening corrections. In this calcula-tion we use the correlacalcula-tion between the elastic slope pa-rameter and the proton-proton cross-sections taken from the interaction models as a constraint. We find that the inelastic proton-proton cross-section depends less on the elastic slope parameter than does the total proton-proton cross-section, and thus the systematic uncertainty of the Glauber calculation for the inelastic result is smaller. The data agree with an extrapolation from LHC [29] en-ergies to 57 TeV for a limited set of models.
Acknowledgments. The successful installation, commis-sioning, and operation of the Pierre Auger Observatory would not have been possible without the strong com-mitment and effort from the technical and administrative staff in Malarg¨ue.
We are very grateful to the following agencies and organizations for financial support: Comisi´on Na-cional de Energ´ıa At´omica, Fundaci´on Antorchas, Go-bierno De La Provincia de Mendoza, Municipalidad de Malarg¨ue, NDM Holdings and Valle Las Le˜nas, in gratitude for their continuing cooperation over land access, Argentina; the Australian Research Coun-cil; Conselho Nacional de Desenvolvimento Cient´ıfico e Tecnol´ogico (CNPq), Financiadora de Estudos e Projetos (FINEP), Funda¸c˜ao de Amparo `a Pesquisa do Estado de Rio de Janeiro (FAPERJ), Funda¸c˜ao de Amparo `a Pesquisa do Estado de S˜ao Paulo
(FAPESP), Minist´erio de Ciˆencia e Tecnologia (MCT), Brazil; AVCR AV0Z10100502 and AV0Z10100522, GAAV KJB100100904, MSMT-CR LA08016, LC527, 1M06002, MEB111003, and MSM0021620859, Czech Re-public; Centre de Calcul IN2P3/CNRS, Centre Na-tional de la Recherche Scientifique (CNRS), Conseil R´egional Ile-de-France, D´epartement Physique Nucl´eaire et Corpusculaire (PNC-IN2P3/CNRS), D´epartement Sciences de l’Univers (SDU-INSU/CNRS), France; Bun-desministerium f¨ur Bildung und Forschung (BMBF), Deutsche Forschungsgemeinschaft (DFG), Finanzmin-isterium Baden-W¨urttemberg, Helmholtz-Gemeinschaft Deutscher Forschungszentren (HGF), Ministerium f¨ur Wissenschaft und Forschung, Nordrhein-Westfalen, Min-isterium f¨ur Wissenschaft, Forschung und Kunst, Baden-W¨urttemberg, Germany; Istituto Nazionale di Fisica Nu-cleare (INFN), Ministero dell’Istruzione, dell’Universit`a e della Ricerca (MIUR), Italy; Consejo Nacional de Cien-cia y Tecnolog´ıa (CONACYT), Mexico; Ministerie van Onderwijs, Cultuur en Wetenschap, Nederlandse Organ-isatie voor Wetenschappelijk Onderzoek (NWO), Sticht-ing voor Fundamenteel Onderzoek der Materie (FOM), Netherlands; Ministry of Science and Higher Educa-tion, Grant Nos. N N202 200239 and N N202 207238, Poland; Funda¸c˜ao para a Ciˆencia e a Tecnologia, Portu-gal; Ministry for Higher Education, Science, and Tech-nology, Slovenian Research Agency, Slovenia; Comu-nidad de Madrid, Consejer´ıa de Educaci´on de la Comu-nidad de Castilla La Mancha, FEDER funds, Ministe-rio de Ciencia e Innovaci´on and Consolider-Ingenio 2010 (CPAN), Xunta de Galicia, Spain; Science and Tech-nology Facilities Council, United Kingdom; Department of Energy, Contract Nos. AC02-07CH11359, DE-FR02-04ER41300, National Science Foundation, Grant No. 0450696, The Grainger Foundation USA; ALFA-EC / HELEN, European Union 6th Framework Program, Grant No. MEIF-CT-2005-025057, European Union 7th Framework Program, Grant No. PIEF-GA-2008-220240, and UNESCO.
[1]J. Abraham et al., Nucl. Instrum. Meth. A 523, 50 (2004).
[2]R. Ellsworth et al., Phys. Rev. D 26, 336 (1982). R. Bal-trusaitis et al., Phys. Rev. Lett. 52, 1380 (1984).
[3]P. Sommers, Astropart. Phys. 3, 349 (1995). B. Dawson et al., Astropart. Phys. 5, 239 (1996).
[4]P. Facal for the Pierre Auger Collaboration and D. Garcia-Pinto for the Pierre Auger Collaboration, 32nd
Int. Cosmic Ray Conf., Bejing,arXiv:1107.4804v1 [astro-ph.HE] (2011).
[5]R. Engel et al., Phys. Rev. D 58, 014019 (1998).
[6]J. Abraham et al., Phys. Rev. Lett. 104, 091101 (2010).
[7]R. Ulrich et al., New J. Phys. 11, 065018 (2009).
[8]N. Kalmykov and S. Ostapchenko, Phys. Atom. Nucl. 56, 346 (1993).
Figure 3: Left: Comparison between the Auger proton-air cross-section measurement and the result of
previous experiments along with theoretical models predictions. The inner error bars are statistical, while the
outer include systematic uncertainties for a helium fraction of 25% and 10 mb for the systematic uncertainty
attributed to the fraction of photons. Right: Comparison of derived proton-proton
σinel
to model predictions
and accelerator data.[
9
]
the measurement of the signal at the ground allows to assess the EAS muon content. The results
of this analysis as a function of energy are shown in figure
4
(left) [
10
]. Within the systematic
uncertainties, data is compatible with a heavier composition in the full energy range. Moreover, the
trend seems to indicate a transition in terms of mass composition, again towards heavier elements.
hln Rμi numerically based on our fitted model of the
intrinsic fluctuations: hln Rμið1019eVÞ ¼ Z ∞ 0 ln RμN ðRμÞdRμ ¼ 0.601 $ 0.016þ0.167 −0.201ðsysÞ; ð8Þ
where N ðRμÞ is a Gaussian with mean hRμi and spread
σ½Rμ' as obtained from the fit. The deviation of hln Rμi from
lnhRμi is only 2% so that the conversion does not lead to a
noticeable increase in the systematic uncertainty. Several consistency checks were performed on the data set. We found no indications for a seasonal variation, or for a dependence on the zenith angle or the distance of the shower axis to the fluorescence telescopes.
V. MODEL COMPARISON AND DISCUSSION A simple comparison of our data with air showers simulated at the mean zenith angle θ ¼ 67° with the hadronic interaction models QGSJETII-04 and EPOS
LHC is shown in Fig. 4. The ratio hRμi=ðE=1019eVÞ
cancels most of the energy scaling, and emphasizes the effect of the cosmic-ray mass A on the muon number. We compute the ratio from Eq.(4)(line), and alternatively by a binwise averaging of the original data (data points). The
two ways of computing the ratio are visually in good agreement, despite minor bin-to-bin migration effects that bias the binwise method. The fitting approach we used for the data analysis avoids the migration bias by design.
Proton and iron showers are well separated, which illustrates the power of hRμi as a composition estimator.
A caveat is the large systematic uncertainty on the absolute scale of the measurement, which is mainly inherited from the energy scale [38]. This limits its power as a mass composition estimator, but we will see that our measure-ment contributes valuable insights into the consistency of hadronic interaction models around and above energies of 1019eV, where other sensitive data are sparse.
A hint of a discrepancy between the models and the data is the high abundance of muons in the data. The measured muon number is higher than in pure iron showers, sug-gesting contributions of even heavier elements. This interpretation is not in agreement with studies based on the depth of shower maximum[40], which show an average logarithmic mass hln Ai between proton and iron in this energy range. We note that our data points can be moved between the proton and iron predictions by shifting them within the systematic uncertainties, but we will demonstrate that this does not completely resolve the discrepancy. The logarithmic gain dhln Rμi=d ln E of the data is also large
compared to proton or iron showers. This suggests a transition from lighter to heavier elements that is also seen in the evolution of the average depth of shower maximum. We will now quantify the disagreement between model predictions and our data with the help of the mass composition inferred from the average depth hXmaxi of
the shower maximum. A valid hadronic interaction model has to describe all air shower observables consistently. We have recently published the mean logarithmic mass hln Ai derived from the measured average depth of the shower maximum hXmaxi[40]. We can therefore make predictions
for the mean logarithmic muon content hln Rμi based on
these hln Ai data, and compare them directly to our measurement.
We consider QGSJET01, QGSJETII-03, QGSJETII-04,
and EPOSLHC for this comparison. The relation of hXmaxi
and hln Ai at a given energy E for these models is in good agreement with the prediction from the generalized Heitler model of hadronic air showers,
hXmaxi ¼ hXmaxipþ fEhln Ai; ð9Þ
where hXmaxip is the average depth of the shower
maxi-mum for proton showers at the given energy and fE an
energy-dependent parameter [4,41]. The parameters hXmaxip and fEwere computed from air shower
simula-tions for each model.
We derive a similar expression from Eq. (1) by substituting Nμ;p¼ ðE=ξcÞβ and computing the average
logarithm of the muon number
FIG. 4 (color online). Average muon content hRμi per shower
energy E as a function of the shower energy E in double logarithmic scale. Our data is shown bin by bin (circles) together with the fit discussed in the previous section (line). Square brackets indicate the systematic uncertainty of the measurement; the diagonal offsets represent the correlated effect of systematic shifts in the energy scale. The grey band indicates the statistical uncertainty of the fitted line. Shown for comparison are theo-retical curves for proton and iron showers simulated at θ ¼ 67° (dotted and dashed lines). Black triangles at the bottom show the energy bin edges. The binning was adjusted by an algorithm to obtain equal numbers of events per bin.
A. AAB et al. PHYSICAL REVIEW D 91, 032003 (2015)
032003-8
hln Nμi ¼ hln Nμipþ ð1 − βÞhln Ai ð10Þ
β ¼ 1 −hln NμiFeln 56− hln Nμip: ð11Þ Since Nμ∝ Rμ, we can replace ln Nμby ln Rμ. The same
can be done in Eq.(2), which also holds for averages due to the linearity of differentiation.
We estimate the systematic uncertainty of the approxi-mate Heitler model by computing β from Eq.(11), and alternatively from dhln Rμip=d ln E and dhln RμiFe=d ln E.
The three values would be identical if the Heitler model was accurate. Based on the small deviations, we estimate σsys½β& ¼ 0.02. By propagating the systematic uncertainty
of β, we arrive at a small systematic uncertainty for the predicted logarithmic muon content of σsys½hln Rμi& < 0.02.
With Eqs.(9)–(10), we convert the measured mean depth hXmaxi into a prediction of the mean logarithmic muon
content hln Rμi at θ ¼ 67° for each hadronic interaction
model. The relationship between hXmaxi and hln Rμi can be
represented by a line, which is illustrated in Fig.5. The Auger measurements at 1019eV are also shown. The
discrepancy between data and model predictions is shown by a lack of overlap of the data point with any of the model lines.
The model predictions of hln Rμi and dhln Rμi=d ln E
are summarized and compared to our measurement in Figs. 6–7, respectively. For QGSJETII-03, QGSJETII-04,
and EPOS LHC, we use estimated hln Ai data from
Ref.[40]. Since QGSJET01 has not been included in that
reference, we compute hln Ai using Eq. (9) [4] from the
latest hXmaxi data [40]. The systematic uncertainty of
the hln Rμi predictions is derived by propagating the
sys-tematic uncertainty of hlnAi ['0.03ðsysÞ], combined with the systematic uncertainty of the Heitler model ['0.02ðsysÞ]. The predicted logarithmic gain dhln Rμi=d ln E is calculated
through Eq. (2), while d ln A=d ln E is obtained from a straight line fit to hln Ai data points between 4 × 10¹⁸
and 5 × 10¹⁹eV. The systematic uncertainty of the
dhln Rμi=d ln E predictions is derived by varying the fitted
line within the systematic uncertainty of the hln Ai data ['0.02ðsysÞ], and by varying β within its systematic uncertainty in Eq.(2)['0.005ðsysÞ].
The four hadronic interaction models fall short in matching our measurement of the mean logarithmic muon content hln Rμi. QGSJETII-04 and EPOSLHC have been
updated after the first LHC data. The discrepancy is smaller for these models, and EPOSLHC performs slightly better
than QGSJETII-04. Yet none of the models is covered by
the total uncertainty interval. The minimum deviation is 1.4σ. To reproduce the higher signal intensity in data, the mean muon number around 1019eV in simulations would
have to be increased by 30 to 80%½þ17
−20ðsysÞ%&. If on the
other hand the predictions of the latest models were close to the truth, the Auger energy scale would have to be increased by a similar factor to reach agreement. Without a self-consistent description of air shower observables, con-clusions about the mass composition from the measured absolute muon content remain tentative.
FIG. 5 (color online). Average logarithmic muon content hln Rμi (this study) as a function of the average shower depth
hXmaxi (obtained by interpolating binned data from Ref.[40]) at
1019eV. Model predictions are obtained from showers simulated
at θ ¼ 67°. The predictions for proton and iron showers are directly taken from simulations. Values for intermediate masses are computed with the Heitler model described in the text.
FIG. 6 (color online). Comparison of the mean logarithmic muon content hln Rμi at 1019eV obtained from Auger data with
model predictions for proton and iron showers simulated at θ ¼ 67°, and for such mixed showers with a mean logarithmic mass that matches the mean shower depth hXmaxi measured by
the FD. Brackets indicate systematic uncertainties. Dotted lines show the interval obtained by adding systematic and statistical uncertainties in quadrature. The statistical uncertainties for proton and iron showers are negligible and suppressed for clarity. MUONS IN AIR SHOWERS AT THE PIERRE AUGER … PHYSICAL REVIEW D 91, 032003 (2015)
032003-9
Figure 4: Left: Average shower muon content
Rµ
as a function of the shower energy E. Data is shown
as the black dots together with its statistical uncertainty while the systematic measurement uncertainty is
represented by the square brackets. The predictions of the models for proton and iron induced shower are
shown as dashed lines. Right: Average logarithmic muon content as a function of the average shower depth
at 10
19eV. The predictions of the different hadronic interaction models under an assumption of a given
primary mass composition are also shown. [
10
]
Interestingly, if one confronts the value of this measurement,
R
µ, with the hX
maxi
mea-surement at E = 10
19eV one finds that none of the present post-LHC tuned hadronic interaction
models can provide a consistent solution in terms of primary mass composition. This conclusion is
achieved even considering all the measurements systematic uncertainties.
High-energy interactions at the Pierre Auger Observatory
Ruben Conceição
4.3 X
maxµvs X
maxAuger has also measured the profile of the depth at which muons are produced during the
development of each shower, the muon production depth (MPD), and published the evolution of
the average depth of the maximum of the MPD profile,
X
maxµ, as a function of energy [
11
]. The
measurement of the MPD profile is done with SD events using the geometrical delay of the muons,
i.e. combining the shower geometry with the arrival time of these particles. The analysis needs
to be performed in regions dominated by muons and as such it uses inclined events (θ ∼ 60
◦) and
regions away from the shower core. Similarly to the X
maxresults, but with larger uncertainties, the
data indicates an increase of heavier elements as the energy increases. It is important to note that,
as this analysis is performed with the SD, it can reach higher energies.
VII. DISCUSSION
Under the assumption that air-shower simulations
are a fair representation of reality, we can compare them
to data in order to infer the mass composition of
UHECRs. For interaction models (like those used for
Fig.
8
) that assume that no new physics effects appear
in hadronic interactions at the energy scales probed
by Auger, the evolution of the mean X
μmax
values indicates
a change in composition as the energy increases. Data
show a flatter trend than pure proton or pure iron
predictions (35.9 ! 1.2 and 48.0 ! 1.2 g=cm
2=decade,
respectively
5). We measure a value of dhX
μmax
i=dlog
10E ¼
−25 ! 22ðstatÞ ! 21ðsystÞ g=cm
2=decade.
This
value
deviates from a pure proton (iron) composition by
1.8 ð2.3Þσ.
In Fig.
8
, we observe how QGSJ
ETII-04 and E
POS-LHC
estimate, for both protons and iron, a similar muonic
elongation rate (evolution of X
μmaxwith energy) but with
considerable differences in the absolute value of X
μ max.
While the Auger data are bracketed by QGSJ
ETII-04 , they
fall below the E
POS-LHC estimation for iron. Therefore, the
study of the MPD profile can also be used as a tool to
constrain hadronic interaction models.
X
maxand X
μmaxare strongly correlated, mainly by the
depth of first interaction
[29,36]
. According to simulations,
the correlation factor between these two observables is
≥ 0.8. Therefore, similarly to X
max, X
μmaxis correlated with
the mass of the incident cosmic ray particle. We can thus
convert both observables into hln Ai using the same
interaction model
[8,37]
.
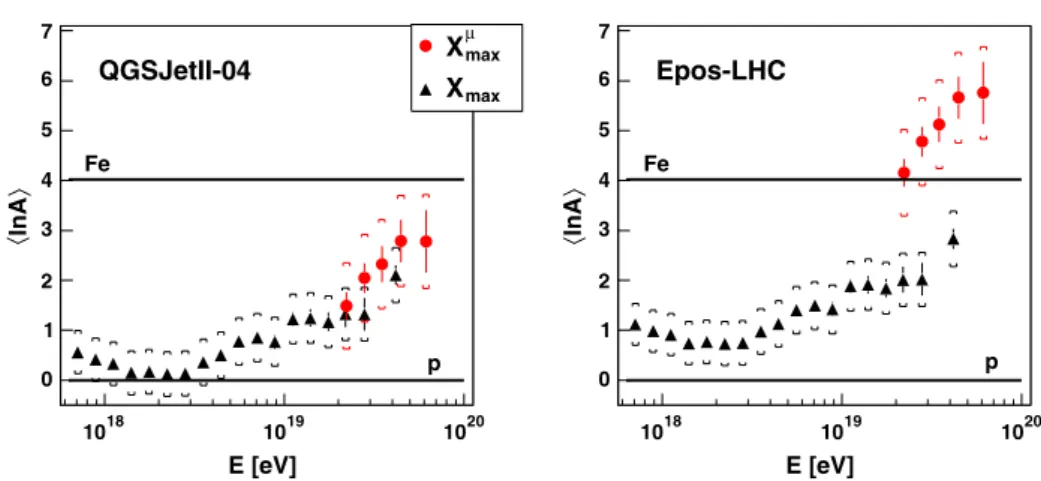
Figure
9
shows the outcome of this conversion for two
different hadronic models. For E
POS-LHC the results
indicate primaries heavier than iron (ln A
Fe≃ 4). The mean
ln A values extracted from the measurements of X
maxand
X
μmaxare incompatible at a level of at least 2.5σ. E
POS-LHC
in combination with F
LUKA2011.2b.4 as a low-energy
interaction model does not offer a consistent description of
the electromagnetic and muonic components of the EAS.
With QGSJ
ETII-04/F
LUKA, we obtain compatible values
for ln A, but it should be noted that, in contrast to E
POS-LHC , this model has problems to describe in a consistent
way the first two moments of the ln A distribution obtained
from the X
maxmeasurements done with the FD
[8]
. We
conclude from the comparisons shown in Ref.
[8]
and here
that none of the interaction models recently tuned to LHC
data provide a consistent description of the Auger data on
EM and MPD profiles.
The found discrepancies underline the complementarity
of the information provided by the longitudinal profiles of
the electromagnetic particles and the muons. The EM
profile in a shower originates mainly from the decay
products of high-energy neutral pions produced in the first
few interactions and is thus closely related to the features of
hadronic interactions at very high energies. In contrast, the
MPD profile is an integral measure of high and
inter-mediate energy interactions, as most charged pions decay
only once they have reached energies below 30 GeV. While
details of interactions at a few 100 GeV are insignificant for
the EM profile, they are of direct relevance to muons.
Hence, the measurement of muon profiles provides
valu-able insight that sets additional constraints on model
descriptions and will help to improve our understanding
of hadronic interactions.
VIII. CONCLUSIONS
The FADC traces from the water Cherenkov detectors of
the Pierre Auger Observatory located far from shower cores
have been used to make a reconstruction of the muon
production depth distribution on an event-by-event basis.
The maximum of the distribution X
μmaxcontains
informa-tion about the nature of UHECRs. However, the current
level of systematic uncertainties associated with its
E [eV] 18 10 1019 1020 〉 lnA〈 0 1 2 3 4 5 6 7 max µX
maxX
QGSJetII-04
Fe p E [eV] 18 10 1019 1020 〉 lnA〈 0 1 2 3 4 5 6 7Epos-LHC
Fe pFIG. 9 (color online). Conversion of hX
μmax
i (circles) and hX
maxi (triangles)
[38]
to hln Ai, as a function of energy. On the left (right)
plot, we use QGSJ
ETII-04 (E
POS-LHC ) as the reference hadronic model. See text for a detailed discussion of the difference between
models. Brackets correspond to the systematic uncertainties.
5
Mean values between QGSJ
ET
![Figure 2.9: Estimate of the composition of ultra-high energy cosmic rays at the top of the atmo- atmo-sphere [23]](https://thumb-eu.123doks.com/thumbv2/123dok_br/15612035.1053769/4.892.169.727.147.434/figure-estimate-composition-ultra-high-energy-cosmic-sphere.webp)