Universidade de Lisboa
Faculdade de Farmácia
Total Antioxidant Capacity Tests on
Wine and Teas
Marlene de Jesus Cordeiro Rosário
Mestrado Integrado em Ciências Farmacêuticas
Faculdade de Farmácia
Total Antioxidant Capacity Tests
on Wine and Teas
Marlene de Jesus Cordeiro Rosário
Monografia de Mestrado Integrado em Ciências Farmacêuticas apresentada à Universidade de Lisboa através da Faculdade de Farmácia
Orientador: Doutor Stefano Girotti, Professor Associado
Co-orientador: Doutora Maria do Rosário Beja de Figueiredo Gonzaga
Bronze, Professora Associada
2
This work was provided by an Erasmus + programme
laboratory internship that took place at the Alma Mater
Studiorum – Università di Bologna. The project was
developed at FaBiT – Dipartimento di Farmacia e
Biotecnologie.
3
Abstract
Nowadays, antioxidants are taken as extremely important and bioactive compounds due to their many proven health benefits. Generally found in vegetables and fruits, polyphenols are a complex group of molecules to whom science has attributed antioxidant properties. The desire to uncover the true antioxidant capacity of multiple edible products has been growing with arising complex health issues related to pollution and ultimately associated with free radical’s pathological accumulation. In this experimental work, the antioxidant capacity of different wines and teas, five and six varieties, respectively, is assessed using the chemiluminescence method of total radical trapping antioxidant parameter (TRAP). ABAP [2,2’-Azobis (2-methylpropionamidine)] decomposition produces free radicals that will interact with luminol, leading to luminol induced chemiluminescence. The luminescence formed is then quenched by the addition of antioxidant samples into the reaction medium which will supress the light emission phenomenon for a certain amount of time (τlag). Trolox, a water-soluble analogue of tocopherol has been reported as the gold standard reference inhibitor commonly employed in antioxidant determination assays and as such it was used as standard. The induction times obtained were evaluated regarding their proportionality towards antioxidant concentration and radical neutralization power from the antioxidant pool of compounds, resulting in the determination of the total antioxidant capacity of the given samples. The antioxidant activities of the samples were expressed as micromolar Trolox equivalents. Wine showed a significant higher antioxidant activity compared to tea of roughly 82,2%. The highest result belonging to sencha tea was still approximately 25% below the lowest wine antioxidant activity tested. Wine grapes cultivar varieties, maturation time and processes affecting antioxidant capacity were discussed as well as tea plant cultivars treatment aspects, subjection to fermentation reactions and extraction methods. Total antioxidant capacity assessed with TRAP methodology decreased in the order: Syrah > Sangiovese > Cabernet Sauvignon > Cabernet Sauvignon + Merlot > Cascinello > sencha > bancha > green > matcha > black > rooibos. Brewed tea storage effect on antioxidant activity loss was also verified in which matcha demonstrated to be the less affected among tea samples.
4
Resumo
Atualmente, os antioxidantes são tidos como compostos extremamente importantes e bioativos devido aos seus muitos benefícios comprovados para a saúde. Geralmente encontrados em vegetais e frutas, os polifenóis são um grupo complexo de moléculas às quais a ciência atribui propriedades antioxidantes. O desejo da descoberta da verdadeira capacidade antioxidante de vários produtos comestíveis tem crescido com o aumento da incidência de problemas de saúde complexos relacionados com a poluição e acumulação patológica de radicais livres. Neste trabalho experimental, a capacidade antioxidante de diferentes vinhos e chás, cinco e seis variedades respetivamente, é avaliada pelo método da quimioluminescência TRAP (Parâmetro antioxidante de captura total de radicais). A decomposição do ABAP [2,2’-Azobis(2-methylpropionamidine)] produz radicais livres que interagem com o luminol, levando à quimioluminescência por este induzida. A luminescência formada é então extinta pela adição de amostras de antioxidantes ao meio reacional que suprimem o fenómeno de emissão de luz por um certo período (τlag). O Trolox, um análogo do tocoferol solúvel em água, é o inibidor de referência comumente empregue em ensaios de determinação antioxidante sendo portanto empregue como padrão. Os tempos de indução obtidos foram avaliados considerando a sua proporcionalidade em relação à concentração antioxidante e ao poder de neutralização radicalar dos compostos antioxidantes presentes, resultando na determinação da capacidade antioxidante total das amostras. As atividades antioxidantes das amostras foram expressas em equivalentes de Trolox micromolares. O vinho mostrou uma atividade antioxidante significativamente mais alta quando comparado ao chá de aproximadamente 82,2%. O melhor resultado entre os chás, pertencente ao sencha, está ainda aproximadamente 25% abaixo da menor atividade antioxidante obtida para o vinho. Foram discutidas como as variedades das uvas, tempo e processos de maturação podem afetar a capacidade antioxidante dos vinhos, bem como aspetos relativos ao tratamento das safras de chá, exposição a reações de fermentação e métodos de extração. A capacidade antioxidante total avaliada pela metodologia TRAP diminuiu na ordem: Syrah>Sangiovese>Cabernet Sauvignon>Cabernet Sauvignon + Merlot>Cascinello>sencha> bancha>verde>matcha> preto>rooibos. Foi também verificado o efeito do armazenamento do chá na perda de atividade antioxidante, na qual o matcha demonstrou ser o menos afetado entre as amostras.
5
Acknowledgements
First of all, I would like to express my sincere gratitude for the Bologna University, and more specifically to FaBiT – Dipartimento di Farmacia e Biotecnologie, for actively receiving and creating Erasmus+ opportunities for so many students like me and providing the research equipment and facilities necessary to accomplish ambitious projects, thus allowing this extremely challenging and rewarding experience to take place.
Secondly, a deepest thanks to my tutor at Bologna, Prof. Dr. Stefano Girotti for all the assistance, advices and transmitted knowledge. The guidance I received was tremendously important throughout my work, from the theme idealization part to the analytical test moments and up to results interpretation and critical discussion.
Thirdly, I am specially thankful to my co-supervisors at FaBiT, Dr. Luca Bolelli and Dr. Stefano Sangiorgi for their everyday teachings and friendly personal support. Their laboratory expertise, exceptional knowledge and ideas allied to critical thinking kept me enthusiastic even when difficulties arised. The days gone by so fast and were so pleasant thanks to them.
I would like to extend my gratitude for my Lisbon University tutor, Prof. Dra. Maria do Rosário Bronze for her guidance, availability, supervision and all the insights given during these months.
To the pharmacy that received me in my curricular internship, especially in the person of Dra. Sandra Nunes, I am very grateful for the way all the team members welcomed me, guided and supported through these last months, helping to reach this final step as a better professional.
To my mother and to my father, for always believing in me. I thank the opportunity you have given me to embark on this adventure, the strength, unlimited love and kind words. Without you this simply would not be possible.
To my family and friends, for all the love, help, encouragement and unconditional support, know that it made the difference to have you all by my side. A very special and final thanks to Paulo Santos, who has supported me through all this journey steps with his love, empowerment and patience.
6
List of Abbreviations and Symbols
µL microliter
1O
2 Singlet oxygen
A Antioxidant molecule
AAPH 2,2’-Azobis (2-methylpropionamidine) ABAP 2,2’-Azobis (2-methylpropionamidine)
ABTS 2,2’-azinobis(3-ethylbenzothiazoline-6-sulfonic acid)
BHA Butylated hydroxyanisole
BHT Butylated hydroxytoluene
C (+)-catechin
CAT Catalase
CPS Counts per second
DMSO Dimethyl sulfoxide [(CH3)2SO]
DPPH 2,2-diphenyl-1-picrylhydrazyl
Drop% Micromolar Trolox equivalents reduction percentage
EC (-)-epicatechin
ECG (-)-epicatechin gallate
EGC (-)-epigallocatechin
EGCG (-)-epigallocatechin gallate
FRAP Ferric reducing antioxidant power
GPx Glutathione peroxidase
GSH Glutathione
H Hydrogen atom
H2O2 Hydrogen peroxide
HAT Hydrogen atom transfer
HOCl Hypochlorous acid
HPLC High-performance liquid chromatography
HRP Horseradish Peroxidase
IOC Inhibited oxygen uptake
KH2PO4 Potassium hydrogen phosphate
L●- Luminol radical anion
LPIC Lipid peroxidation inhibition capacity
M molar
7
min minutes
mL millilitre
mM millimolar
Na2CO3 Sodium carbonate
Na2HPO4 Disodium hydrogen phosphate
NaHCO3 Sodium bicarbonate
NaOH Sodium Hydroxide
O2●- Superoxide anion
OH● Hydroxyl radical
ONOO- Peroxynitrite
ORAC Oxygen radical absorbance capacity
Oz. Ounces
PG Propyl gallate
pH Hydrogen potential
R Radical
RNS Reactive nitrogen species
ROO● Peroxyl radical
ROS Reactive oxygen species
RSS Reactive sulphur species SET Single electron transfer
SO2 Sulphur dioxide
SOD Superoxide dismutase
SS™ Super Signal™ ELISA Femto Stable Peroxide Solution StDev% Standard deviation percentage
TBHQ Tert-butylhydroquinone
TEAC Trolox equivalent antioxidant capacity TRAP Total radical trapping antioxidant parameter
Trolox (±)-6-hydroxy-2,5,7,8-tetramethylchromane-2-carboxylic acid
UV Ultraviolet
WHO World Health Organization
X Substrate molecule
8
Table of Contents
1. Introduction ... 12
1.1. Antioxidants – a bioactive group of compounds... 12
1.2. Free radicals and oxidation ... 13
1.3. Antioxidants characteristics and effects ... 15
1.4. Antioxidant Capacity Tests – an overview ... 17
1.5. Chemiluminescence – a tool for free radical’s analysis ... 19
1.6. Wine, Teas and Infusions – sources of natural antioxidants... 20
1.7. Trolox – an internal standard for antioxidant analysis ... 24
1.8. Aims of the experimental study ... 25
2. Materials and Methods ... 26
2.1. Materials ... 26
2.2. Equipment ... 27
2.3. Methods ... 28
2.3.1. TRAP – the underlying mechanisms ... 28
2.3.2. TRAP method ... 29
2.3.3. Preparation of samples ... 30
2.3.4. Pre-experimental work: finding the optimal analytical system ... 31
2.3.4.1. SS™ as a luminescence enhancer... 32
2.3.4.2. Buffer optimization ... 32
2.3.4.3. Luminol and ABAP ... 33
2.3.4.4. Volumes and concentrations of system components ... 34
2.3.4.5. Trolox standard ... 34
2.3.4.6. Optimal reaction conditions ... 35
9
2.3.6. Statistical Analysis ... 36
3. Results and Discussion ... 37
3.1. Characterization of chemiluminescent system ... 37
3.2. System response in antioxidant presence ... 38
3.3. TRAP quantification ... 39
3.4. Results regarding wine samples ... 40
3.5. Results regarding tea and infusion samples ... 42
3.5.1. Preservation of antioxidant capacity – 6h, 24h and 30h window time ... 44
3.6. Method adequacy ... 46
4. Conclusions ... 47
References ... 49
10
List of Figures
Figure 1 – ROS formations and its functions. 16 ... 14
Figure 2 – Synthetic antioxidants: BHA, BHT and PG, respectively.9 ... 15
Figure 3 - Polyphenols structures and classification. 19... 17
Figure 4 – Scheme of chemiluminescent light emission. 24 ... 20
Figure 5 - Structure of catechins present in tea. 33 ... 22
Figure 6 - Trolox molecule. ... 25
Figure 7 - Luminol molecule. ... 28
Figure 8 - ABAP molecule. ... 28
Figure 9 - Tea samples preparation. Above, from left to right: green, bancha, black, rooibos, matcha and sencha teas and infusion extractions. Below, from left to right: blank sample and dilutions of the samples in Eppendorf safe-lock tubes. ... 30
Figure 10 - Super Signal™ ELISA Femto Maximum Sensitivity Substrate kit. ... 32
Figure 11 – Representation of luminol luminescence time profile induced by ABAP decomposition at 21ºC. Light intensity measured in relative units of CPS (counts per second). ... 37
Figure 12 – Representation of luminol luminescence time profile induced by ABAP decomposition at 21ºC. Antioxidant addition after reaching a stable luminescence signal. Light intensity measured in relative units of CPS (counts per second). ... 38
Figure 13 - Luminescence Counter VICTOR Light® 1420 (PerkinElmer) with manual sample insertion and visualization of the light emission detection programme running a microplate test... 39
11
List of Tables
Table 1 - HAT and SET methods for antioxidant capacity determination. Adaptated.7 ... 19
Table 2 - Red and white wines content in major polyphenolic compounds. 9,39,40 ... 23
Table 3 - Wine samples overview. ... 27
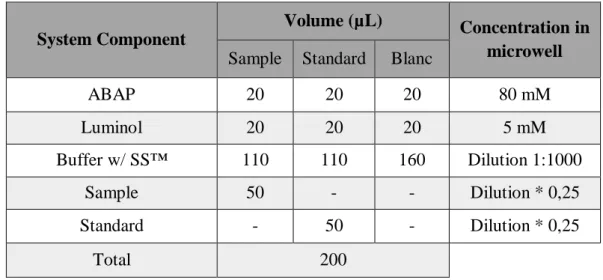
Table 4 - Microwell system components. ... 34
Table 5 - Antioxidant results of wine samples. ... 40
Table 6 - Antioxidant results of freshly prepared tea samples. ... 42
Table 7 - Antioxidant Capacity of freshly prepared tea and 6h later. ... 44
Table 8 - Antioxidant Capacity of freshly prepared tea and 24h later. ... 44
12
1. Introduction
1.1.
Antioxidants – a bioactive group of compounds
The World Health Organization (WHO) states that natural products such as fruits and vegetables are vital and therefore must be consumed daily 1. Clinical trials and epidemiologic
studies have already described a negative correlation between their intake and aging-related ailments2, stressing that their antioxidant activity certainly constitutes a strong preventive health factor.3 Therefore, making one of the reasons that contributes to this necessary intake the high antioxidant effect they exert.4,5
Antioxidants are defined as molecules that at low concentrations compared to those of oxidizable materials6 are able to inhibit the formation of free radicals or can terminate the autoxidation chain process. In fact, these compounds do so by being more easily and quickly oxidized than other molecules.4,7 Therefore, when present, they protect the integrity of edible products by playing a part on its conservation and therefore increasing its shelf life or, for instance, acting on living organisms where they perform a main role at preventing cellular damage 7 – the consequence which derives from free radicals formation and their attack on
DNA, RNA proteins and lipids.8
The growing interest and knowledge of the scientific community and general population about health and illness, as well as about having a balanced and nutrient rich diet has led to the desire of discovering which products from the quotidian and from natural sources could aid to a health and wellbeing status.9 Nowadays, it is well stablished that these highly reactive species
are at the pathologic basis of oxidative stress related disorders such as carcinogenesis, cardiovascular, inflammatory and age-related neurodegenerative imparements.9–12
Among these products from everyday life, wine, teas and infusions have sparked particular interest regarding their health benefits and consequently making the analysis of their antioxidant activity a subject of large importance.5,9 In some previous works polyphenols, a large group of compounds, have been pointed out as the compounds largely responsible for the antioxidant action demonstrated by those beverages. 13
13
1.2.
Free radicals and oxidation
Free radicals are chemical entities that possess at least one unpaired electron in their outermost valence shell while being an independent molecule. They are intermediary metabolites formed during oxidative metabolism and cellular respiration which are fundamental processes for cell and organism survival.6,9,14 Physiological functions rely on those oxidation processes.15
Nonetheless, the fact that they have unpaired electrons in the external orbit makes them greatly reactive towards other molecules given their eagerness to form more stable species. Acting like electron acceptors, they extract electrons and leave molecules in an oxidized state, thus being called oxidizing agents. 9,14
The most relevant radical species in biological systems are hydroxyl radical (OH●), superoxide anion (O2●) and singlet oxygen (1O2). Further non-radical molecules such as
hydrogen peroxide (H2O2), peroxynitrite (ONOO-) and hypochlorous acid (HOCl) also act like
free radical generators although not being radicals themselves. These oxygen-centred free radicals and molecules are generally called reactive oxygen species (ROS), whereas the ones derived from nitrogen, reactive nitrogen species (RNS) or sulphur, reactive sulphur species (RSS), are either considered by authors as diverse groups or instead viewed as a hole, regarding their ability of triggering oxidation processes, in which case ROS is widely used for simplicity.6,9,14 Also, is worth mentioning that hydroxyl and alkoxyl are considered the most avid free radicals, quickly attacking cells located in their proximitiesand consequently having half-life times as short as nanoseconds.6
As aerobic metabolism by-products, ROS are continuously produced in cells during normal physiological events such as the electron transportation chain in mitochondria and NADPH oxidase activity in cell’s membranes, neutrophils and phagosomes. ROS then take part in immunity-related pathways like in an antimicrobial response, formation of DNA extracellular traps and autophagy6,16. Fundamentally, they possess an important role as weapons against invading pathogenic microbes and are as well extremely relevant in the regulation of cellular signalling cascades, thus exerting vital functions. Inversely, defence antioxidant and endogenous mechanisms exist and are activated in order to restore the equilibrium between
14 ROS formation and neutralisation. Unfortunately, exogenous sources such as UV (ultraviolet) light, gamma or X-rays radiation, environmental pollutants and cigarette smoke9 can also concur to ROS accumulation and hence induce an imbalance that is commonly called oxidative stress. This process greatly damages cells owing to the fact that critical cellular components such as DNA, proteins and lipids are subject to oxidation.14
Autoxidation is an oxidation reaction that takes place in the presence of air oxygen and at slow rate and mild conditions. The chain process can be divided in three major steps, normally involving ROS formation: initiation, propagation and termination.9
• Initiation: XH + R● → X● + RH • Propagation: X● + O2 → XOO● XOO● + XH → XOOH + X● • Termination:
XOO● + X● → nonradical products X● + X● → nonradical products XOO● + XOO● → nonradical products
15
1.3.
Antioxidants characteristics and effects
The limitation of ROS accumulation and the consequent prevention of disease is accomplished by antioxidants through different manners: hydrogen and electron donations (reduction processes), trapping of radical species, peroxide decomposition, chelation of transitional metals, quenching of singlet oxygen molecules, activation of enzyme mechanisms of oxidative defence or through a synergistic effect in combination with an additional antioxidant.
Antioxidants can be of endogenous origin such as the antioxidant enzymes catalase (CAT), glutathione peroxidase (GPx) and superoxide dismutase (SOD) and non-enzymatic, as for example uric acid, α-lipoic acid and glutathione (GSH). Exogenous antioxidants are present in food including ascorbic acid (vitamin C), α-tocopherol (vitamin E), carotenoids and phenolic compounds.9,17 These compounds may also be separately classified as natural or synthetic antioxidants. Synthetic antioxidants are the most generally used for food and pharmaceutical applications and commonly belong to the phenolic compounds group. Among the most popular examples are butylated hydroxyanisole or E-320 (BHA), butylated hydroxytoluene or E-321 (BHT), propyl gallate or E-310 (PG) and tert-butylhydroquinone or E-319 (TBHQ).6,17,18
Additionally, antioxidants can be considered as primary or secondary according to their mechanism of action:
Primary antioxidants such as phenolic compounds and tocopherols do not allow the
initiation step of oxidation processes to be triggered, therefore breaking oxidative chain reactions. They do so by being hydrogen and electron donors and thus blocking free radicals’
16 viability, converting them into stable entities. As a result, the antioxidant becomes inactivated. This type of antioxidant is also called radical scavenger. It is capable of reacting either in the initiation step, as said earlier, in which case interacts with a recently formed radical molecule (R●):
R● + AH → RH + A●;
or interfere later on in the oxidation chain reactions, specifically in the propagation step, where it neutralizes alkoxyl and peroxyl radicals:
ROO● + AH → ROOH + A● RO● + AH → ROH + A●.
The antioxidant radical product may continue to interfere in the propagation phase of oxidation and thus contributing to the overall radical stabilisation process:
A● + ROO● → ROOA A● + RO● → ROA.
Secondary antioxidants like ascorbic acid and β-carotene are considered preventive or
acceptor antioxidants given their ability to bind air oxygen or slow down oxidation through some processes different from direct hold of the autoxidation chain. This can be accomplished by means of: metal ion complexation (ascorbic acid), partial regeneration of primary antioxidants (ascorbic acid and thiols), trapping singlet oxygen (β-carotene), UV radiation absorption, scavenging oxygen (ascorbic acid) and decomposition of non-radical species and peroxides (Maillard reaction products).
Numerous molecules of natural origin have been studied in order to find new answers to unsolved demands. Vegetable, marine and microbial organisms are considered a source of novel compounds, demonstrating activity in many diseases, including cancer.19 These
17 through the evolution process. Among natural compounds, polyphenols are proven to be one of the main categories leading to health benefits due to their high antioxidant power.
The polyphenol group of compounds have one or more phenyl aromatic rings as their basic structure, which have at least one hydroxyl group as a ring substituent. Still, they can be further divided in classes given the large structural and moiety diversity they present: variable number of aromatic rings and hydroxyl, alkoxyl and carboxylic functions.20 Flavonoids, the most important phenolic structured group of compounds present in food21 are part of the polyphenol’s family of molecules.19 Polyphenols include flavonoids, phenolic acids, tannins,
lignans and stilbenes.
1.4.
Antioxidant Capacity Tests – an overview
There is a large diversity of tests capable of evaluating antioxidant activity. Essentially, these experimental methods can be divided into two groups, according to the system’s underlying reaction:
18
Hidrogen Transfer Reactions (HAT), in which the substance loses a hydrogen atom.
Peroxyl radicals are mostly used as the radical specie and are typically obtained from the decomposition of azo-compounds. The stronger the antioxidant, the more capable it is of transferring a hydrogen atom and therefore quenching free radicals. Normally, the final product of the reaction, which in this case is an antioxidant molecule with an unpaired electron, is stabilized by resonance and all the molecules become chemically inactive. 2,7,9 In these reactions, both the system’s probe and the antioxidant respond to free radical presence and therefore the interactions can be described as competitive, as well as the associated kinetics. A signal decay can be observed with its size indicating the antioxidant power in scavenging the oxidative species. The absence of antioxidants or their low efficacy reveal a transient plateau that later will suffer a small and continuous decrease in the signal, as the reagents are still being consumed. The hydrogen donation reaction that takes place can be generically described as:
R● + AH → RH (reduced radical) + A● (oxidized but stable).
The most applied assays are the Oxygen Radical Absorbance Capacity (ORAC), the Total Peroxyl Radical Trapping Antioxidant Parameter (TRAP) and the ABTS (2,2’-azinobis(3-ethylbenzothiazoline-6-sulfonic acid) radical scavenging.7,9
Eletron Transfer Reactions (SET), where a substance is oxidized by losing an electron
to an oxidizing agent. In this reaction the oxidizing agent is the actual probe of the system and the antioxidant’s activity is tested through its capability to reduce the probe with extraction of an electron. When reduced, the probe changes its light emission wavelength in a degree that indicates the antioxidant intensity and concentration. The electron transfer reactions can be simplified as:
probe (oxidant) + e- (from A) → probe- (reduced) + A+ (oxidized but stable) R● + AH → R- AH●+
Among these methods are worth mentioning the Trolox equivalent antioxidant capacity (TEAC), the Ferric Reducing Antioxidant Power (FRAP), Total Phenols by Folin-Ciocalteau and finally the DPPH free radical scavenging.7,9,22
19 Table 1 - HAT and SET methods for antioxidant capacity determination. Adaptated.7
Mechanism Antioxidant Capacity Assay
HAT based assays
ORAC (oxygen radical absorbance capacity)
TRAP (total radical trapping antioxidant parameter) ABTS radical scavenging
LPIC (Lipid peroxidation inhibition capacity) IOC (Inhibited oxygen uptake)
SET based assays
TEAC (Trolox equivalent antioxidant capacity) FRAP (Ferric reducing antioxidant power) DPPH free radical scavenging
Total phenols by Folin-Ciocalteau
1.5.
Chemiluminescence – a tool for free radical’s analysis
Luminescence was discovered and reported since Antiquity.23 Nowadays, different fields of interest have used this group of mechanisms as a detection endpoint such as in environmental, biomedical, toxicological and food studies.23,24
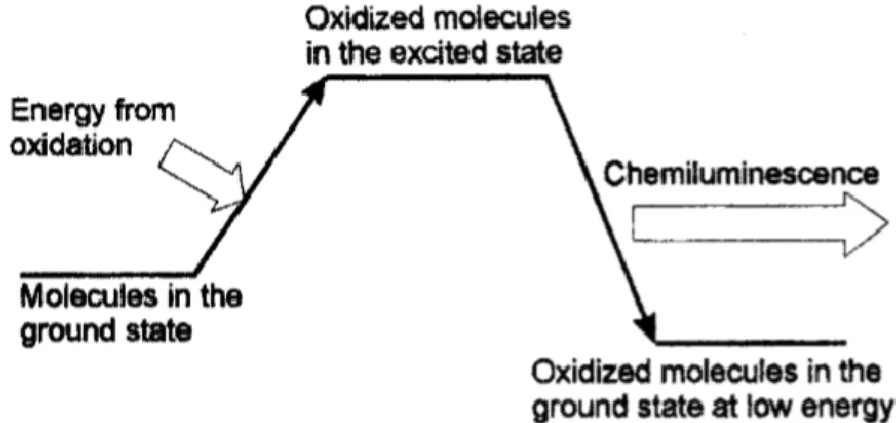
Chemiluminescence is defined by the emission of electromagnetic energy in the wavelengths correspondent to infrared, visible or ultraviolet light as a result of an ongoing chemical reaction. Whereas other luminescence events involve an increase in heat and therefore, in kinetic energy, or perhaps an electric discharge or absorption of light, chemiluminescence, on the other hand, is derived specifically from a chemical interaction wherein the kinetic energy average remains equal.23
Among the advantages of chemiluminescence techniques are worth naming the basic and inexpensive instrumentation necessary as the optical system does not require an external light source, the low noise signal in comparison to other electromagnetic radiation methods such as fluorimetry and spectrophotometry, as well as the lower detection limits that can be achieved.
However, like any other scientific method, it has limitations as for example the close control that must be carried out of the environmental variables since they largely affect light emission. Additionally, monitoring the composition of the system is of great importance as a
20 chemiluminescent molecule is not a selective reagent and consequently may emit light in the presence of impurities capable of chemically exciting it. Finally, the light emission pattern varies in time, having different curve aspects when altering analytes, the actual reaction system or the period chosen for analysis, denoting de importance of prior establishment of the reaction factors and detection endpoints.25
A free radical in the vicinity of a radical-induced luminescence molecule leads to the occurrence of chemiluminescence phenomena. The initial oxidation step leaves a potential light emitting material in its excited state which then rapidly decays to its baseline through light emission or transfers its energy to a neighbouring molecule which then emits light itself. 23,26
1.6.
Wine, Teas and Infusions – sources of natural antioxidants
More than 2000 years ago, the concept of using food as something more than its basic function of meeting nutritional needs first emerged. "Let food be medicine, and medicine be
food" Hippocrates, the Medicine’s father, postulated in the fifth century BC. Several cultures
have followed this ideal leaving marks in their tradition when it comes to building a healthy and preventive diet, including Greek, Chinese, Indian and Egyptian.27 Nowadays, mechanisms
have been proposed in order to justify tea, grapes and wine consumption benefits.21
Tea, a worldwide highly consumed beverage, can be categorized into five types
according to the degree of fermentation to which the leaves are exposed during production: white tea, which is not fermented and is produced from young leaves and leaf buds, being the
21 least processed one; green tea, which is not subjected to any fermentation process but is made from more mature leaves that are preserved by placing them into contact with a mild thermal treatment: either steamed, boiled, microwaved or electrically heated so as to inactivate endogenous enzymes like polyphenol oxidase or peroxidase;28 oolong tea, which suffers a partial fermentation process29,30; black tea, that is fermented through the oxidation of those intrinsic endogenous oxidases which transform catechins originally present in the tea plant leaves into another polyphenol category, the theaflavins, and finally pu-erh, fermented after an initial drying process of a few years.29–31 Commonly planted and manufactured in subtropical
or tropical regions, usually in Asia31, all teas derive from the plant species Camellia sinensis
(L.) The unique taste and flavour of each one consequently derive from the different treatment the leaves suffer.
A large number of scientific authors have previously discussed which factors can affect tea composition. Some of the more commonly accepted ones regarding particularly the phenolic composition are variables such as climatologic factors, growing conditions, performed processes and even the condition in which the extract is prepared under.30
Green tea can further be divided into many different types: sencha, bancha and matcha are just three of the most popular ones and as such were chosen for the upcoming analytical tests. Sencha is made from the leaves picked up in the main picking season, making it a good quality tea; bancha, which is made from leaves picked up in the late picking season, is therefore a lower quality tea.32 Matcha, on the other hand, is a very special kind of green tea that is obtained from pulverization of the leaves. An additional differentiator factor is the amount of sunlight to which the leaves are exposed. Unlike other types of green tea, whose leaves are kept in direct sunlight, matcha leaves grow in the shade about 90% of the time. As a result, the total amount of catechins leaves content is presumably higher as sunlight negatively affects their composition and concentration.33
Polyphenolic compounds, in particular catechins (also known as flavanols or flavan-3-ols), are major constituents of tea infusions. The most prevalent are: (+)-catechin (C), epicatechin (EC), epicatechin gallate (ECG), epigallocatechin (EGC), and (-)-epigallocatechin gallate (EGCG), being also the most effective when reacting with ROS.9,34
Tea leaves that are not subject to fermentation processes such as green and white teas primarily hold catechins, while partially fermented oo-long tea and fully fermented black tea are on the other hand mostly constituted by theaflavins – the resulting product molecules from
22 flavonols structure modifications – and increased amounts of gallic acid due to fermentation reactions. It is important to denote that all polyphenol molecules possess antioxidant effect, being that its magnitude depends on specie quantity and proportion, with catechins demonstrating the highest contribution to antioxidant capacity.
Among the several effects already attributed to catechins present in tea are anti-inflammatory properties, decreased incidence of cardiovascular disease and reduction of blood glucose levels.27 Research findings have reported higher radical scavenging activity for green tea compared to that of black tea, which was also correlated with total catechin content. 9,34
Finally, rooibos tea, obtained from the plant species Aspalathus linearis L. was also included in this study due to its growing popularity, including even in the scientific community.35,36 According to the literature, rooibos has a considerable antioxidant activity associated which has been proven by a few laboratory experiments, although scoring consistently lower results compared to green tea varieties. When it comes to comparing black tea and rooibos infusion, different tests report one or another as the strongest radical scavenger, which perhaps could reflect their similar antioxidant capacities. Thus, this study will also try to elucidate this matter.
Wine has been present in human culture for centuries making one of the main
constituents of the Mediterranean diet.37 The American Heart Association claims that
antioxidants should be attained in fruits and vegetables, as for example a red grape juice, and as far as alcohol is concerned a moderate intake is recommended of one to two drinks for men
23 and one drink for women per day – one wine drink corresponding to 4 oz. or approximately 120 mL.38
Polyphenols are largely present in wine, especially in red.9,27,37 They concur not only to the unique flavour, bitterness, colour and astringency, the distinguishable sensory features of this beverage37,41, but also to its activity as an antioxidant. Epidemiological studies have already positively concluded about the benefits of wine intake on cardiovascular and atherosclerotic impairments.27,37
The vinification process, for instance, renders the polyphenolic composition of wines much more complex compared to the unprocessed grape berries of Vitis vinifera (L.). The multiple reactions involved in wine production and maturation as for example hydrolysis, enzymatic and chemical oxidations and condensation reactions strongly affect the final product characteristics, as well as aging features.42 Additionally, since it all begins with grape cultivation, factors such as climate, soil quality, location of the vineyard, stage of grape ripeness
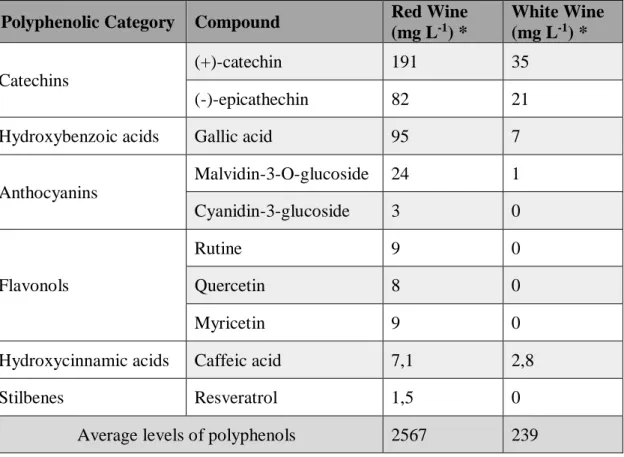
Table 2 - Red and white wines content in major polyphenolic compounds. 9,39,40
Polyphenolic Category Compound Red Wine
(mg L-1) * White Wine (mg L-1) * Catechins (+)-catechin 191 35 (-)-epicathechin 82 21
Hydroxybenzoic acids Gallic acid 95 7
Anthocyanins Malvidin-3-O-glucoside 24 1 Cyanidin-3-glucoside 3 0 Flavonols Rutine 9 0 Quercetin 8 0 Myricetin 9 0
Hydroxycinnamic acids Caffeic acid 7,1 2,8
Stilbenes Resveratrol 1,5 0
Average levels of polyphenols 2567 239
24 at harvest and grape variety also contribute to the total quality and quantity of polyphenol content.37
The polyphenolic compounds that can be found in wine are: catechins (catechin, epicatechin), flavonols (quercetin, rutine, myricetin), anthocyanins (malvidin-3-O-glucoside), condensed tannins, phenolic acids (gallic acid), stilbenes (trans-resveratrol) and many others.9,39,40
As seen, an extremely wide variety of compounds contribute to the antioxidant power exerted by wine. Therefore, completing the task of determining the individual antioxidant contributions of each compound becomes very difficult to access. In fact, it is highly probable that the total antioxidant effect derives from the interaction between these compounds and thus the sum of all the relative antioxidant capacities would not equal the one achieved with the product as a hole.2,37
Sulphur dioxide (SO2) and ascorbic acid are naturally present in wines at low quantities.
However, they occasionally are added during the winemaking process with the purpose of acting as a preservative,37 in which case they concur to the augmentation of the antioxidant
capacity rating, although unrelated to polyphenolic composition. White wines suffer substantially more SO2 and ascorbic acid addition that red ones,5 and consequently may present
antioxidant power results higher than expected and not correlated to their polyphenolic content. Red wines on the other hand have higher polyphenolic content and lower preservative amounts, making their antioxidant capability extremely dependent and correlated with existent polyphenol compounds.37
The grape varieties chosen for the analysis were Syrah, Sangiovese, Cascinello, Cabernet and a mixture of Cabernet Sauvignon and Merlot, all produced and/or acquired in Italy where, unfortunately, SO2 and ascorbic acid addition disclaimers are not mandatory.
1.7.
Trolox – an internal standard for antioxidant analysis
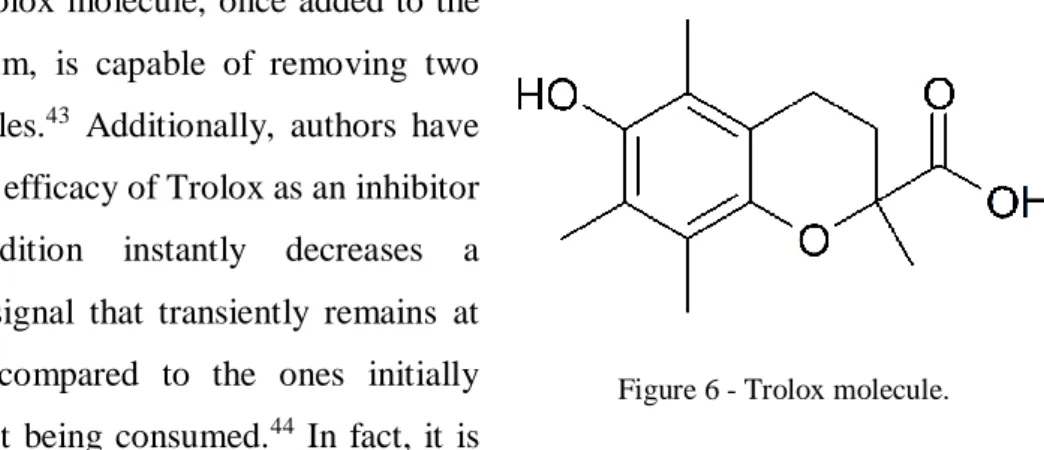
Trolox, (±)-6-hydroxy-2,5,7,8-tetramethylchromane-2-carboxylic acid, a vitamin E water-soluble analogue, is the commonly used gold standard when it comes to antioxidant capacity assays7,43–45. It is considered a reference inhibitor43, and therefore the results obtained
25 from different samples should be confronted with the ones of Trolox, regarding their potential antioxidant capacities.
One Trolox molecule, once added to the reaction medium, is capable of removing two radical molecules.43 Additionally, authors have pointed out the efficacy of Trolox as an inhibitor since its addition instantly decreases a luminescence signal that transiently remains at lower values compared to the ones initially obtained, whilst being consumed.44 In fact, it is
even capable of accomplishing a total suppression of signal if its concentration is high enough.
1.8.
Aims of the experimental study
Numerous literature sources have supported the benefits of the antioxidant activity of wine, teas and infusions consumption as part of a nutrient dense and biologically protective diet. Given that this concept has gain general acceptance, the main objective of this study is to scientifically analyse and testify the antioxidant effect of the samples by putting them into direct contact with radical species and observing the resulting antioxidant behaviour, as well as comparing different types of samples in a relatively and absolut manner.
The specific aims of this study were as follow:
1. To create a valid system with the correct pH and type of buffer, as well as reagent’s concentrations, where the luminescence signal would reflect the ongoing reactions; 2. To choose, dilute and effectively extract the samples array;
3. To relatively compare several samples against each other in order to investigate which ones potentially have more benefits when consumed in vivo;
4. To obtain absolute values concerning the total antioxidant capacity of the samples through the simultaneous application of the gold standard Trolox;
5. To explore how tea storage alter these beverages antioxidant activities.
26
2. Materials and Methods
2.1.
Materials
Reagents
• ABAP (Sigma Aldrich) in a 800 mM solution was freshly prepared each day of experimental procedures with purified water.
• Luminol (Boehringer Mannheim) in a 10 mM stock solution with purified water, solubilized with the aid of an aliquot of DMSO and ultrasound equipment, kept between experiments at 2ºC to 8ºC in the refrigerator, with protection from light exposure. • Trolox (Fluka Analytical) 1 mM in purified water were defrost at room temperature
each run of experiments.
• Super Signal™ ELISA Femto Stable Peroxide Solution (SS™) (Pierce Chemical) as enhancer of the luminescence signal, freshly prepared each run of experiments with 1:1000 dilution together with buffer solution.
Buffer
• Carbonate buffer 0,1M (NaHCO3/Na2CO3) pH=8,6
Samples
• Teas and Infusion:
All the preparations were made following the instructions of the manufacture for volume of water and time of extraction.
o Rooibos (Sonnentor®) – tea bag
o Matcha (Touch Organic®) – tea in powder form extracted in boiling water followed by filtration with pleaded paper filter.
o Green (Panorama®) – tea bag
o Bancha (Arche Naturküche®) – tea bag o English (Panorama®) – tea bag
27 • Wines: sample preparation involved a simple dilution process.
o Syrah – non-commercial full bodied wine in plastic bottle, kept at 2-8ºC. o Sangiovese – non-commercial wine in bottle, room temperature.
o Cabernet Savignon – commercial wine in bottle, room temperature.
o Cabernet Savignon and Merlot – commercial wine mixture in bottle, room temperature.
o Cascinello – commercial wine in carton package, room temperature.
2.2.
Equipment
• Luminescence Counter VICTOR Light® 1420 (PerkinElmer) • Magnetic hotplate stirrer (Falc Instruments)
• Precision balance AA-160® (Denver Instrument Company) • 96-well microplates (Thermo Electron Corporation)
• Micropipettes (Thermo Fisher Scientific) • pH sensor 40® (Beckman)
• Ultrasound machine Starsonic 60® (Liarre)
Red Wine Cultivar Region Vintage Winemaking
Particularities Availability
Syrah Tuscany 2017 Traditional Private
Producer
Sangiovese Tuscany 2015 Traditional Private
Producer Cabernet Sauvignon NA 2013
Aged in wood barrique for 1 year
and then in bottle
Commercial
Cabernet Sauvignon +
Merlot NA 2015 Traditional Commercial
Cascinello (mixture of
multiple grape varieties) NA 2017
Tetrapack© type
packaging Commercial Table 3 - Wine samples overview.
28
2.3.
Methods
2.3.1. TRAP – the underlying mechanisms
Oxidation-based mechanisms have long and successfully been utilizing luminol (5-amino-2,3-dihydro1,4-phthalazinedione) as a chemiluminescence inducer.46,47 Its most famous application is in the forensic field where it is used for searching dry and decomposed blood stains, thus revolutionizing criminal investigations.48
Nonetheless, there are many successful reports of its employment as a luminescent marker in analytical chemistry methods such as titrations, high-performance liquid chromatography (HPLC), flow analysis, immobilization techniques and of course chemiluminescence. 48
ABAP or AAPH [2,2’-Azobis (2-methylpropionamidine) dihydrochloride] has also been studied over time7,44,45,49 and it is stablished that its
decomposition leads to the formation of peroxyl radicals (ROO●) through the following scheme:11,45
ABAP → 2 R●
.
(More specifically: R — N ═ N — R → N2 + 2 R●)
R● + O2 → ROO●.
Luminol (LH2) then reacts with the previously formed peroxyl radicals by efficiently trapping
them which, as a result, leads to the formation of luminol derived radicals:45
ROO● + LH2 → ROOH + LH●.
Figure 7 - Luminol molecule.
29 These luminol-derived radicals (LH●) emit light whilst returning from an excitation state to a low energy ground state. The last reaction stage is the evaluation of an analyte’s capability of quenching light emission due to free luminol-derived radicals scavenging:
LH● + AH → LH2 + A● (oxidized but stable),
although some ABAP free radicals that were not previously captured by luminol can also be present, in theory45. This parallel reaction does not exert luminescence but then again it is
common among all samples and therefore does not alter the results obtained in a significant manner.
2.3.2. TRAP method
TRAP was first developed by Wayner et al.11 and ever since has been described by many scientific authors, with some modifications made when suitable. The first applications of the method were in the evaluation of total antioxidant capacity of plasma and serum when in contact with ABAP6, an easily controllable and clean source of hydroperoxyl radicals.44 The level of oxidation of the oxidizable materials, naturally present in those fluids, would be measured by means of the oxygen consumption that resulted from that reaction: through an oxygen electrode methodology11 or through the R-phycoerythrin emitted fluorescence50. TRAP became the most used technique for that purpose and received general agreement.6,11,51
One of the main mechanistical principles consists on the ability of ROO● generated by ABAP to initiate the peroxidation of organic compounds in aqueous dispersions.6 Moreover, when an antioxidant is present, it should be able to prevent the elongation of the peroxidation chain and/or the formation of more free radicals for a certain length of time τlag. Essentially, it
is tested the ability of the antioxidant to interfere in the reaction between a free radical and a defined probe. This induction time varies proportionally in relation to the power and amount of antioxidant or internal standard added to the reaction mixture and is accordingly used for quantitative determinations of total antioxidant capacity.
TRAP can be defined as the quantity of peroxyl radicals in moles trapped per litre of solution.11 The value of TRAP for a given antioxidant can be calculated through the following
30 TRAP = 2.0 [Trolox] τsample
C τTrolox
Where τsample and τTrolox is the luminescence inhibition time obtained from the sample and from
Trolox, respectively, being that 2.0 represents the stoichiometric factor for the reaction of the peroxyl radicals with Trolox, and that C stands for the sample’s dilution factor. The TRAP result can be viewed as Trolox equivalents which will be the methodology chosen since a calibration curve is employed.
2.3.3. Preparation of samples
Tea and infusion extractions were prepared under the conditions specified by the manufactures. For the sake of attaining the same product a normal consumer would have, the preparation of the samples was conducted simulating household characteristics.
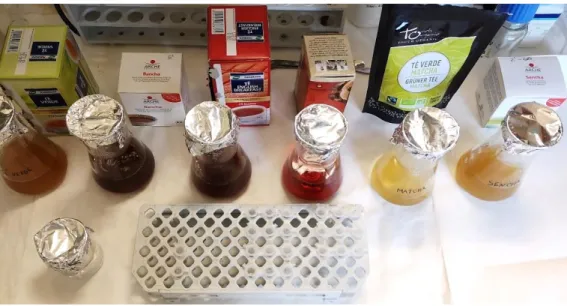
Therefore, tap water was boiled and used in the volume required for one single dose of a cup of tea which was 150 mL for matcha and 200 mL for the rest of the extractions. A blank sample of boiled tap water was also done. In addition, due to the fact that matcha is a powder and as such its particles may interfere with the luminescence signal, a filtration with a dry pleated paper filter was performed after extraction was completed.
Figure 9 - Tea samples preparation. Above, from left to right: green, bancha, black, rooibos, matcha and sencha teas and infusion extractions. Below, from left to right: blank sample and dilutions of the samples in Eppendorf safe-lock tubes.
31 Regarding extraction time, the indications dictated by manufactures were also followed, ranging from 5 to 10 minutes. Afterwards, the extractions were let to cool down at room temperature. Then, dilutions were carried out with the designated buffer.
Wine samples were also made in Eppendorf safe-lock tubes being that the only factor to be aware of was to let Syrah wine reach room temperature, since it was kept in the refrigerator at 2ºC to 8ºC.
Dilutions were carried out in the beginning of the working day and were made at twice the volume required for analysis in order to access freshly prepared tea antioxidant behaviour as well as the alterations that could take place in case samples had been prepared and stored at room temperature or in the refrigerator for diverse periods of time. This second run of experiments will enable to discover if the antioxidant compounds present in these beverages lose scavenging efficacy with time, allowing to simulate tea and infusion intake of a consumer that choses to prepare a bigger pot to drink during the day. Unfortunately, this topic did not seem to have received much attention by the scientific community and thus no literature was found to help to elucidate it. Hence, this study will try to also travel this new road.
2.3.4. Pre-experimental work: finding the optimal analytical system
The method chosen to carry out the study was the TRAP method with modifications, described elsewhere.11,45
As said earlier, in order to evaluate the total antioxidant capacity it was used the chemiluminescence method where a free radical source, the water-soluble azo compound ABAP11, decomposes and promptly reacts with luminol, a molecule that emits light in the presence of free radicals or redox reactions.44 Thereafter, the beverages were added to the mixture with the purpose of scavenging the prior and stable luminescence and thus demonstrating their ability to inactivate free radicals. 44,45 All the results obtained were
32
2.3.4.1. SS™ as a luminescence enhancer
During the first rounds of experiments regarding the efficacy and validity of the chemical system it became obvious that the intensity of the light signal under normal circumstances was somewhat low and occasionally unstable, which was in accordance with what literature had previously stated.6,51 In order to counteract these handicaps, an enhancer must be added such as the previously used para-iodophenol6,51, thus increasing the light emission signal’s stability, longevity and intensity.
In this study the enhancer that was used was Super Signal™ ELISA Femto Stable Peroxide Solution (SS™), a chemical reagent whose composition is not disclosed by the producer. It is commercialized together with another reagent, the Super Signal™ Femto Luminol/Enhancer Solution, and the complete kit is sold under the name Super Signal™ ELISA Femto Maximum Sensitivity Substrate. The Super Signal™ kit is an enhancer chemiluminescent substrate developed for luminometer-based applications.54
Normally, it is employed in ELISA procedures as a substrate for the detection of horseradish peroxidase (HRP).
It is widely used in chemiluminescent methods aiming to obtain an intense and immediate light generation signal at room temperature with high sensitivity and working stability. The application of one of the kit’s components, the peroxide buffer, had the purposes of stabilizing and enhancing the chemiluminescent signal, such as it does in ELISA. The purpose was fulfilled, and it was possible to carry on the experiments as this newly discovered application for SS™ succeeded to better distinguish signal modifications in the course of time.
2.3.4.2. Buffer optimization
Another factor that was central for the experiment triumph was the definition of the system’s constituents and respective concentrations. According to Lissi, et al45 phosphate buffer of disodium hydrogen phosphate and potassium dihydrogen phosphate (Na2HPO4 / KH2PO4) at
the pH and concentration of 8,6 and 0,1 M, respectively – the same used in carbonate buffer –
Figure 10 - Super Signal™ ELISA Femto Maximum Sensitivity
33 were employed, and as the literature had demonstrated, it was concluded that the results were less satisfactory concerning phosphate buffer, mainly due to the signal decreased stability.
Moreover, the luminescence signal obtained with phosphate buffer showed a higher tendency for falling after an initial peak, having a low sustainability profile. The magnitude of the signal itself was slightly inferior compared to the one of carbonate buffer. Sensitivity was also another factor that determined buffer selection since the carbonate buffer performed better at distinguishing luminescence obtained results compared with phosphate buffer when applying diverse reagent amounts and concentrations. Whilst some overlapping between different compound concentrations could be seen with phosphate buffer, the same did not occur with carbonate buffer.
Glycine at pH of 8,6 and concentration of 0,1 M was yet another buffer example used by some authors44,45, but then again it was tested and proved not as beneficial as carbonate buffer in terms of either lower sensitivity and substantially lower signal magnitude at the same experimental conditions.
2.3.4.3. Luminol and ABAP
Luminol is considered to be almost insoluble in water, having a solubility of less than 1 milligram per millilitre (mg/mL).55 According to the manufacturer information sheet56, it is stable at room temperature if protected from light and unstable at high temperatures. Therefore, it must be made soluble without resorting to thermal augmentation. This can be accomplished either by dissolution in DMSO at concentrations around 50 mg/mL or in a base where it is quite soluble, typically NaOH (sodium hydroxide)56, at a high saturation near 200mg/mL.
Both luminol solutions were performed and it was seen that the solubilization with NaOH resulted instantaneously in a limpid solution, which was expected according to the high solubility of luminol in a basic medium. The one where DMSO was employed was turbid at the beginning and therefore ultrasound equipment was used in order to obtain a true solution, which was easily and successfully accomplished, although the overall process required more time.
The solution nature of luminol did not seem to be a major factor of variation between experiments. Despite that, the somewhat increased signal magnitude obtained reinforced the selection of DMSO as adding reagent on the luminol dissolution process. An aliquot helped dissolution and the remaining volume was completed with buffer.
34 On the other hand, ABAP turned out to be extremely soluble in the aqueous medium of the carbonate buffer selected for the experiment. The weak ABAP stability after solubilization led to its preparation for each round of experiments, even if they were performed in the same day.
2.3.4.4. Volumes and concentrations of system components
As already has been pointed out, tests were undertaken in order to achieve successful and reproducible results. An extremely relevant one was the calibration of the component’s volumes and concentrations, of which the following were selected:
Table 4 - Microwell system components.
System Component
Volume (µL) Concentration in
microwell
Sample Standard Blanc
ABAP 20 20 20 80 mM Luminol 20 20 20 5 mM Buffer w/ SS™ 110 110 160 Dilution 1:1000 Sample 50 - - Dilution * 0,25 Standard - 50 - Dilution * 0,25 Total 200 2.3.4.5. Trolox standard
Trolox solutions were employed in order to define standard curves for every round of analyses. This procedure seemed the most appropriate to undertake since the method revealed some variation in the results between the analytic moments. As it is already acknowledged, factors like temperature and humidity control are crucial concerning chemiluminescence methods. All things considered, the most important aspect is the agreement among the final results, after being reported to the corresponding reference inhibitor calibration curve.
35
2.3.4.6. Optimal reaction conditions
A well stablished factor for TRAP reactions with both luminol and ABAP as reagents is the kindly basic pH at which the reaction effectively takes place. A pH value of 8,6 has been used,45 although a few authors have used a pH of 7,4, however with less satisfactory results regarding signal stability and magnitude given the pH dependence of luminol chemiluminescent behaviour44,49. Hence, the experiments undertook were at the selected pH of 8,6.
The temperature influence on the luminescence analysis was widely studied. Tests were made under the 37ºC preconized by Wayner et al.11 and also under 30ºC44. Observing the results obtained, substantially the fact that the reaction occurred very rapidly and in a way that was impossible to accurately distinguish antioxidant capacities that had similar values, the assay was optimized by modifying the temperature to 21ºC for all subsequent test runs as well as Lissi, et al45 had reported. According to the latter, handling the experiments at 21ºC enabled a
low rate of radicals production, hence succeeding in the evaluation of micromolar and submicromolar antioxidant concentrations. Ultimately, the main purpose was to conduct the reaction to be slower and as a result being able to precisely discriminate all the relevant endpoints.
2.3.5. Measurement Conditions
The chemiluminescence measurements were carried out in a particular room in the Faculty of Pharmacy of the Bologna University, more specifically in the building belonging to the Department of Pharmacy and Biotechnology, FaBiT.
Temperature control of the room and of the luminometer were performed. All tests were done at the temperature setting of 21ºC (±0,3ºC). Relative humidity was also considered and maintained under certain conditions (below 60%). Environmental factors seemed to display an important role in the results and thus their maintenance was crucial in order to secure reproducible results.
36 2.3.6. Statistical Analysis
Measured values were processed by mean ± standard deviation of the two microwell samples, as well as standard deviation percentage. Analytical studies were done with wine and teas in triplicate, also expressed in mean ± standard deviation and standard deviation percentage.
37
3. Results and Discussion
3.1.
Characterization of chemiluminescent system
The previous successful optimization of the reaction system led to the attainment of a time profile that can be identified as the luminol luminescence produced when reacting with ABAP-born free radicals.
As it is seen, the signal increases continuously in a proportional manner until it stabilizes and reaches an intensity maximum steady-state plateau, likewise previously reported by others.44
Initially, luminol formed radicals (LH●) increase progressively in the reaction medium as ABAP radicals react with luminol molecules. Since the luminol free radical is the identity responsible for luminescence, this light emission profile clearly demonstrates its gradual accumulation in early moments.
Hereafter, the signal turns stable as a plateau is reached and radical formation most probably faces a luminol saturation point, where LH● will be in equilibrium with the luminol radical anion (L●-). Indeed, a quick analytical pre-experimental procedure corroborated this hypothesis (data not shown): after a test run with the selected chemiluminescence system the signal naturally begun to decrease after a considerable amount of time (between one and two hours) owing to reagent consumption. At this point, a repetition of luminol addition allowed
Figure 11 – Representation of luminol luminescence time profile induced by ABAP decomposition at 21ºC. Light intensity measured in relative units of CPS (counts per second).
38 the signal to shift to the anterior steady state, meaning that luminol is the limiting reagent and that the luminescence plateau is certainly caused by saturation of the luminol radical formation process, at least at these reagent concentrations and reaction conditions.
3.2.
System response in antioxidant presence
The result of antioxidant addition in a radical containing medium is the trapping of said radicals. In a chemiluminescent system this can be viewed by an automatic depression in the signal after antioxidant addition.
Antioxidant addition can trigger either one of the following occurrences: a transient diminution in the luminescence signal than can be related to the addition of a relatively low concentration of antioxidant and therefore its rapid consumption and return to the previous signal; or a phenomenon of total signal suppression that takes place when the antioxidant concentration added is strong enough for all the radical species to be captured, and thus the detection loss in light emission will be recorded (figure 12).
A total suppression in emitted luminescence allows the determination of an induction time τlag. This parameter will be proportionally related to the antioxidant concentration and
scavenging power of the sum of the compounds from a given antioxidant sample.
Figure 12 – Representation of luminol luminescence time profile induced by ABAP decomposition at 21ºC. Antioxidant addition after reaching a stable luminescence signal. Light
39
3.3.
TRAP quantification
In this work the quantification methodology by Denev, et al43 and Číž, et al52 was used to calculate TRAP values, taking advantage of the light inhibition reaction element. Using the lengths of time obtained where no light is recorded by the luminometer (τlag) directly, and
confronting them with the ones the standard records, under the same conditions, the TRAP values for the different samples can be found.
The laboratory equipment, more specifically the luminometer available for the experimental procedures did not consent the automatic insertion of the reaction components in the microwells. The initial microplate preparation and the addition of the antioxidant samples were therefore performed manually.
As a result, to closely reach the true value of τlag for each and every one of the wells a
chronometer was used to verify the time it took to fully fill the microplate and consequently encounter the time difference between the filling of two neighbouring wells. The aim was to critically determine the moment at which the antioxidant was actually introduced in the reaction medium – the moment the reaction does initiate – and thus the triggering of light emission suppression phenomenon begun. This methodology was implemented in order to account for the time gap between the beginning of the reaction (as the sample is added outside the equipment) and the first luminometer reading. This was only possible since the order of sample addition was known and accurately maintained throughout the assays.
Figure 13 - Luminescence Counter VICTOR Light® 1420 (PerkinElmer) with manual sample insertion and visualization of the light emission detection programme running a microplate test.
40
3.4.
Results regarding wine samples
All samples were done in a 96-well microplate considering the volumes and concentrations already discussed in table 4 and whose results are presented hereafter.
Table 5 - Antioxidant results of wine samples.
The results obtained allow to formulate relative and absolute conclusions regarding the antioxidant power presented by the different wine samples tested.
It can be seen that the red wine cultivar of Syrah grapes, a full-bodied wine manufactured by a local and private producer, scored successively and consistently the best results when compared to each one of the other red wine cultivars, corresponding to 1,03355 micromolar Trolox equivalents of antioxidant capacity. The fact that Syrah was stored at smaller temperatures may have had a positive effect on maintaining antioxidant activity since the only wine conserved at 2-8ºC was exactly the one who obtained the better outcomes. Surely, future tests can aid clarifying the nature of temperature consequences on polyphenol content conservation and other aspects as well, such as the organoleptic characteristics that maybe could become altered.
Sangiovese (2015) shared the same traditional winemaking process and region of origin of Syrah (2017), differing in the cultivar year and grape variety. Concerning the antioxidant capacity results, they were slightly lower than the ones Syrah obtained, more specifically
Red Wine Cultivar Day 1 Day 2 Day 3 Media* StDev%**
Syrah 1,06867 0,954829 1,07717 1,03355 5,4
Sangiovese 0,817934 0,728952 0,819834 0,788907 5,4 Cabernet Sauvignon 0,704873 0,697922 0,64786 0,683552 3,7 Cabernet Sauvignon + Merlot 0,528325 0,476673 0,531224 0,512074 4,9 Cascinello 0,434675 0,360459 0,42367 0,406268 8,0
*Results as a media of micromolar Trolox equivalents determined for each wine sample; **StDev% as Standard Deviation Percentage.
41 0,788907 micromolar Trolox equivalents. On one hand, Cassino, et al.37 have reported a depletion process in polyphenol content due to the aging effect which could explain the results regarding antioxidant capacity of these two wines. However, only a future run of experiments in which both Syrah and Sangiovese were to be available in 2015 and 2017 cultivars could clarify how much the antioxidant capacity variations were due to grape cultivar variety or, on the other hand, age related.
Cabernet Sauvignon red wine was the commercial purchased wine that scored the highest antioxidant results of 0,683552 micromolar Trolox equivalents. This wine suffered a particular wine aging process of a year in wood barriques and after in glass bottle. It has also been reported by Brouillard, et al.57 that red wine conservation and maturation involve chemical
and biochemical reactions which alter the polyphenol structures as a young wine transforms, the so called wine aging. But on the contrary to the previous authors, Brouillard, et al. instead connected it to not only the increased organoleptic properties, but also to the modifications and production of new polyphenols related to the health benefits associated for instance with the “French paradox”.
Cascinello, a wine that rises from the mixture of different grape cultivars and varieties that are not always disclaimed and not necessarily the same regarding category and relative quantity, that in addition was purchased in a tetrapak© similar type container, recorded the worst antioxidant results throughout all the test repetitions and pre-experimental work analysis (data not shown), namely 0,406268 micromolar Trolox equivalents. Essentially, Cascinello demonstrates less than half the antioxidant power Syrah wine does. The wine made from Cabernet Sauvignon and Merlot grape cultivars shows an antioxidant capacity value of 0,512074 micromolar Trolox equivalents.
In fact, wine is a big mixed pool of compounds, being only natural that, as time goes by, this meaning months and years, species slowly will transform, as the ones that can be found in grapes and not wine have already did.