Received 12/3/2013 Accepted 11/5/2013
1 Department of Chemistry, State University of Maringá – UEM, Av. Colombo, 5790, CEP 87020-900, Maringá, PR, Brazil, e-mail: oliveirasantos.oscardeoliveira@gmail.com 2 Department of Food Technology, Federal Technology University of Parana – UTFPR, CEP 86036-370, Londrina, PR, Brazil
*Corresponding author
Antioxidant capacity and chemical composition in seeds rich in omega-3:
chia, flax, and perilla
Sheisa Cyléia SARGI1, Beatriz Costa SILVA1, Hevelyse Munise Celestino SANTOS1, Paula Fernandes MONTANHER1,
Joana Schuelter BOEING1, Oscar Oliveira SANTOS JÚNIOR1*, Nilson Evelázio SOUZA2, Jesuí Vergílio VISENTAINER1
1 Introduction
Studies have shown a relationship between a highly nutritious diet, good health, and a reduced risk of chronic diseases (KENDALL et al., 2008). As a result, the investigation of functional foods has gained prominence for promoting beneficial effects to health (ANJO, 2004). Due to the growing interest in nutrition, it has gotten a major boost (NIVA; MÄKELÄ, 2007).
Among functional foods, chia, flax, and perilla are recognized as major vegetal sources of essential omega-3 (n-3) fatty acids, which are important to human health (ASIF, 2011), in addition to various nutrients such as proteins, fibers, and phenolic compounds (GALVÃO et al., 2008).
Chia (Salvia hispanica L., family Labiatae) is native to southern Mexico and northern Guatemala (ÁLVAREZ-CHÁVES et al., 2008). Some seeds are good sources of protein (19-23%), with a higher content than those of other traditional crops such as wheat, corn, rice, oat, barley, and amaranth (COATES; AYERZA, 1996). The chia seed oil-extraction residual meal is a good source of dietary fiber and phenolic compounds with antioxidant capacity (REYES-CAUDILLO; TECANTE; VALDIVIA-LÓPEZ, 2008). Chia seeds contain about 25-38% oil and have the highest known percentage of alpha-linolenic fatty acid (LNA, 18:3n-3), approximately 60% (IXTAINA; NOLASCO; TOMÁS, 2008).
Perilla (Perilla frutescens, family Lamiaceae) is a plant native to Asian countries and is used in cooking and in traditional medicine; however, it remains unknown to western populations (KUROWSKA et al., 2003).Perilla seeds contain approximately 35-45% oil, and it is a good source of polyunsaturated fatty acids (PUFAs), especially LNA (54%-64%). Perilla leaves are used as a source of antioxidants (MENG et al., 2009). Moreover,
perilla is known to have anti-bacterial, anticarcinogenic, antiseptic, antipyretic and anti-asthmatic properties, as well as immunomodulatory action (ŽEKONIS et al., 2008).
Flax (Linum usitatissimum, family Linaceae) is cultivated in more than 50 countries; however, Canada is its major producer (KASOTE; BADHE; HEDGE, 2013; RUBILAR et al., 2010). Nowadays, flax seed plays a major role in the field of diet and disease research because of its benefits to health and disease prevention properties (HERCI et al., 2011). The main component of flax seed is oil (36-40%); Flax seed oil’s major constituent is LNA (57%) (GHULE; JADHAV; BODHANKAR, 2012; KASOTE; BADHE; HEDGE, 2013). Flax seed is an important source of fiber and protein, 30% and 20%, respectively (OMAR et al., 2010) and is rich in phenolic compounds, known as lignans, responsible for its antioxidant activities (RUBILAR et al., 2010). Furthermore, flax seed has been associated with improving the nutritional value by increasing the concentration of omega-3 fatty acids in different animals and foods, fish (TONIAL et al., 2009; AGUIAR et al., 2007), ruminant (RUIZ et al., 2005; DUCATTI et al., 2009), and dairy goat (MATSUSHITA et al., 2007).
There has been a growing interest in the use of chia, perilla, and flax seeds in the diet since these oilseeds have become more popular functional food because of their reported benefits in cardiovascular diseases, cancer, neurological, and hormonal disorders and also for their antioxidant activities. Due to the high intake of these oilseeds and the fact that there are few studies in the literature on their composition and antioxidant capacity, the aim of this study was to characterize the chemical composition, antioxidant capacity, and fatty acid composition of chia, perilla, and flax seeds.
Abstract
The chemical composition and antioxidant capacity of five seeds, chia, golden flax, brown flax, white perilla, and brown perilla, were determined. The chemical properties analyzed included moisture, ash, crude protein, carbohydrates, total lipids, fatty acids, and antioxidant capacity (ABTS•+, DPPH•, and FRAP). The results showed the highest amounts of protein and total lipids in brown and white perilla. Perilla and chia showed higher amounts of alpha-linolenic fatty acid than those of flaxseed varieties, ranging between 531.44 mg g-1 of lipids in brown perilla, 539.07 mg g-1 of lipids in white perilla, and 544.85 mg g-1 of lipis in chia seed. The antioxidant capacity of the seeds, evaluated with ABTS•+, DPPH• , and FRAP methods, showed that brown perilla had greater antioxidant capacity when compared with white perilla, flax, and chia seeds.
Keywords: antioxidant capacity; chia; omega-3; Salvia hispânica; Perilla frutescens; Linum usitatissimum.
2.4 Analysis of antioxidant capacity
In this study, the QUENCHER procedure was used to measure the total antioxidant capacity (TAC) using three well-known assays, ABTS•+, DPPH• and FRAP and an UV-Vis spectrophotometer of Thermo Scientific brand, model Genesys 10uv (SERPEN; GÖKMEN; FOGLIANO, 2012a).
Dilution 1:1 (m/m) of chia, brown and white perilla samples with cellulose was necessary for the FRAP assay. For the ABTS•+ assay, all samples needed to be diluted at 1:1 (m/m), while no dilution was necessary for the DPPH• assay.
Preparation of ABTS•+, DPPH• and FRAP radical solutions The ABTS solution was prepared by adding 5 mL of deionized water to 38.41 mg of ABTS. A potassium persulfate solution was prepared by mixing 5 mL of deionized water with 6.615 mg potassium persulfate. A total of 10 mL of stock solution of ABTS•+ was prepared by reacting 5 mL of each solution described above, which resulted in final concentrations of 7 mmol L-1 ABTS•+ and 2.45 mmol L-1 potassium persulfate. The ABTS•+ stock solution was allowed to stand in the dark at room temperature for 12–16 h before use (RE et al., 1999). The working solution of ABTS•+ was prepared daily by diluting 10 mL of ABTS•+ stock solution with approximately 800 mL of a water/ ethanol (50:50, v/v) mixture. The working solution absorbance was 0.75-0.80 at 734 nm.
The DPPH• stock solution was prepared daily by dissolving 40 mg of DPPH• in 100 mL of ethanol. This ethanolic solution of DPPH• was further diluted with 100 mL of deionized water to obtain a DPPH• stock solution in a methanol/water mixture (50:50, v/v). The DPPH• working solution was prepared by diluting 200 mL of stock DPPH• solution with approximately 800 mL of a water/ethanol (50:50, v/v) mixture (BRAND-WILLIAMS; CUVELIER; BERSET, 1995); its absorbance was 0.75-0.80 at 525 nm.
The FRAP solution was prepared by diluting an aqueous solution of 10 mmol L-1 TPTZ and 20 mmol L-1 ferric chloride in 300 mmol L-1 sodium acetate buffer (pH 3.6) at a ratio of 1:1:10 (v:v:v), as described by Benzie and Strain (1996).
Antioxidant capacity measurement by the QUENCHER procedure
Powdered samples (50 mesh) 10 ± 1.0 mg were weighed in 15-mL centrifuge tubes. Reaction was started by adding 10 mL of either ABTS•+ or DPPH• or FRAP working solutions to the tubes containing the powdered samples. The tubes were shaken rigorously for 60 min on an orbital shaker Fisaton model 752 in the dark at room temperature. After exactly 60 min, the tubes were centrifuged at 9200 g for 2 min in a refrigerated centrifuge of Sanyo harier 18/80 model. Optically clear supernatants were transferred to corvettes and absorbance was measured at 734 nm, 525 nm, and 593 nm for the ABTS•+, DPPH• or FRAP assays, respectively. Standard calibration curves were constructed by plotting percentage quenching against the concentration of Trolox at 734 nm and 525 nm for the ABTS•+ and DPPH• assays, respectively. In the FRAP assay, the calibration curve was constructed by plotting color 2 Materials and methods
2.1 Chemicals
The reagents used were 2,2-diphenyl-1- picrylhydrazyl (DPPH•), 2,2’-azino-bis(3-ethylbenzthiazoline-6-sulphonic acid) (ABTS), 6-hydroxy-2,5,7,8-tetramethyl chroman-2-carboxylic acid (Trolox), cellulose (spruce powder), 2,4,6-tris(2-pyridyl)-s-triazine (TPTZ), and methyl tricosanoate (23:0) from Sigma Chemical. Potassium persulfate from Neon, ferrous sulphate from Vetec, and sodium carbonate from J.T Baker were also used.
2.2 Samples
Chia, brown perilla, white perilla, golden flax, and brown flax seeds were obtained from local producers in southern Brazil. The seeds were triturated (50 mesh), homogenized, and packaged in polypropylene bags and stored at 5 ºC until further analysis.
2.3 Proximate composition and chromatographic analysis
Moisture, ash, and protein contents were determined in accordance with AOAC (ASSOCIATION..., 1998). Total lipids were extracted with the Bligh and Dyer (1959) method.
Fatty acid methyl esters (FAME) were prepared by methylation of total lipids as described by Hartman and Lago (1973). Methyl esters were separated by gas chromatography in Thermo model trace ultra 3300 equipped with flame ionization and cyanopropyl capillary column 100 m x 0.25 i.d., 0.25 µm film thickness, CP-7420 (MARTIN et al., 2008). The gas flow rates used were 1.2 mL min-1 carrier gas (H
2); 30 mL min
-1 make-up gas (N2); 35 and 350 mL min-1 flame gases (H
2 and synthetic air,
respectively). The sample splitting rate was 1:80, and the samples (2 µL) were injected in triplicate. The operation parameters were as follows: detector and injection port temperature 240 °C, column temperature 185 °C for 7.5 minutes, programmed to increase at 4 °C min-1 to 235 °C and kept at this temperature for 1.5 minutes. The peak areas were determined by ChromQuest 5.0 Software. For the fatty acid identification, retention times were compared with those of standard methyl esters.
Quantification (in mg fatty acid g-1 of total lipids) was made against tricosanoic acid methyl ester as an internal standard (23:0), as described by Joseph and Ackman (1992). Theoretical FID (flame ionization detector) correction factor (VISENTAINER, 2012) values were used to obtain fatty acid concentration values. Fatty acid contents were calculated in mg g-1 of total lipids by using Equation 1.
100
X IS X
IS X AE
A W CF
FA
A W CF
= × (1)
No significant difference was observed between the flaxseed varieties (golden and brown) and perilla (white and brown) regarding total lipid content, Peiretti et al. (2011) found lipid contents similar to those found in the present study, 42.10% and 43.00%, respectively. On the other hand, chia seeds had the lowest amount of lipids (21.69%), being statistically different from the other samples (p < 0.05). A study on seed lipids found values of 44.80%, 40.00% and 35.00% for flax, chia, and perilla seeds, respectively(CIFTCI; ROMAN; RUDZINSKA, 2012).
All seeds analyzed contain a high protein value, above 20%. However, brown perilla showed the highest protein content (25.38%) and chia had the lowest content (21.52%). Similar results were found for chia seed proteins by Olivos-Lugo,Valdivia-López and Tecante (2010), 24.60% of the total weight. However, chia seed had the highest carbohydrate fraction (45.30%), differing from the other samples tested (p < 0.05). This is due to the high amount of dietary fiber contained in chia seed (MUÑOZ et al., 2012; VÁZQUEZ-OVANDO et al., 2009). The carbohydrate contents of flaxseed (brown and gold) and perilla (white and brown) varieties were similar, with no significant difference (p < 0.05).
The fatty acid composition of the investigated oilseeds (Table 2) demonstrates that they are excellent sources of alpha-formation at 593 nm against the Trolox concentration. The
antioxidant capacity of the samples determined through the ABTS•+, DPPH• and FRAP assays was calculated in mmol of Trolox equivalent antioxidant capacity (TEAC) per g of sample (SERPEN; GÖKMEN; FOGLIANO, 2012b).
2.5 Statistical analysis
All analyses were carried out in triplicate. The results were submitted to variance (ANOVA) analysis and Tukey’s test at 5% probability using Statistica 5.0 software (STATSOFT, 1995) and to Principal Components Analysis (PCA) using Statistica 7.0 software; data pre-treatment was unnecessary.
3 Results and discussion
3.1 Proximate composition and chromatographic analysis
The proximate compositions of the seeds analyzed are shown in Table 1. All seeds had low moisture content (6.02% to 7.86%), and no significant difference was found among the varieties of flaxseeds (golden and brown). Chia seeds showed the highest moisture and ash contents (7.86 and 3.63%) and were statistically different (p < 0.05) from the other seeds analyzed.
Table 1. Proximate composition (%) of chia, flax, and perilla seedsa.
Component Chia Golden Flax Brown Flax White Perilla Brown Perilla
Moisture 7.86a ± 0.22 6.73b ± 0.03 6.52bc ± 0.04 6.40c ± 0.06 6.02d ± 0.12
Ash 3.63a ± 0.01 2.84c ± 0.01 2.63d ± 0.01 3.33b ± 0.03 3.33b ± 0.02
Total lipids 21.69c ± 0.21 37.57b ± 0.71 38.13b ± 1.39 40.12ab ± 1.75 42.27a ± 1.69
Crude protein 21.52d ± 0.19 23.24c ± 0.06 24.42b ± 0.11 24.18b ± 0.08 25.38a ± 0.10
Carbohydratesb 45.30a ± 0.36 29.61b ± 0.76 28.29bc ± 1.45 25.97cd ± 1.66 23.00d ± 1.54
aValues reported as means ± SD of three replicate analyses (n = 3). Means followed by different letters in the same line are significantly different (p < 0.05) by Tukey’s test. bCarbohydrate
by difference – Nifext (Nitrogen-free extract).
Table 2. Fatty acid composition (mg g-1 total lipids) of chia, flax, and perilla seedsa.
Fatty Acids Chiaa Golden Flaxa Brown Flaxa White Perillaa Brown Perillaa
16:0 58.57bc ± 0.36 41.26d ± 1.09 61.16ab ± 2.78 63.33a ± 0.62 56.97c ± 0.56
18:0 24.98b ± 0.25 26.68b ± 0.91 56.49a ± 2.69 15.59c ± 0.22 13.74c ± 0.08
18:1n-9 61.61e ± 1.08 154.02c ± 3.97 197.76a ± 3.58 115.82d ± 0.91 163.34b ± 0.30
18:1n-7 5.91d ± 0.06 4.75c ± 0.05 6.45d ± 0.16 8.95ª ± 0.09 6.70b ± 0.07
18:2n-6 (LA) 174.73a ± 1.70 140.20b ± 3.81 127.49c ± 1.20 139.04b ± 0.01 98.95d ± 0.13
18:3n-6 1.98a ± 0.09 0.18b ± 0.01 0.17b ± 0.01 2.11a ± 0.37 1.85a ± 0.07
20:0 Nd 1.73a ± 0.03 1.80a ± 0.14 0.97b ± 0.01 Nd
18:3n-3 (LNA) 544.85a ± 6.84 483.49b ± 8.12 396.56c ± 9.44 539.07a ± 0.19 531.44a ± 0.53
20:1n-9 Nd 1.26a ± 0.04 0.99b ± 0.05 1.03b ± 0.04 Nd
SFA 83.55b ± 0.44 71.51c ± 2.08 123.69a ± 5.50 79.89b ± 0.66 70.71c ± 0.57
MUFA 67.52e ± 1.08 160.85c ± 4.04 207.16a ± 3.77 125.80d ± 0.91 170.04b ± 0.31
PUFA 719.58a ± 7.05 624.03c ± 11.45 524.36d ± 10.65 680.22b ± 0.42 632.24c ± 0.55
n-6 176.71a ± 1.70 140.54b ± 3.81 127.80c ± 1.21 141.15b ± 0.37 100.8d ± 0.15
n-3 544.85a ± 6.84 483.49b ± 8.12 396.56c ± 9.44 539.07a ± 0.19 531.44a ± 0.53
n-6/n-3 0.32a ± 0.00 0.25b ± 0.00 0.28a ± 0.00 0.26c ± 0.00 0.19d ± 0.00
aValues reported as means ± SD of three replicate analyses (n = 3). Means followed by different letters in the same line are significantly different (p < 0.05) by Tukey’s test. nd = not
ratio of 1:1 for a healthy balancednutrition (SIMOPOULOS, 2011).
The Institute of Medicine of the National Academies (2005) recommends a daily intake of LNA of 1.6 g/day for men and 1.1 g/day for women. An individual would need to consume approximately 8 g of the perilla seeds (white or brown) or 15 g of the evaluated chia seeds per day to reach the recommended LNA daily intake (Table 2).
3.2 Antioxidant capacity
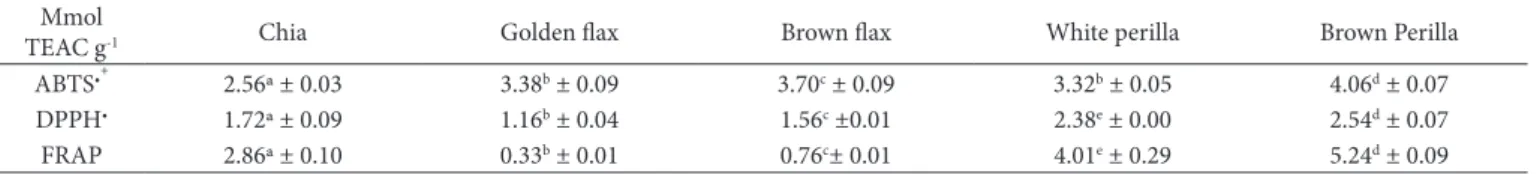
Table 3 shows the TEAC results for the five seeds studied. The DPPH• and FRAP assays of all seeds showed significant differences (p < 0.05). In the DPPH• assay, the highest value was found for brown perilla (2.54 ± 0.07), and the lowest value for the golden flax (1.16 ± 0.04). A similar pattern was found in the FRAP assay, in which brown perilla had the highest (5.24 ± 0.09) and golden flax the lowest (0.33 ± 0.01) values.
For the ABTS•+ assay, the highest value was also found in brown perilla seed (4.06 ± 0.07).
These different assay results found in this study show the importance of using two or more radical scavenging capacity assays to investigate heterogeneous samples since each assay involves different chemical mechanism(s) and may reflect different aspect(s) of the antioxidant properties (SERPEN; GÖKMEN; FOGLIANO, 2012a).
Müller-Waldeck et al. (2010) determined antioxidant capacity of five varieties of Perilla frutescens L. using the ABTS•+ assay. The values ranged from 0.032 to 0.056 mmol TEAC g-1 FW, which are lower than the results found in the present study for white and brown perilla, 3.32 ± 0.05 and 4.06 ± 0.07, respectively. This variation may have been due to the dependence of the sample composition on factors such as climate conditions and geographic location (MEZADRI et al., 2008; VASCO; RUALES; KAMAL-ELDIN, 2008).
A factor that limits the comparison of studies is the extraction procedure used since it is a critical process for some matrices, particularly when there may be insoluble components with antioxidant capacity, which lead to underestimated TEAC values in some cases (SERPEN et al., 2007; SERPEN; GÖKMEN; FOGLIANO, 2012a).
Using the QUENCHER procedure for the ABTS•+ assay, Serpen et al. (2008) determined the antioxidant capacity of some seeds such as rice (0.12 mmol TEAC g-1), wheat (0.04 mmol TEAC g-1), and maize (0.010 mmol TEAC g-1). These results are lower than those found for all seeds in the present study for the ABTS•+ assay.
linolenic acid (LNA, 18:3 n-3). It is the predominant fatty acid in seeds, ranging from 396.56 to 544.85 mg g-1 representing from 46.72% to 62.44% of the total fatty acids in the lipid fraction. Chia and white and brown perilla seeds showed the highest concentrations of LNA, 544.85, 539.07, and 531.44 mg g-1, respectively, with no statistically difference between these groups. In a study on perilla seeds during the growth cycle, the LNA value ranged from 52.00 to 55.50% of the total fatty acids, indicating that the lipid composition of perilla seed depends on the plant maturity stage (PEIRETTI, 2011).
Evaluating the effect of different growing areas on the fatty acid composition of chia seed, Ayerza (2010) obtained LNA contents ranging from 61.06 to 66.75%, which differ from the values found in this study. Differences in fatty acid composition in chia seeds can be attributed to differences in environmental conditions such as temperature, light, soil type, nutrient availability (PEIRETTI; GAI, 2009), location (AYERZA, 2010), and the ecosystem where they are grown (AYERZA; COATES, 2011).
The oilseeds investigated are also good sources of oleic acid (18:1n-9) and linoleic acid LA (18:2n-6). Brown flax and chia seeds showed the most significant amounts of oleic and linolenic acids, 197.76 and 174.73 mg g-1, respectively, differing significantly (p < 0.05) from the other samples.
All seeds evaluated showed high concentrations of polyunsaturated fatty acids (PUFA), with results for brown flax and chia ranging from 524.36 to 719.58 mg g-1, respectively, representing from 60% to 80% of total acids found in the lipid fraction. White perilla and golden flax seeds showed significant difference regarding PUFA concentrations (Table 2).
The n-6/n-3 ratio of the evaluated seeds ranged from 0.19 in brown perilla to 0.32 in chia. These results were similar to those found by Ciftci, Roman and Rudzinska (2012) for chia, perilla, and flax seeds, while Ayerza (2010) found lower rates for chia (from 0.23 to 0.32) than those reported in this study. The ratios obtained for perilla seeds were close to 0.23 (KIM; PARK; CHOUNG, 2007) and 0.25 (ECKERT; FRANKE; NOLDNER, 2010), values found in other studies. Alpha-linolenic acid (omega-3) and linoleic acid (omega-6) are considered strictly essential because they cannot be synthesized in the human body (AGUIAR et al., 2011) and, therefore, must be obtained through the diet. The beneficial health effects of omega-3 fatty acids have been extended to include benefits related to cancer, inflammatory bowel disease, rheumatoid arthritis, psoriasis, and mental health (SIMOPOULOS, 2011), with also a positive effect in the treatment of depression and schizophrenia(PEET; STOKES, 2005; SCHRAM et al., 2007). The n-6/n-3 ratios obtained for all seeds were consistent with the recommended
Table 3. Antioxidant capacity (ABTS•+, DPPH• and FRAP) of chia, flax, and perilla seedsa.
Mmol
TEAC g-1 Chia Golden flax Brown flax White perilla Brown Perilla
ABTS•+ 2.56ª ± 0.03 3.38b ± 0.09 3.70c ± 0.09 3.32b ± 0.05 4.06d ± 0.07
DPPH• 1.72ª ± 0.09 1.16b ± 0.04 1.56c ±0.01 2.38e ± 0.00 2.54d ± 0.07
FRAP 2.86ª ± 0.10 0.33b ± 0.01 0.76c± 0.01 4.01e ± 0.29 5.24d ± 0.09
aValues reported as means ± SD of three replicate analyses (n = 3). TEAC = Trolox equivalent antioxidant capacity. Means followed by different letters in the same line are significantly
score plot of PC1xPC2 (c) and PC1xPC3 (d)) of fatty acids for seed samples. Analyzing Figures 1c and 1d, it can be observed that six groups were formed. In Figure 1c, the groups formed were brown flax (B Flax (1)); brown perilla, golden flax, and white perilla (B Perilla, G Flax and W Perilla, respectively (2)); Chia (3); and in Figure 1d, B Flax (4); B Perilla, W Perilla, and Chia (5); G Flax (6). Analyzing Figures 1a and 1c, it can be seen that the variable responsible for the formation of group 1 was MUFA, with the highest value; for group 2, it was the n-3 and LNA sums, with intermediate values; for group 3, it was LA, showing higher levels of this fatty acid. The correlation between Figures 1b and 1d shows that the variable SFA contributed to group 4, with a lower content; for group 5, it was the LNA and n-3 sums, which had the greatest amounts; and group 6 had the highest LA content.
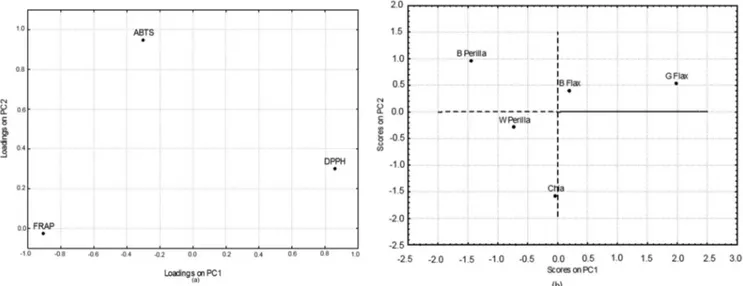
In the antioxidant analyses, two selected components explained about 87.83% of the total variance, PC1 (54.88%), and PC2 (32.94%). Variable FRAP had a high contribution to PC1, with 0.4951 (Table 4). PC2 loadings indicate that it had high contributions from ABTS•+ (0.9080).
Figure 2 shows PCA results (loadings (a) and scores (b)) of the antioxidant analyses of the seed samples. According to Figure 2b, we can observe that five groups were formed, one for each seed type. Variable DPPH• was responsible for the separation of G Flax with a value lower than B Flax, which
3.3 PCA analysis
The data matrix of the variables analyzed was performed for two fatty acids, LNA and LA; five sum values, SFA, MUFA, PUFA, omega-6, and omega-3 (Table 4); and three antioxidant assays (Table 5) for five seeds. Principal Components Analysis (PCA) was applied in order to reduce the number of descriptors associated with the data set, which explains the maximum amount of variability of the data. The PCA was applied because oilseeds are a very complex mixture (WU; RODGERS; MARSHALL, 2004).
Tables 4 and 5 show that the eigenvalues and more than 85% of the variance in the original data set are explained by both analyses. Thus, three components were retained for the principal component analysis of fatty acid and two for antioxidant analysis.
The first component (PC1) for fatty acids and sums explained 74.63% of the data set total variance; the loadings indicated high contributions from LNA (0.1813) (Table 4), n-3 (0.1824), and PUFA (0.1824). The second component (PC2) explained 21.92% of the total variance, and the third component (PC3) explained 3.36%. LA (0.5200) had a positive contribution to PC2 and SFA (0.3394) to PC3. The total data set variance for fatty acid analysis was 99.91%.
Figure 1 shows the principal component analysis results (loadings PC1xPC2 (a), PC1xPC3 (b and PC1xPC3 (b) and
Table 4. Eigen analysis of the correlation matrix loadings of the significant principal components (PCs) for fatty acids.
PC1 PC2 PC3
Eigenvalue 5.224383 1.534058 0.235437
% Total Variance 74.63405 21.91512 3.36338
% Cumulative 74.6340 96.5492 99.9125
LA 0.028072 0.520006 0.233389
LNA 0.182422a 0.010126 0.132902
SFA 0.134369 0.141742 0.339369
MUFA 0.136629 0.180576 0.023779
PUFA 0.181354 0.030679 0.020376
n-6 0.154733 0.106744 0.117283
n-3 0.182422 0.010126 0.132902
aThe most significant loadings are in bold. LA = linoleic acid, LNA = alpha-linolenic acid, SFA = total saturated fatty acids, MUFA = total monounsaturated fatty acids, PUFA = total
polyunsaturated fatty acids, n-6 = total omega-6, n-3 = total omega-3 fatty acids.
Table 5. Eigenanalysis of the correlation matrix loadings of the significant principal components (PCs) for antioxidant analyses.
PC1 PC2 PC3
Eigenvalue 1.646503 0.988265 0.365231
% Total Variance 54.88345 32.94218 12.17438
% Cumulative 54.8834 87.8256 100.0000
ABTS•+ 0.053889 0.908011 0.038100
DPPH• 0.451018 0.091315 0.457667
FRAP 0.495093a 0.000674 0.504233
Figure 1. Loading plot of PC1xPC2 (a) and PC1xPC3 (b) and score plot of PC1xPC2 (c) and PC1xPC3 (d) for fatty acids in chia, brown flax (Flax B), golden flax (Flax G), and white perilla (Perilla W) and brown perilla (Perilla B) seeds.
Analytical Biochemistry, v. 239, p. 70-76, 1996. PMid:8660627. http://dx.doi.org/10.1006/abio.1996.0292
BLIGH, E. G.; DYER, W. J. A rapid method of total lipid extraction and purification. Canadian Biochemistry Physiology, v. 37, p. 911-917, 1959. http://dx.doi.org/10.1139/o59-099
BRAND-WILLIAMS, W.; CUVELIER, M. E.; BERSET, C. Use of a free radical method to evaluate antioxidant activity. LWT - Food Science and Technology, v. 28, p. 25-30, 1995.
CIFTCI, O. N.; ROMAN, P.; RUDZINSKA, M. Lipid components of flax, perilla, and chia seeds. European Journal of Lipid Science and Technology, v. 114, p. 794-800, 2012. http://dx.doi.org/10.1002/ ejlt.201100207
COATES, W.; AYERZA, R. Production potential of chia in Northwestern Argentina. Industrial Crops and Products, v. 5, p. 229-233, 1996. http://dx.doi.org/10.1016/0926-6690(96)89454-4
DUCATTI, T. et al. Chemical Composition and Fatty Acid Profile in Crossbred (Bos taurus vs. Bos indicus) Young Bulls Finished in a
Feedlot. Asian-Australasian Journal of Animal Sciences, v. 22,
p. 433-439, 2009.
ECKERT, G. P.; FRANKE, C.; NOLDNER, M. Plant derived omega-3-fatty acids protect mitochondrial function in the brain. Pharmacological Research, v. 61, p. 234-241, 2010. PMid:20079842. http://dx.doi.org/10.1016/j.phrs.2010.01.005
GALVÃO, E. L. et al. Avaliação do potencial antioxidante e extração subcrítica do óleo de linhaça. Ciência e Tecnologia de Alimentos, v. 28, p. 551-557, 2008. http://dx.doi.org/10.1590/S0101-20612008000300008
GHULE, A. E.; JADHAV, S. S.; BODHANKAR, S. L. Effect of ethanolic
extract of seeds of Linum usitatissimum (Linn.) in hyperglicaemia
associated ROS production in PBMNCs and pancreatic tissue of alloxan induced diabetic rats. Asian Pacific Journal of Tropical Biomedicine, p. 405-410, 2012.
HARTMAN, L.; LAGO, R. C. A. Rapid determination of fatty acid methyl esthers from lipids. Laboratory Practice, v. 22, p. 475-477, 1973. PMid:4727126.
HERCI, W. et al. Determination of phenolic and other polar compounds in flaxseed oil using liquid chromatography coupled with time-of-flight mass spectrometry. Food Chemistry, v. 126, p. 332-338, 2011. http://dx.doi.org/10.1016/j.foodchem.2010.10.070
INSTITUTE OF MEDICINE. Dietary Reference Intakes for Energy, Carbohydrate, Fiber, Fat, Fatty Acids, Cholesterol, Protein, and Amino Acids (Macronutrients). Washington: National Academy Press, 2005.
IXTAINA, Y. V.; NOLASCO, S. M.; TOMÁS, M. C. Physical
properties of chia (Salvia Hispanica L.) seeds. Industrial Crops
and Product, v. 28, p. 286-293, 2008. http://dx.doi.org/10.1016/j. indcrop.2008.03.009
JOSEPH, J. D.; ACKMAN, R. G. Capillary column gas-chromatographic method for analysis of encapsulated fish oils and fish oil ethyl-esters - Collaborative study. Journal of AOAC International, v. 75, p. 488-506, 1992.
KASOTE, D. M.; BADHE, Y. S.; HEDGE, M. V. Effect of mechanical press oil extraction processing on quality of linseed oil. Industrial Crops and Products, v. 42, p. 10-13, 2013. http://dx.doi. org/10.1016/j.indcrop.2012.05.015
KENDALL, M. et al. Nutritional methodologies and their use in inter-disciplinary antioxidant research. Food Chemistry, v. 108, p. 425-438, 2008. http://dx.doi.org/10.1016/j.foodchem.2007.10.076 KIM, K. S.; PARK S. H.; CHOUNG, M. G. Nondestructive
determination of oil content and fatty acid composition in perilla seeds by near-infrared spectroscopy. Journal of Agricultural and Food Chemistry, v. 55, p. 1679-1685, 2007. http://dx.doi. org/10.1021/jf0631070
presented low values for DPPH• but high values for ABTS•+. B Perilla had the highest values for ABTS•+ and FRAP, followed by W perilla. Chia showed intermediate values in all analyses.
4 Conclusion
This study revealed that the seeds evaluated, chia, golden flax, brown flax, white perilla, and brown perilla are excellent sources of alpha-linolenic acid (LNA), which is a precursor of long chain PUFA metabolically synthesized in the human body. These seeds can be used in natura as flours and/or oils to enrich food products with LNA and thus change the n-6-to- n-3 ratio in the diet. Among the flax and perilla species, the gold and white species had higher levels of omega-3 and -6, while both brown flax and perilla seeds showed higher antioxidant capacity and chia showed a higher content of fatty acids and intermediate antioxidant capacity. The PCA showed that the eigenanalysis of the correlation matrix loadings of the three and two significant PCs for fatty acids and antioxidant capacity, respectively, explained more than 85% of data variation in both analyses.
Acknowledgements
This study was supported by Coordenadoria de Aperfeiçoamento de Pessoal de Nível Superior (CAPES).
References
AGUIAR, A. C. et al. Effect of flaxseed oil in diet on fatty acid composition in the liver of Nile Tilapia (Oreochromis niloticus). Archivos Latinoamericanos de Nutrición, v. 57, p. 273-277, 2007. Pmid:18271406.
AGUIAR, A. C. et al. Quantification of essential fatty acids in the heads
of nile tilapia (Oreochromis niloticus) fed with linseed oil. Journal
of the Brazilian Chemical Society, v. 22, p. 643-647, 2011. http:// dx.doi.org/10.1590/S0103-50532011000400005
ÁLVAREZ-CHÁVEZ, L. M. et al. Chemical characterization of the lipid
faction of Mexican chia seed (Salvia hispânica L.). International
Journal of Food Properties, v. 11, p. 687-697, 2008. http://dx.doi. org/10.1080/10942910701622656
ANJO, D. F. C. Alimentos funcionais em angiologia e cirurgia vascular. Jornal Vascular Brasileiro, v. 2, p. 145-154, 2004.
ASIF, M. Health effects of omega-3, 6, 9 fatty acids: Perilla frutescens
is a good example of plant oils. Oriental Pharmacy and Experimental Medicine, v. 11, p. 51-59, 2011. PMid:21909287 PMCid:PMC3167467. http://dx.doi.org/10.1007/s13596-011-0002-x
ASSOCIATION OF OFFICIAL ANALYTICAL CHEMISTS - AOAC. Official methods of analysis of AOAC international. 16 th ed. AOAC; 1998.
AYERZA, R. Effects of seed color and growing locations on fatty
acid content and composition of two chia (Salvia hispanica L.)
genotypes. Journal of the American Oil Chemists Society, v. 87, p. 1161-1165, 2010. http://dx.doi.org/10.1007/s11746-010-1597-7 AYERZA, R.; COATES, W. Protein content, oil content and fatty acid
profiles as potential criteria to determine the origin of commercially
grown chia (Salvia hispanica L.). Industrial Crops and Products,
v. 34, n. 2, p. 1366-1371, 2011. http://dx.doi.org/10.1016/j. indcrop.2010.12.007
REYES-CAUDILLO, E.; TECANTE, A.; VALDIVIA-LÓPEZ, M. A. Dietary fibre content and antioxidant activity of phenolic
compounds present in Mexican chia (Salvia hispanica L.)
seeds. Food Chemistry, v. 107, p. 656-663, 2008. http://dx.doi.
org/10.1016/j.foodchem.2007.08.062
RUBILAR, M. et al. Flaxseed as a source of functional ingredients. Journal of Soil Science and Plant Nutrition, v. 10, p. 373-377, 2010. http://dx.doi.org/10.4067/S0718-95162010000100010
RUIZ, M. R. et al. Proximate chemical composition and fatty acid profiles of Longissimus thoracis from pasture fed LHRH immunocastrated, castrated and intact Bos indicus bulls. South African Journal of Animal Science, v. 35, p. 13-18, 2005. SCHRAM, L. B. et al. Food matrices affect the bioavailability of (n-3)
polyunsaturated fatty acids in a single meal study in humans. Food Research International, v. 40, p. 1062-1068, 2007. http://dx.doi. org/10.1016/j.foodres.2007.06.005
SERPEN, A. et al. A New Procedure To Measure the Antioxidant Capacity of Insoluble Food Components. Journal Agriculture and Food Chemistry, v. 55, p. 7676-7681, 2007. PMid:17708649. http:// dx.doi.org/10.1021/jf071291z
SERPEN, A.; GÖKMEN, V.; FOGLIANO, V. Solvent effects on total antioxidant capacity of foods measured by direct QUENCHER
procedure. Journal of Food Composition and Analysis, v. 26,
p. 52-57, 2012a. http://dx.doi.org/10.1016/j.jfca.2012.02.005 SERPEN, A.; GÖKMEN, V.; FOGLIANO, V. Total antioxidant capacities
of raw and cooked meats. Meat Science, v. 90, p. 60-65, 2012b. PMid:21684086. http://dx.doi.org/10.1016/j.meatsci.2011.05.027 SERPEN, A. et al. Direct measurement of the total antioxidant
capacity of cereal products. Journal of Cereal Science, v. 48, p. 816-820, 2008. http://dx.doi.org/10.1016/j.jcs.2008.06.002 SIMOPOULOS, A. P. Evolutionary aspects of diet: the omega-6/
omega-3 ratio and the brain. Molecular Neurobiology, v. 44, p. 203-215, 2011. PMid:21279554. http://dx.doi.org/10.1007/ s12035-010-8162-0
TONIAL, I. B. et al. Optimization of flaxseed oil feeding time length
in adult Nile tilapia (Oreochromis niloticus) as a function of
muscle omega-3 fatty acids composition. Aquaculture Nutrition, v. 15, p. 564-568, 2009. http://dx.doi.org/10.1111/j.1365-2095.2008.00623.x
VASCO, C.; RUALES, J.; KAMAL-ELDIN, A. Total phenolic compounds and antioxidant capacities of major fruits from Ecuador. Food Chemistry, v. 111, p. 816-823, 2008. http://dx.doi. org/10.1016/j.foodchem.2008.04.054
VÁZQUEZ-OVANDO, A. et al. Physicochemical properties of a fibrous
fraction from chia (Salvia hispanica L.), LWT. Food Science and
Technology, v. 42, p. 168-173, 2009.
VISENTAINER, J. V. Aspectos analíticos da resposta do detector de ionização em chama para ésteres de ácidos graxos em biodisel e alimentos. Química Nova, v. 35, p. 274-279, 2012. http://dx.doi. org/10.1590/S0100-40422012000200008
WU, Z. G.; RODGERS, R. P.; MARSHALL, A. G. Characterization of vegetable oils: Detailed compositional fingerprints derived from electrospray ionization Fourier transform ion cyclotron
resonance mass spectrometry. Journal of Agricultural and Food
Chemistry, v. 52, p. 5322-5328, 2004. PMid:15315364. http://dx.doi. org/10.1021/jf049596q
ŽEKONIS, G. et al. Effect of Perilla frutescens aqueous extract on free
radical production by human neutrophil leukocytes. Medicina Kaunas, v. 44, p. 699-705, 2008.
KUROWSKA, E. M. et al. Bioavailability of omega-3essential fatty acidsfrom perilla seed oil. Prostaglandins, Leukotrienes and Essential Fatty Acids, v. 68, p. 207-212, 2003. http://dx.doi. org/10.1016/S0952-3278(02)00271-5
MARTIN, C. A. et al. Optimization of the selectivity of a cyanopropyl stationary phase for the gas chromatographic analysis of trans fatty acids. Journal of Chromatographi A, v. 1194, p. 111-117, 2008. PMid:18468609. http://dx.doi.org/10.1016/j.chroma.2008.04.033 MATSUSHITA, M. et al. Fatty acid profile of milk from Saanen goats
fed a diet enriched with three vegetable oils. Small Ruminant Research, v. 72, p. 127-132, 2007. http://dx.doi.org/10.1016/j. smallrumres.2006.09.003
MENG, L. et al. Antioxidant activities of polyphenols extracted from Perilla frutescens Varieties. Molecules, v. 14, p. 133-140, 2009. PMid:19127243. http://dx.doi.org/10.3390/molecules14010133 MEZADRI, T. et al. Antioxidant compounds and antioxidant activity in
acerola (Malpighia emarginata DC.) fruits and derivatives. Journal
of Food Composition and Analysis, v. 21, p. 282-290, 2008. http:// dx.doi.org/10.1016/j.jfca.2008.02.002
MÜLLER-WALDECK, F. et al. Determination of toxic perilla ketone, secondary plant metabolites and antioxidative capacity in fivePerilla frutescens L. varieties. Food and Chemical Toxicology, v. 48, p. 264-270, 2010. PMid:19833165. http://dx.doi.org/10.1016/j. fct.2009.10.009
MUÑOZ, L. A. et al. Chia seeds: Microstructure, mucilage extraction and hydration. Journal of Food Engineering, v. 108, p. 216-224, 2012. http://dx.doi.org/10.1016/j.jfoodeng.2011.06.037 NIVA, M.; MÄKELÄ, J. Sócio-demografics, health efforts, notions
of technology and acceptability of health-promoting foods. International Journal of Consumer Studies, v. 31, p. 34-45, 2007. http://dx.doi.org/10.1111/j.1470-6431.2005.00482.x
OLIVOS-LUGO, B. L.; VALDIVIA-LÓPEZ, M. A.; TECANTE, A. Thermal and physicochemical properties and nutritional value
of the protein fraction of Mexican chia seed (Salvia hispanica L.).
Food Science and Technology International, v. 16, p. 89-96, 2010. PMid:21339125. http://dx.doi.org/10.1177/1082013209353087 OMAR, K. A. et al. Stabilizing flaxseed oil with individual antioxidants
and their mixture. European Journal of Lipid Science and Technology, v. 112, p. 1003-1011, 2010. http://dx.doi.org/10.1002/ ejlt.200900264
PEET, M.; STOKES, C. Omega-3 fatty acids in the treatment of psychiatric disorders. Drugs, v. 65, p. 1051-1059, 2005. PMid:15907142. http://dx.doi.org/10.2165/00003495-200565080-00002
PEIRETTI, P. G. Fatty acid content and chemical composition of
vegetative parts of perilla (Perilla frutescens L.) after different growth
lengths. Research Journal of Medicinal Plant, v. 5, p. 72-78, 2011. http://dx.doi.org/10.3923/rjmp.2011.72.78
PEIRETTI, P. G.; GAI, F. Fatty acid and nutritive quality of chia (Salvia
hispanica L.) seeds and plant during growth. Animal Feed Science and Technology, v. 148, 267-275, 2009. http://dx.doi.org/10.1016/j. anifeedsci.2008.04.006
PEIRETTI, P. G. et al. Effects of perilla (Perilla frutescens L.) seeds
supplementation on performance, carcass characteristics, meat quality and fatty acid composition of rabbits. Livestock Science, v. 138, p. 118-124, 2011. http://dx.doi.org/10.1016/j. livsci.2010.12.007