Página | 29
https://periodicos.utfpr.edu.br/rebrapa
Physicochemical characterization of
shortenings recommended for application
in cookie filling
ABSTRACT Thais Lomonaco Teodoro da Silva
http://orcid.org/0000-0001-8675-4759
Department of Food Technology, Faculty of Food Engineering, University of Campinas, Campinas, São Paulo, Brazil.
Gabriel Deschamps Fernandes [email protected]
http://orcid.org/0000-0001-6099-3225
Department of Food Technology, Faculty of Food Engineering, University of Campinas, Campinas, São Paulo, Brazil.
Lisandro Pavie Cardoso [email protected]
http://orcid.org/0000-0003-3910-2293
Department of Applied Physics, Physics Institute, University of Campinas, Campinas, São Paulo, Brazil.
Daniel Barrera Arellano [email protected]
http://orcid.org/0000-0002-8217-8392
Department of Food Technology, Faculty of Food Engineering University of Campinas, Campinas, São Paulo, Brazil.
Shortening is the commercial name given to a continuous-phase fat used in fried foods,
baked goods, fillings, and other. This study aimed to evaluate commercial shortenings for cookie filling, assessing how these samples are composed in face of the new nutritional changes in the area and attempting to devise a technological profile of these fats for a further development of zero trans and low saturated bases. Six samples of shortenings for filling were evaluated regarding their composition in fatty acids, solid fat content, melting point, crystallization isotherms, thermal behavior, texture, and polymorphism. We observed there are still samples with high trans fat content in the market, but there are also samples low on these fatty acids; however, a direct exchange for saturated fatty acids (mainly palmitic acid) was verified. Shortenings for cookie filling should both have a palmitic acid content ~40%; SFC between 15-25% at process temperature; melting range between 35-55°C, with melting point from 42 to 46°C; average crystalline diameter of spherulite crystals between 12-15µm; Beta-polymorphic, and consistency and adhesion between 4000-1000 gF/cm² and 70-20 gF.s, respectively.
Página | 30
INTRODUCTION
Lipids, generally speaking, are a group of compounds that include oils and fats. The basic difference between oils and fats is their physical state at room temperature, which is a consequence of their chemical composition. Oils are liquid at room temperature, whereas fats are solid (PATEL et al., 2016).
Oils and fats and primarily composed of triacylglycerols (TAG), approximately 98%, but also include minority components, such as diacylglycerols (DAG), monoacylglycerols (MAG), free fatty acids, phospholipids, glycolipids, phytosterols, among others (METIN; HARTEL, 2005). These TAG are formed by fatty acids esterified in the glycerol molecule. Fatty acids normally contain from 4 to 24 carbons in their chain and can be either unsaturated in the cis or trans configuration or saturated (SCRIMGEOUR, 2005).
From a dietary and nutritional point of view, edible oils and fats are essential nutrients in human diet, as energy supply and essential fatty acids. They are an important source of energy for the body, providing 9 kcal/gram, which corresponds to double the energy provided by carbohydrates or proteins (4 kcal/gram). In addition to nutritional qualities, oils and fats convey consistency and specific melting characteristics to products in which they are included, besides acting as a heat transfer medium during the frying process and as carriers of fat-soluble vitamins and aroma. Hence, lipids may alter the structure, stability, flavor, aroma, storage quality, and sensory and visual characteristics of the food (O´BRIEN, 2005).
However, a proper energy balance (consumption versus expenditure) must be found, especially dealing with fats, as their excessive consumption may increase the risk of cardiovascular disease, as well as the gain of weight (WILLIAMS; SALTER, 2016).
Shortening is the commercial name given to a continuous-phase fat used in fried foods, baked goods, fillings, and other confectionery products. It received this name because when the dough is mixed with a fat for being insoluble in water, it prevents the cohesion of gluten networks, literally “shortening” them and generating a good dough. Usually, the shortening is composed of vegetable fats through hydrogenation or chemical interesterification processes. Its composition will be crucial to achieve texture and palatability in the products to which it will be inserted (METZROTH, 2005; NARINE; HUMPHREY, 2004).
Due to the origin processes of vegetable shortenings, they are mainly formed by saturated fatty acids (SFA) and trans fatty acids (TFA). From the industrial standpoint, TFA are attractive due to their oxidative stability, long lifespan, and their semi-solid texture that conveys taste and structure to lipid-based products (KLONOFF, 2007). However, from the nutritional point of view, TFA affect blood cholesterol levels and multiply the risks of cardiovascular health problems. More specifically, studies on controlled dietary intervention showed that TFA increase LDL (low-density lipoprotein) cholesterol and decrease HDL (high-density lipoprotein), interfering with the balance of the HDL/LDL cholesterol ratio in the blood, which may increase the risks of cardiovascular disease and other inflammatory processes (MOZAFFARIAN et al., 2006).
With the healthfulness trends, many industries have replaced TFA; however, to achieve the same technological and oxidative functionality, the most viable option is the direct exchange for SFA (ECKEL; PAST; BORRA, 2007). SFA are usually
Página | 31
solid at room temperature and naturally found in animal fats, palm oil, coconut oil, and cocoa butter (KLONOFF, 2007). However, the consumption of SFA is also directly related to the imbalance of blood cholesterol levels and increased risk of cardiovascular diseases (SPOSITO et al., 2007).
Based on the concept of health and lifestyle, the Dietary Guidelines recommended moderation in the intake of total fats, replacing saturated fats for mono- and poly-unsaturated fats as much as possible and removing trans fats from the diet (FAO, 2010). In 2015, the Food and Drug Administration (FDA) removed partially hydrogenated oils from the list of foods Generally Recognized as Safe (GRAS) for consumption, thus they cannot be added to foods, and the industry had until June 2018 to adjust (FDA, 2015). With the changes occurred in the United States of America, it is only a matter of time until other countries adhere with the new nutritional guidelines and legislation.
Based on current changes, this study aimed to evaluate the Brazilian market of fats for fillings and verify the chemical composition and physical properties necessary for the technological application of this product, so that further nutritional changes have the technological profile needed to conform with it, facilitating future changes.
MATERIALS AND METHODS MATERIAL
Six different shortenings for cookie filling were obtained from three different manufacturers.
FATTY ACIDS COMPOSITION
The fatty acids composition of the fats extracted was determined in a capillary column gas chromatography, CGC Agilent 6850 Series GC System (EUA), after esterification using the Hartman and Lago method (1973). Methyl esters of fatty acids were separated according to the AOCS Ce 2-66 method (AOCS, 2009) in a DB, 23 Agilent (USA) column (50% cyanopropylmethylpolysiloxane), length: 60 m; internal diameter: 0.25 mm; film thickness: 0.25 μm. Analysis conditions: 110°C oven temperature – 5 min, 110°C – 215°C (5°C/min), 215°C – 24 min; detector temperature: 280°C; injector temperature: 250°C; carrier gas: helium; split ratio 1:50; injected volume: 1.0 μL. The qualitative composition was determined by comparing the retention times of the peaks with those of the respective fatty acid patterns. Qualitative composition was determined by the area percentage of each fatty acid.
SOLID FAT CONTENT
Solid fat content was determined through a Nuclear Magnetic Resonance Spectrometer (NMR) Bruker pc120 Minispec, attached to dry baths with a temperature ranging from 0°C to 70°C, Tcon 2000 (Duratech, USA). The AOCS Cd 16b- 93 method was used: direct method with reading of samples in series at temperatures 10; 15; 20; 25; 30; 35; 37,5; 40; 45; 50°C, with tempering for non-stabilized fats (AOCS, 2009). The determination was performed in triplicate. The
Página | 32
melting point was determined by calculating the temperature corresponding to the 4% solid content obtained in the polynomial equation adjusted to the solids curve assessed by NMR (KARABULUT; TURAN; ERGIN, 2004).
CRYSTALLIZATION ISOTHERMS
Samples were melted and kept in a Tcon 2000 dry bath (Duratech, USA) at 70°C for the complete destruction of their crystalline history. The increase in solid fat content according to the crystallization time was monitored by a Nuclear Magnetic Resonance Spectrometer (NMR) Bruker pc120 Minispec, with the reading compartment stabilized at 25°C. Data acquisition is automatic, with measures taken at every minute for 90 minutes. The determination was performed in triplicate. The characterization of crystallization kinetics was performed according to the induction period (tSFC) and maximum solids content (SFCmax). The
original Avrami equation was used in the crystallization study. It was also applied to the results obtained to determine k and n values according to Equation 1 (CAMPOS, 2005).
𝑆𝐹𝐶 = 𝑆𝐹𝐶𝑚𝑎𝑥(1 − 𝑒−𝑘𝑡𝑛) Equation 1
Where: SFC (t) describes the solid fat content (%) as a function of time; SFC (max) is the limit content of solid fat with time tending to infinity; k is the Avrami constant (min-n), which considers both the nucleation and the growth of crystals,
and n is the Avrami exponent, indicating the crystal growth mechanism.
The half crystallization time t1/2 expresses the magnitude of k and n values
according to Equation 2. 𝑡1/2= ( 0.693 𝑘 ) 1/𝑛 Equation 2 MICROSTRUCTURE
Microstructure (morphology and crystalline dimensions) of the selected samples was evaluated by polarized light microscopy. The samples were melted at 100°C. With the aid of a capillary tube, a drop of sample was placed on a pre-heated glass slide (at a temperature similar to that used for melting the crystals) and enclosed with a cover slip. Crystals morphology was evaluated with a polarized light microscope (Olympus, BX51 model, Center Valley, PA, USA) attached to a digital video camera (Media Cybernetics, Center Valley, PA, USA), using polarized light and 20X magnification. Slides were evaluated after 48h crystallization, 24h at 5°C and 24h at 25°C. Images were analyzed by the software Image Pro-Plus (Media Cybernetics, USA). For each slide, one for each sample, five visual fields were focused, which were assessed in crystalline dimensions. The evaluation parameters selected for the quantitative analysis were the mean diameter of the crystals (Dm) and percentage of crystallized area (Ac) (SILVA et al., 2017).
Página | 33
THERMAL BEHAVIOR
The thermal analysis of the samples was carried out by differential scanning calorimetry (DSC) in a calorimeter (Q2000 model, TA Instruments, New Castle, DE, USA), using the indium (TA instruments) as standard for calibration. Approximately 10 mg of sample was added in airtight aluminum cookware. The analysis was performed according to the AOCS Cj 1-94 method (AOCS, 2009). The analysis conditions were: 1. Crystallization event: Balance at 80°C (10 min) followed by a cooling pad 2°C/min up to -60°C; 2. Melting event: first, the samples were stabilized for 48 hours (24h at 5°C and 24h at 25°C) and, subsequently, the melting process was initiated with a balance at -40°C (10 min); followed by a heating pad 5°C/min at 80°C. The following parameters were used to evaluate the results: crystallization onset temperature (Toc), maximum
crystallization temperature (Tpc), final crystallization temperature (Tfc), crystallization
enthalpy (ΔHc); following the same parameters for the melting process: melting onset
temperature (Tof), maximum melting peak temperature (Tpf), final melting
temperature (Tff), and melting enthalpy (ΔHf). The analysis was performed in triplicate.
CONSISTENCY
The yield value (YV) was determined using the TAXT Plus texture analyzer equipment (TA-XT2, Stable Micro Systems Ltd., Surrey, UK), controlled by microcomputer. Samples were heated at 70°C for the complete melting of crystals and stored in 50-ml beakers. The samples were also conditioned for 48 hours, being 24 hours at 5°C and 24 hours at 25°C, and readings were made at 25°C. Measurements were performed in quadruplicate, for each sample, in the following conditions: 10 mm initial distance, speed of 2 mm/s; time of 5 s (RODRIGUES; GIOIELLI; ANTON, 2003). Based on these conditions, the compression strength was obtained in (gF). Penetration data were converted into yield value (HAIGHTON, 1959) (Equation 3).
𝑌𝑉 =
𝐾 × 𝑊
𝑝
1,6 Equation 3Where: C = consistency, in gf/cm2; K = factor depending on the angle of the cone
used, in this study it was 45°, K = 4700; W = compression strength (gF); p = penetration depth in 0.1 mm.
POLYMORPHISM
For the polymorphism analysis, the samples were stabilized for 48 hours, 24 hours at 5°C and 24 hours at 25°C. The polymorphic form of the fat crystals of samples was determined by X-Ray Diffraction, following the AOCS Cj 2-95 method (AOCS, 2009). Analyses were performed on a Philips diffractometer (PW 1710, Almelo, Netherlands), using Bragg-Brentano geometry (θ:2θ) with Cu-kα radiation (λ = 1,5418Å, voltage of 40 KV and 30 mA current). Measures were obtained with 0.03° steps in 2θ and acquisition time of 2 seconds, with scans from 15 to 30° (2θ scale). The identification of polymorphic forms was carried out from the observation of characteristic X-Ray diffractograms (intensity versus 2θ) of each sample (SCHENK; PESCHAR, 2004; YAP; MAN; MAN, 1989).
Página | 34
STATISTICAL ANALYSIS
Results of this study were quantitatively and qualitatively evaluated and compared with the effects tested through the literature values and statistically, when obtained in a number greater than or equal to three repetitions. Statistical analyses were conducted by the STATISTICA software, version 8 (StatSoft Inc., USA), using the ANOVA test (one-way analysis of variance) and the Tukey test for comparison of averages, with a significance level of 5% (p < 0.05).
RESULTS AND DISCUSSION FATTY ACIDS COMPOSITION
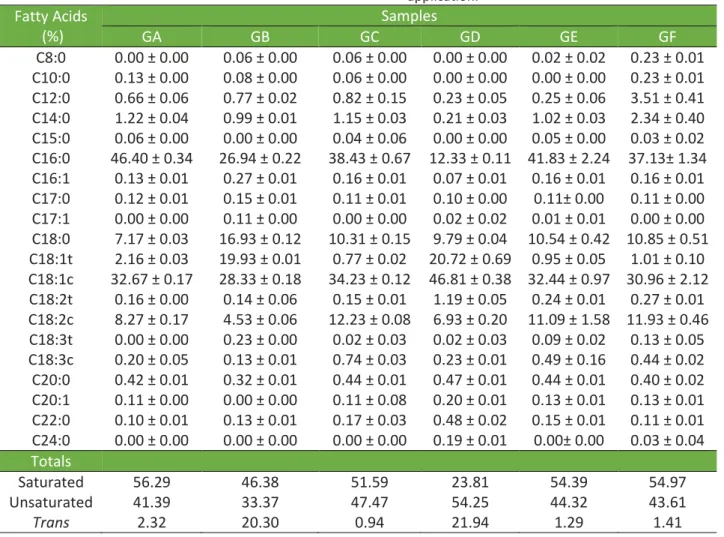
When we analyze the commercial shortenings for cookie filling produced in Brazil (Table 1), we observe that in most of them the predominant fatty acid is the palmitic acid (C16:0), making up about 40% of total composition, which indicates that most of it is produced based on palm or cotton (GRIMALDI; GONÇALVES; ESTEVES, 2000). Palm oil has been the lipid base most used when the aim is to formulate zero-trans shortenings (MERT; DEMIRKESEN, 2016; VEREECKEN et al., 2007).
Table 1. Fatty acid composition of the commercial shortenings for cookie filling
application. Fatty Acids (%) Samples GA GB GC GD GE GF C8:0 0.00 ± 0.00 0.06 ± 0.00 0.06 ± 0.00 0.00 ± 0.00 0.02 ± 0.02 0.23 ± 0.01 C10:0 0.13 ± 0.00 0.08 ± 0.00 0.06 ± 0.00 0.00 ± 0.00 0.00 ± 0.00 0.23 ± 0.01 C12:0 0.66 ± 0.06 0.77 ± 0.02 0.82 ± 0.15 0.23 ± 0.05 0.25 ± 0.06 3.51 ± 0.41 C14:0 1.22 ± 0.04 0.99 ± 0.01 1.15 ± 0.03 0.21 ± 0.03 1.02 ± 0.03 2.34 ± 0.40 C15:0 0.06 ± 0.00 0.00 ± 0.00 0.04 ± 0.06 0.00 ± 0.00 0.05 ± 0.00 0.03 ± 0.02 C16:0 46.40 ± 0.34 26.94 ± 0.22 38.43 ± 0.67 12.33 ± 0.11 41.83 ± 2.24 37.13± 1.34 C16:1 0.13 ± 0.01 0.27 ± 0.01 0.16 ± 0.01 0.07 ± 0.01 0.16 ± 0.01 0.16 ± 0.01 C17:0 0.12 ± 0.01 0.15 ± 0.01 0.11 ± 0.01 0.10 ± 0.00 0.11± 0.00 0.11 ± 0.00 C17:1 0.00 ± 0.00 0.11 ± 0.00 0.00 ± 0.00 0.02 ± 0.02 0.01 ± 0.01 0.00 ± 0.00 C18:0 7.17 ± 0.03 16.93 ± 0.12 10.31 ± 0.15 9.79 ± 0.04 10.54 ± 0.42 10.85 ± 0.51 C18:1t 2.16 ± 0.03 19.93 ± 0.01 0.77 ± 0.02 20.72 ± 0.69 0.95 ± 0.05 1.01 ± 0.10 C18:1c 32.67 ± 0.17 28.33 ± 0.18 34.23 ± 0.12 46.81 ± 0.38 32.44 ± 0.97 30.96 ± 2.12 C18:2t 0.16 ± 0.00 0.14 ± 0.06 0.15 ± 0.01 1.19 ± 0.05 0.24 ± 0.01 0.27 ± 0.01 C18:2c 8.27 ± 0.17 4.53 ± 0.06 12.23 ± 0.08 6.93 ± 0.20 11.09 ± 1.58 11.93 ± 0.46 C18:3t 0.00 ± 0.00 0.23 ± 0.00 0.02 ± 0.03 0.02 ± 0.03 0.09 ± 0.02 0.13 ± 0.05 C18:3c 0.20 ± 0.05 0.13 ± 0.01 0.74 ± 0.03 0.23 ± 0.01 0.49 ± 0.16 0.44 ± 0.02 C20:0 0.42 ± 0.01 0.32 ± 0.01 0.44 ± 0.01 0.47 ± 0.01 0.44 ± 0.01 0.40 ± 0.02 C20:1 0.11 ± 0.00 0.00 ± 0.00 0.11 ± 0.08 0.20 ± 0.01 0.13 ± 0.01 0.13 ± 0.01 C22:0 0.10 ± 0.01 0.13 ± 0.01 0.17 ± 0.03 0.48 ± 0.02 0.15 ± 0.01 0.11 ± 0.01 C24:0 0.00 ± 0.00 0.00 ± 0.00 0.00 ± 0.00 0.19 ± 0.01 0.00± 0.00 0.03 ± 0.04 Totals Saturated 56.29 46.38 51.59 23.81 54.39 54.97 Unsaturated 41.39 33.37 47.47 54.25 44.32 43.61 Trans 2.32 20.30 0.94 21.94 1.29 1.41
Página | 35
The only samples that do not follow this pattern and present much lower levels of palmitic acid are samples GB and GD, which, on the other hand, feature high TFA contents, predominantly represented by the elaidic acid (C18:1t). After the boom of trans fats in the 2000s, this problem was believed to have been solved by the food industry. However, evaluating a few commercial products, one can see that this is still a problem for cookie filling. Nonetheless, when resolved or reduced, as the case of samples GA, GC, GE, and GF, one can observe very high levels of palmitic acid, which is a fatty acid known by its pro-inflammatory effects in the human body, in addition to altering the blood cholesterol levels due to an increased LDL lipoprotein content (FAO, 2010). TFA has been commonly replaced by SFA because in baking, sweets, and snacks IFA does not contribute to softness, volume, structure, aeration, and flavor of the final product at room temperature (KLONOFF, 2007).
The second fatty acid most present in the samples was the oleic acid (C18:1c), except for the samples with high trans-fat content (GB and GD), in which the oleic acid was the main fatty acid. This fatty acid showed values always near or greater than 30%. High levels of palmitic acid ~50%, followed by oleic acids and about 10% of stearic acid are the composition usually found in zero trans-fat shortenings in the current world market (MERT; DEMIRKESEN, 2016).
In addition to palmitic and oleic acids, other fatty acids varied from sample to sample. Sample GA, for example, also consists of similar quantities of stearic (C18:0) and linoleic acids (C18:2), about 8%, as well as samples GC, GE, and GF, with approximately 10% of these fatty acids for each sample. Despite the stearic acid being saturated, some studies report its neutral action in the body and the lack of changes in blood plasma components (FAO, 2011).
The two samples rich in elaidic acid, GB and GD, had very different values of stearic and linoleic acids, with the first being almost double the proportion of the latter. The presence of TFA in these samples is very concerning because studies have proved the consumption of TFA from partially hydrogenated vegetal fat increases the risk of heart disease more than any other fatty acid (FAO, 2010), since they increase LDL and decrease HDL levels. Furthermore, they have been related to the increase in fatal cardiovascular diseases, sudden cardiac deaths, and diet-related diabetes (MOZAFFARIAN et al., 2006).
When the totals of each group of fatty acids were evaluated (Table 1), we found that all samples had trans fatty acids, even when in smaller concentrations. Overall, samples had total saturated acid content close to 50%. Except for sample GD, which is rich in trans-fat (21.94%) and presented only 23% SFA. As for the unsaturated fats content, samples low in trans fats showed values close to 42%, while the rich ones ranged from high values of unsaturated or saturated fats. GB, for example, had only 33% unsaturated values, and it showed 46% saturated and 20% trans fats. GD, in turn, despite its high levels of trans fat, had more than 54% unsaturated fat in its composition.
SOLID FAT CONTENT AND MELTING POINT
Solid Fat Content (SFC) is the percentage of solid lipids in a specific temperature, and these values are responsible for many characteristics of the final product, such as consistency, stability, and sensory properties (BECKETT, 2008).
Página | 36
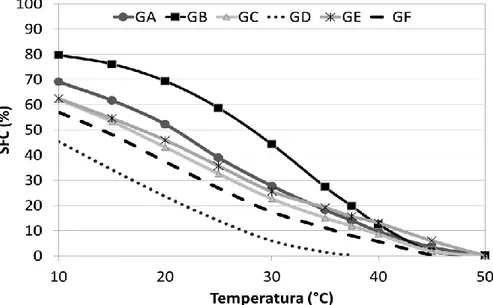
Figure 1 shows that all samples have a near-linear decrease as the temperature increases, except for the GB, which presented a higher decrease between 20 and 40°C, which may be due to its high level of TFA and SFA. Special fats with little variation in solids and a broad temperature range are defined as plastic fats. This plasticity is desirable in many products and used under various temperatures without loss of aeration capacity or consistency (WOERFEL, 1995), as in the case of fillings.
Figure 1. Solid Fat Content (SFC) of the commercial shortenings for cookie fillings. In addition to plasticity, the solids curve also indicates the technological properties of a fat if different temperature ranges are analyzed. In the case of fats for fillings, the most interesting ranges are solid content between 20-22°C, being no less than 10%, and absence of solids between 35-37°C, so that the sensation of waxy is not detected (LIDA; ALI, 1998). Among the samples studied, all are stable and probably will not exude oil; however, only GD was fully melted at approximate body temperature. The others presented solid contents at temperatures above 40°C, which can convey a waxy sensation to the final product.
The SFC of a shortening at room temperature is a critical parameter because if it is too low, the fat will be excessively soft, if it is very high, the fat will be too stiff, which would hinder the processing and make aeration impossible. Small variations of SFC in a broad temperature range indicate wide plasticity. Plasticity is a desirable feature in shortenings, indicating that it maintains its properties at various temperatures (WOERFEL, 1995). Usually, shortening should be at 15-25% SFC at working room temperature (DANTHINE; DEROANNE, 2003; O´BRIEN, 2005). Considering that, in Brazil, the room temperatures in which these samples are commonly applied normally range from 25°C to 35°C, all samples, except for GB (too stiff) and GD (too soft), are good shortening for fillings.
Table 2 shows the melting point of the samples, calculated by the solids curve. All samples had a melting point above 45°C, except for the sample GD, which has a melting point near 37°C, very close to the body temperature. The different results for GD are associated with low levels of saturated and high levels of unsaturated
Página | 37
fats, cis and trans isomers, since trans fats are intermediaries between saturated and unsaturated fats regarding melting point and sample stiffness. The sample GB did not have the same result since it also has a high content of saturated fat, in addition to its high trans-fat content. Overall, shortenings evaluated in previous studies had a melting point between 38.2 and 50.6°C; however, most samples were between 42-46°C (DEMAN; DEMAN; BLACKMAN, 1991).
Table 2. Melting point of the commercial shortenings for cookie filings.
Samples Melting point (°C)
GA 48.28 ± 0.045a GB 47.18 ± 0.034b GC 48.35 ± 0.075a GD 37.04 ± 0.074c GE 49.93 ± 0.065d GF 45.00 ± 0.101e
NOTE: Values are shown as mean ± standard deviation of six replicates. Means represented by different lower case letters in all columns indicate that the samples are statistically different (P < 0.05) by Tukey’s test.
CRYSTALLIZATION ISOTHERMS
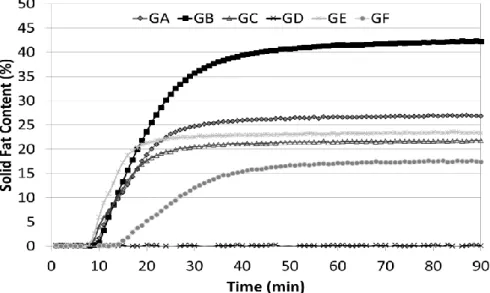
Crystallization is the structural transformation from liquid to solid when subjected to specific temperature conditions. Fat crystallization basically happens in two simultaneous steps, nucleation and crystal growth (CAMPOS, 2005). The crystallization profile of the samples was measured and is presented in Figure 2; isothermal crystallization over time is a more sensitive and discriminating measure regarding differences in the crystallization profile of the samples. Samples GC and GE are the ones that statart crystallizing faster, followed by GA, since these three have a similar crystallization profile. They start crystallization almost together; tsfc
equal to 9 and 10 min, and it reaches a similar maximum solids content, between 21 and 26% SFCmax. These three samples may be considered shortening standards
for zero trans cookie filling in Brazil, as they had very similar values.
Other samples, such as GB, showed a maximum solids content much higher than the others do and reached these values at almost the same time as GA, GC, and GE. This difference is due to high levels of SFA and TFA in their compositions; these FA have a high melting point and fast crystallization. GF, however, presented a different profile, with smaller solids content and much slower crystallization. Finally, GD maintained 0% solids over the 90 min of isotherm, despite its high TFA content. Such behavior hinders the implementation of this fat, since it has an extremely slow crystallization at 25°C.
When we evaluated the parameter obtained by the adjustment of Avrami kinetics, we found the crystallization speed of the samples (k). The sample with the faster crystallization is GB, followed by GA and GC, which do not differ significantly from each other; then GE and GF, and, finally, the sample GD, which failed to crystallize in the time analyzed. By the crystallization half time (t1/2), we observed
in a more practical manner how long these samples take to complete 50% of their crystallization. When it comes to applying this parameter, this is a very important step as it not only shows the onset or final crystallization of the fat but also portrays the process as a whole (SILVA et al., 2017). Considering shortening standards such
Página | 38
as GA, GC, and GE, a good t1/2 for these products would be from 12 to 17 min. These
times are relatively short to reach half the crystallization process, especially in comparison with cocoa butter (85 min) (RIBEIRO et al., 2013) or palm oil (56 min) (DOMINGUES et al., 2016).
Figure 2. Isothermal crystallization at 25°C of the commercial shortenings for cookie
fillings.
The last Avrami parameter to be discussed is the crystalline morphology indicated by value n (Table 3). Overall, all samples, except for GD and GE, showed a value of 2. This shows that the crystalline morphology of these fats will be have the form of discs, with the formation of instantaneous nuclei or needles with sporadic cores (CAMPOS, 2005), which can also be regarded as a model of crystalline network formation of shortenings for filling. However, this will be confirmed by the results of the next topic.
Table 3. The Avrami parameters of isothermal crystallization from commercial
shortenings for cookie fillings.
Samples tsfc (min) SFCmax (%) k (min-1) n t1/2 (min) R²
GA 10 ± 0.0 c 26.99 ± 0.005 b 0.00028 ± 5 x10⁻⁵ a 2.77 ± 0.06 b 17.05± 0.01 c 0.9939 GB 11 ± 0.0 b 42.33 ± 0.16 a 0.00049 ± 5 x10⁻⁵ b 2.43 ± 0.02 c 19.81 ± 0.22 b 0.9922 GC 9 ± 0.47 d 21.86 ± 0.22 d 0.00032 ± 5 x10⁻⁵ a 2.85 ± 0.06 b 14.93 ± 0.13 d 0.9927 GD 0 ± 0.0 e 0 ± 0.0 f 0 ± 0.00 d 0 ± 0.00 d 0 ± 0.00 f 0.9935 GE 9 ± 0.0 d 23.57 ± 0.06 c 0.000087 ± 4 x10⁻⁵ c 3.55 ± 0.13 a 12.84 ± 0.26 e 0.9929 GF 15 ± 0.0 a 17.61 ± 0.07 e 0.000071 ± 1.4 x10⁻⁵c 2.83 ± 0.06 b 25.89 ± 0.25 a 0.9943 NOTE: Values are shown as mean ± standard deviation of six replicates. Means represented by different lower case letters in all columns indicate that the samples are statistically different (P < 0.05) by Tukey’s test.
MICROSTRUCTURE
Fat composition, as well as its crystallization conditions, affects crystal formation, affecting the development of different polymorphs and crystalline
Página | 39
structures. Crystals aggregate into larger structures to form a crystalline network, which is seen as the fat microstructure (WRIGHT; MARANGONI, 2002).
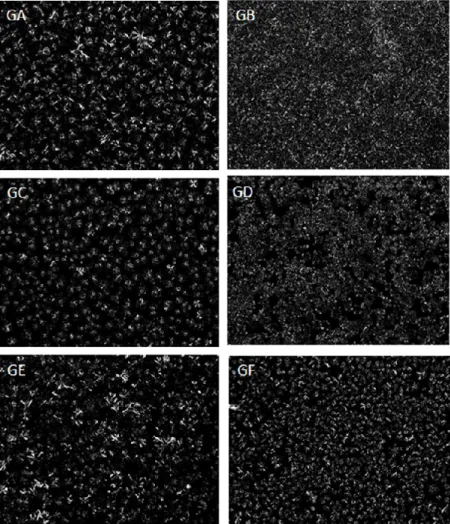
Figure 3 shows a characteristic microstructure of the shortening samples containing high and low levels of trans fat. Samples GA, GC, GE, and GF, which are low in trans-fat, are composed of little needles grouped in the shape of spherulites. However, samples rich in trans-fat, such as GD and GB, showed a change in the crystalline morphology when compared with low trans-fat. Crystals are also needles, but they are smaller and do not group in spherulites. Then, as predicted by the Avrami model, all fats form needle-type crystals with sporadic nuclei (CAMPOS, 2005).
Figure 3. Polarized light microscopy pictures of crystals obtained for commercial
shortenings (scale =200µm).
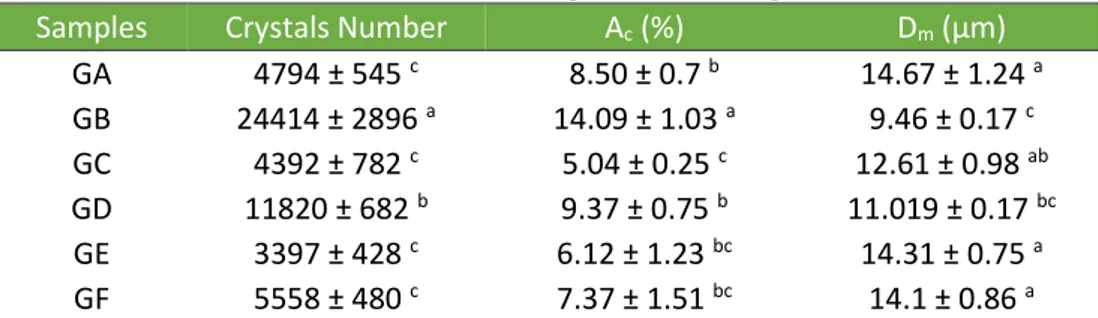
Table 4 shows mean diameter values (Dm) and percentage of crystallized area
(Ac) of the samples. Normally, shortenings, especially those formulated with
vegetable oils, have a mean crystal diameter between 5 and 9 µm (CHAWLA; DEMAN, 1990). The only sample that fit these values was GB, a sample rich in saturated and trans fatty acids. Low trans-fat samples have a mean diameter between 12 and 15 µm (Table 4).
Página | 40
Table 4. Crystal’s number, mean crystal diameter (Dm) and total crystallized area (Ac) of
commercial shortening for cookie fillings.
Samples Crystals Number Ac (%) Dm (µm)
GA 4794 ± 545 c 8.50 ± 0.7 b 14.67 ± 1.24 a GB 24414 ± 2896 a 14.09 ± 1.03 a 9.46 ± 0.17 c GC 4392 ± 782 c 5.04 ± 0.25 c 12.61 ± 0.98 ab GD 11820 ± 682 b 9.37 ± 0.75 b 11.019 ± 0.17 bc GE 3397 ± 428 c 6.12 ± 1.23 bc 14.31 ± 0.75 a GF 5558 ± 480 c 7.37 ± 1.51 bc 14.1 ± 0.86 a
NOTE: Values are shown as mean ± standard deviation of six replicates. Means represented by different lower case letters in all columns indicate that the samples are statistically different (P < 0.05) by Tukey’s test.
Sample GB was also the one with the highest Ac, approximately 14%; low trans
shortenings showed smaller values between 5-10%. The sample GD, as it has a low saturated fat content despite the high level of trans fat, presents small crystals much similar to GB, but in smaller quantities and lower percentage of crystalline area, with large amorphous regions.
Comparing cis, unsaturated, saturated, and trans fatty acids, molecules rich in saturated and trans fats are organized in a more compacted crystalline network, which gives them a high melting point and solid behavior at room temperature (KLONOFF, 2007).
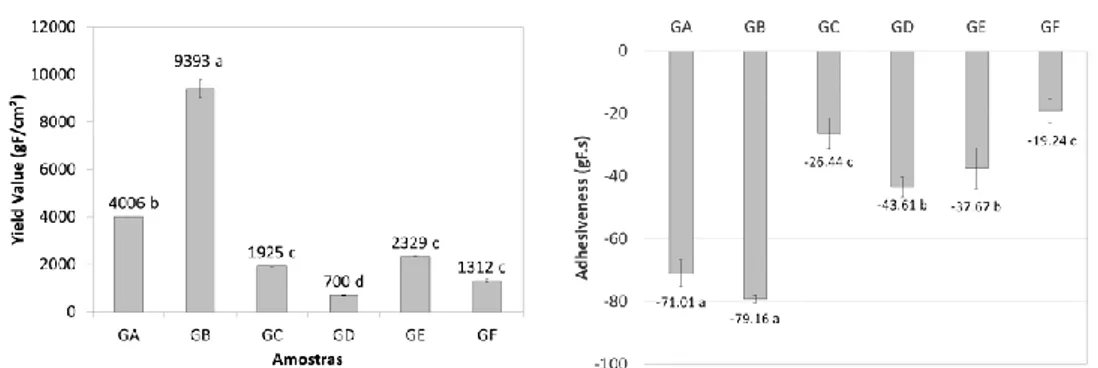
CONSISTENCY AND ADHERENCE
Consistency is measured as the force required to cause a permanent deformation, and this value it commonly converted to Yield Value (YV), allowing the comparison between fats, shortenings, and spreads (HAIGHTON, 1959).
Figure 4A and B shows consistency and adherence, respectively. The sample GB is the one that presented the greater consistency, which was expected due to its well-structured crystalline network, promoted by TFA and SFA. TFA crystals form a more structured and firm network in fillings than those without TFA (VEREECKEN et al., 2007). GA was the second most consistent sample, followed by GC, GE, and GF, which did not statistically differ between themselves (p < 0.05). Sample GA, among low trans, had the highest C18:1t content (~2%) and the lowest C18:2c content, which may have contributed to its greater consistency in comparison with the low trans ones. In this case, the softer sample was GD, which can be explained due to its composition, forming a crystalline network with amorphous spaces and less consistency.
Adherence in fats for filling is an important parameter to determine the ability of the filling to adhere the two cookies. Samples GA and GB presented the greater adherence, which indicates that small proportions of TFA (2%) are enough to grant good adherence to fillings, as long as they do not have a high content of SFA (~50%). The GD and GE samples showed the second greatest adherence, followed by samples GC and GF. Samples GC, GE, and GF showed very similar compositions, but the adherence presented significant differences (p < 0.05).
Página | 41
Figure 4. Yield value and adhesiveness of the commercial shortenings for cookie
fillings at 25 °C.
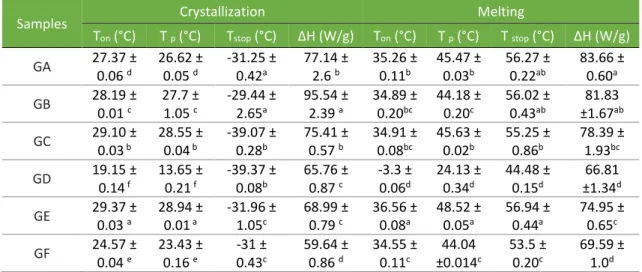
THERMAL BEHAVIOR
Differential scanning calorimetry (DSC) provides information on changes in temperature and energy during melting, crystallization, and polymorphic changes (JIN et al., 2008).
Figure 5 shows the melting and crystallization profile of the samples, and Table 5 presents the calculated data of crystallization and melting peaks. Observing the crystallization profile (Figure 5A), all samples had only one crystallization peak; however, the sample GB was the only one that did not subdivide this peak into sub-peaks and also the only peak that had greater ΔHc (crystallization enthalpy),
which is a result of the high content of TFA+SFA (66.38%). Other samples had peaks subdivided into one or more sub-peaks and a wide range of crystallization (difference between Toc and Tfc), which occurs due to the heterogeneous
composition of these samples.
Figure 5. Thermal behavior of the commercial shortenings for cookie fillings; (A)
crystallization curves; (B) melting curves.
Samples GA, GC, and GE present the same fine peak near 28°C as sample GB. Since these samples have a low level of elaidic acid, this fine peak is assumed a combination of the mixture of SFA (especially palmitic acid) + TFA. When the TFA content is low, it is replaced by SFA in the crystallization. Despite the samples GE and GF having similar SFA and TFA total contents, GF presented this first minor sub-peak and displaced to lower temperatures (T= 23.45°C) because the sample GE has the higher C:16 content and the sample GF, the higher C12 and C14, which are SFA with lower melting points.
1
Página | 42
Table 5. DSC crystallization and melting parameters, onset temperature (Ton), peak
temperature (Tp), end temperature (Tstop) and change in enthalpy (ΔH) for commercial shortenings for cookie fillings.
Samples Crystallization Melting
Ton (°C) T p (°C) Tstop (°C) ΔH (W/g) Ton (°C) T p (°C) T stop (°C) ΔH (W/g) GA 27.37 ± 0.06 d 26.62 ± 0.05 d -31.25 ± 0.42a 77.14 ± 2.6 b 35.26 ± 0.11b 45.47 ± 0.03b 56.27 ± 0.22ab 83.66 ± 0.60a GB 28.19 ± 0.01 c 27.7 ± 1.05 c -29.44 ± 2.65a 95.54 ± 2.39 a 34.89 ± 0.20bc 44.18 ± 0.20c 56.02 ± 0.43ab 81.83 ±1.67ab GC 29.10 ± 0.03 b 28.55 ± 0.04 b -39.07 ± 0.28b 75.41 ± 0.57 b 34.91 ± 0.08bc 45.63 ± 0.02b 55.25 ± 0.86b 78.39 ± 1.93bc GD 19.15 ± 0.14 f 13.65 ± 0.21 f -39.37 ± 0.08b 65.76 ± 0.87 c -3.3 ± 0.06d 24.13 ± 0.34d 44.48 ± 0.15d 66.81 ±1.34d GE 29.37 ± 0.03 a 28.94 ± 0.01 a -31.96 ± 1.05c 68.99 ± 0.79 c 36.56 ± 0.08a 48.52 ± 0.05a 56.94 ± 0.44a 74.95 ± 0.65c GF 24.57 ± 0.04 e 23.43 ± 0.16 e -31 ± 0.43c 59.64 ± 0.86 d 34.55 ± 0.11c 44.04 ±0.014c 53.5 ± 0.20c 69.59 ± 1.0d
NOTE: Values are shown as mean ± standard deviation of six replicates. Means represented by different lower case letters in all columns indicate that the samples are statistically different (P < 0.05) by Tukey’s test.
Despite all samples starting and finishing the crystallization process at close temperatures (Tpc=28 to Tfc=-30°C), the sample GD starts and finishes later (Tpc=19
and Tfc=-39°C). This is the only one that does not have a more pronounced
sub-peak at 28°C, because its C16 content is very low (12.33%). Its first sub-sub-peak appears at about 13.65°C, which may indicate the high-unsaturated fat content in this sample displaces the crystallization of trans fats to lower temperatures. Similar crystallization results were found for all vegetable shortening rich in TFA (NARINE; HUMPHREY, 2004).
Samples GA, GC, GD, and GF show a second sub-peak near zero; these samples have a C18:1 content above 30%, which is the melting range of this FA (SCRIMGEOUR, 2005).
GC even has a third sub-peak that occurs near -30°C, along with the second sub-peak of GD. GC, after GD, is the sample with the highest contents of UFA, C18:2c, and C18:3c.
Observing the melting profile (Figure 5B), all samples showed well differentiated characteristics, indicating that little difference in the fat composition leads to significant changes in the melting profile. Despite the large differences observed regarding profile in Figure 5B, the values calculated in Table 5 were not as discrepant, except for GD. Despite the differences in the location and amounts of sub-peaks, the samples (GA, GB, GC, GE, and GF) start melting approximate at 35°C and finish at about 55°C, with a temperature peak close to 45°C.
These results confirm the high melting point of these samples. The most differentiated data were obtained for ΔHf, in which GA and GB were those that
required a higher melting temperature, followed by GC, GE, and GF, which in this case was significantly similar to GD. The GD sample, as in other results, was the one that presented the higher profile.
Página | 43
POLYMORPHISM
X-ray diffraction is a universal procedure technique for determining the polymorphism in a crystalline material. It measures the differences between marshalling shapes and angles of TAG based on diffractograms already established by the literature (OLIVEIRA et al., 2015).
Figure 6 shows the results of X-ray diffraction. At 25°C, none of the samples was fully crystallized, thus the interplanar spaces that represent the polymorphic forms are not very clear. However, we decided to use such value, as this is the temperature of product marketing. Even with the long amorphous phase observed, four interplanar spaces were detected in almost all samples, 4.3 Å, 4.2 Å, 4.0 Å and 3.8 Å. Thus, these fats preferably presented the polymorph β’, as this is characterized by the presence of two interplanar spaces in the short spacing 3.8 and 4.2 Å or three smaller interplanar spaces in 4.27, 3.91, and 3.71 (D`SOUZA; DEMAN; DEMAN, 1990). This result was expected because palm oil derivatives are considered ingredients commonly added to shortenings for directing the polymorphism at β’ and delaying the transition from β’ to β, avoiding thus a sandy aspect in the final product (GHOTRA; DYAL; NARINE, 2002).
Figure 6. Diffractograms of commercial shortenings for cookie fillings at 25° C. Polymorph β’ is usually the most functional polymorph in fat-based products due to the development of small and fine needle-type crystals (~1 μm) (DEMAN; DEMAN; BLACKMAN, 1991). The presence of this polymorph in shortenings is responsible for softness (D`SOUZA; DEMAN; DEMAN, 1990), aeration capacity, and mixture properties with other ingredients such as sugar in the final product (DEMAN; DEMAN; BLACKMAN, 1991; WOERFEL, 1995). Polymorphism in fillings is normally given by the temperature in the cooling tunnel. High trans fillings usually crystallize without much effort at polymorph β’, but low trans fillings require a direction. The higher the tunnel temperature, the slower the crystallization, occurring the formation of β’ and inhibition of the post-crystallization for β (VEREECKEN et al., 2007).
The choice of different oils and fats in shortening blends is more of an empirical experience than a scientific choice. The physical properties commonly
Página | 44
monitored are melting profile, SFC, and polymorphism/polytyphism (GHOTRA; DYAL; NARINE, 2002).
CONCLUSIONS
The Brazilian profile of shortenings for cookie filling still contains high levels of TFA. When these fatty acids are replaced, this is usually replaced by SFA, especially with palm and cotton sources that have higher saturated fat contents and are rich in palmitic acid.
Considering the data found in this study, technologically applicable shortenings for cookie filling should have the following physical and chemical properties: a palmitic acid content ~40%; SFC between 15-25% at the process temperature; melting range between 35-55°C, with melting point from 42 to 46°C; average crystalline diameter of spherulite crystals between 12-15µm; β’ polymorph, consistency, and adhesion between 4000-1000 gF/cm² and 70-20 gF.s, respectively. Based on these parameters and new guidelines, the industry can begin the transformation previously conducted for decreasing TFA now to reduce SFA as well because if these predetermined parameters are achieved, structure, sugar and cookie adherence, aeration and proper flavor of the final product are ensured.
ACKNOWLEDGEMENTS
The authors would like to thank the companies that donated the fats for the study, the Laboratory of oils and fats, DTA, FEA, Unicamp for the space used in the development of the research, and CNPq for the doctoral fellowship granted (140477/2015-2).
Página | 45
Caracterização físico-química dos
encurtamentos recomendados para
aplicação no recheio de biscoitos
RESUMO
Encurtamento é o nome comercial dado a uma gordura de fase contínua usada em frituras, assados, recheios e outros. Este estudo teve como objetivo avaliar os encurtamentos comerciais para o preenchimento de biscoitos, avaliar como essas amostras são compostas diante das novas mudanças nutricionais na área e tentar elaborar um perfil tecnológico dessas gorduras para um maior desenvolvimento de bases zero trans e baixas saturadas. Seis amostras de gordura para preenchimento foram avaliadas quanto à composição em ácidos graxos, teor de gordura sólida, ponto de fusão, isotermas de cristalização, comportamento térmico, textura e polimorfismo. Observamos que ainda existem amostras com alto teor de gordura trans no mercado, mas também há amostras com baixo teor desses ácidos graxos; no entanto, foi verificada uma troca direta de ácidos graxos saturados (principalmente ácido palmítico). Os encurtamentos para o preenchimento de biscoitos devem ter um teor de ácido palmítico ~ 40%; SFC entre 15-25% à temperatura do processo; intervalo de fusão entre 35-55 ° C, com ponto de fusão de 42 a 46 ° C; diâmetro cristalino médio de cristais de esferulite entre 12-15 µm; β 'polimórfico e consistência e adesão entre 4000-1000 gF / cm² e 70-20 gF.s, respectivamente.
PALAVRAS-CHAVE: encurtamentos; recheios; cristalização; ácidos graxos trans;
Página | 46
REFERENCES
AOCS. American Oil Chemists’ Society. Official Methods and Recommended
Practices of the American Oil Chemists’ Society. 5ed. ed. [s.l: s.n.].
BECKETT, S. T. Crystallizing the fat in chocolate. In: BECKETT, S. T. (Ed.). . The
Science of Chocolate. 2. ed. [s.l.] RSC Publishing, 2008. p. 103–124.
CAMPOS, R. Experimental methodology. In: MARANGONI, A. G. (Ed.). . Fat crystal
network. Marcel Dek ed. New York: [s.n.]. p. 267–349.
CHAWLA, P.; DEMAN, J. M. Measurement of the size distribution of fat crystals using a laser particle counter. JAOCS, Journal of the American Oil Chemists’
Society, v. 67, n. 5, p. 329–332, 1990.
D`SOUZA, V.; DEMAN, J. M.; DEMAN, L. Short spacings and polymorphic forms of natural and commercial solid fats: A review. Journal of the American Oil
Chemists’ Society, v. 67, n. 11, p. 835–843, 1990.
DANTHINE, S.; DEROANNE, C. Physical and Textural Characteristics of
Hydrogenated Low-Erucic Acid Rapeseed Oil and Low-Erucic Acid Rapeseed Oil Blends. JAOCS, Journal of the American Oil Chemists’ Society, v. 80, n. 2, p. 109– 114, 2003.
DEMAN, L.; DEMAN, J. M.; BLACKMAN, B. Physical and Textural Characteristics of Some North American Shortenings. JAOCS, Journal of the American Oil Chemists’
Society, v. 68, n. 2, p. 63–69, 1991.
DOMINGUES, M. A. F. et al. Sucrose behenate as a crystallization enhancer for soft fats. Food Chemistry, v. 192, p. 972–978, 2016.
ECKEL, R. H.; PAST, I.; BORRA, S. Understanding the Complexity of Trans Fatty
Acid Reduction in the American DietAHA Conference Proceedings. [s.l: s.n.].
FAO, W. Fats and fatty acids in human nutrition. Report of an expert
consultation.Fats and fatty acids in human nutrition. Report of an expert consultation. Rome Italy: [s.n.].
FDA, F. A. D. A. Final Determination Regarding Partially Hydrogenated Oils, 2015.
Página | 47
GHOTRA, B. S.; DYAL, S. D.; NARINE, S. S. Lipid shortenings: A review. Food
Research International, v. 35, n. 10, p. 1015–1048, 2002.
GRIMALDI, R.; GONÇALVES, L. A. G.; ESTEVES, W. Characteristics of Brazilian Shortenings. Brazilian Journal of food technolody, v. 3, p. 159–164, 2000.
HAIGHTON, A. J. The measurement of the hardness of margarine and fats with cone penetrometers. Journal of the American Oil Chemists Society, v. 36, n. 8, p. 345–348, 1959.
HARTMAN, L.; LAGO, R. C. A. Rapid preparation of fatty acid methyl esters from lipids. Lab. Pract., v. 22, n. January, p. 475–476,494, 1973.
JIN, Q. et al. Melting and Solidification Properties of Palm Kernel Oil , Tallow , and Palm Olein Blends in the Preparation of Shortening. Journal of the American Oil
Chemists’ Society, v. 85, n. 1, p. 23–28, 2008.
KARABULUT, I.; TURAN, S.; ERGIN, G. Effects of chemical interesterification on solid fat content and slip melting point of fat/oil blends. European Food Research
and Technology, v. 218, n. 3, p. 224–229, 2004.
KLONOFF, D. C. Replacements for Trans Fats — Will There Be an Oil Shortage ?
Journal of Diabetes Science and Technology, v. 1, n. 3, p. 415–422, 2007.
LIDA, H. M. D. N.; ALI, A. R. M. Physico-chemical characteristics of palm-based oil blends for the production of reduced fat spreads. Journal of the American Oil
Chemists’ Society, v. 75, n. 11, p. 1625–1631, 1998.
MERT, B.; DEMIRKESEN, I. Reducing saturated fat with oleogel/shortening blends in a baked product. Food Chemistry, v. 199, p. 809–816, 2016.
METIN, S.; HARTEL, R. W. Crystallization of Fats and Oils. In: SHAHIDI, F. (Ed.). .
Bailey’s Industrial Oil and Fat Products. Sixth ed. Hoboken, New Jersey: John
Wiley & Sons, Ltd, 2005. p. 45–76.
METZROTH, D. J. Shortenings: Science and Technology. In: SHAHIDI, F. (Ed.). .
Bailey’s Industrial Oil and Fat Products. 6. ed. [s.l.] Copyright@ 2005 John Wiley
& Sons, Inc., 2005. p. 83–122.
MOZAFFARIAN, D. et al. Trans fatty acids and cardiovascular disease. The New
Página | 48
NARINE, S. S.; HUMPHREY, K. L. A comparison of lipid shortening functionality as a function of molecular ensemble and shear: Microstructure, polymorphism, solid fat content and texture. Food Research International, v. 37, n. 1, p. 28–38, 2004.
O´BRIEN, R. D. Shortening: Types and Formulations. In: SHAHIDI, F. (Ed.). .
Bailey’s Industrial Oil and Fat Products. Six Editio ed. [s.l.] Copyright@ 2005 John
Wiley & Sons, Inc., 2005. v. 6p. 125–157.
OLIVEIRA, G. M. DE et al. Hard fats as additives in palm oil and its relationships to crystallization process and polymorphism. LWT - Food Science and Technology, v. 63, n. 2, p. 1163–1170, 2015.
PATEL, A. R. et al. The Contribution of Modern Margarine and Fat Spreads to Dietary Fat Intake. Comprehensive Reviews in Food Science and Food Safety, v. 00, n. 4, p. 1–13, 2016.
RIBEIRO, A. P. B. et al. Hardfats as crystallization modifiers of cocoa butter.
European Journal of Lipid Science and Technology, v. 115, n. 12, p. 1462–1473,
2013.
RODRIGUES, J. N.; GIOIELLI, L. A.; ANTON, C. Propriedades Físicas De Lipídios Estruturados Obtidos De Misturas De Gordura Do Leite E Óleo De Milho 1. v. 23, n. 2, p. 226–233, 2003.
SCHENK, H.; PESCHAR, R. Understanding the structure of chocolate. Radiation
Physics and Chemistry, v. 71, n. 3–4, p. 829–835, 2004.
SCRIMGEOUR, C. Chemistry of Fatty Acids. Bailey’s Industrial Oil and Fat
Products, p. 1–43, 2005.
SILVA, T. L. T. DA et al. Templating effects of dipalmitin on soft palm mid fraction crystals. International Journal of Food Properties, n. May, 2017.
SPOSITO, A. C. et al. IV Diretriz Brasileira sobre Dislipidemias e Prevenção da Aterosclerose: Departamento de Aterosclerose da Sociedade Brasileira de Cardiologia. Arquivos Brasileiros de Cardiologia, v. 88, p. 2–19, 2007.
VEREECKEN, J. et al. Relationship between crystallization behavior,
microstructure, and macroscopic properties in trans-containing and trans-free filling fats and fillings. Journal of Agricultural and Food Chemistry, v. 55, n. 19, p. 7793–7801, 2007.
Página | 49
WILLIAMS, C. M.; SALTER, A. Saturated fatty acids and coronary heart disease risk: the debate goes on. Current opinion in clinical nutrition and metabolic care, v. 19, n. 2, p. 97–102, 2016.
WOERFEL, J. B. Formulation of soy oil products. Grasa y Aceites, v. 46, n. 6, p. 357–365, 1995.
WRIGHT, A. J.; MARANGONI, A. G. Effect of DAG on milk fat TAG crystallization.
Journal of the American Oil Chemists’ Society, v. 79, n. 4, p. 395–402, 2002.
YAP, P.; MAN, J. DE; MAN, L. DE. Polymorphism of palm oil and palm oil products.
Journal of the American Oil Chemists’ …, p. 693–697, 1989.
Recebido: 03 out. 2018.
Aprovado: 20 fev. 2020.
DOI: 10.3895/rebrapa.v10n2.8899
Como citar:
SILVA, T. L. T. et al. Physicochemical characterization of shortenings recommended for application in cookie filling. Brazilian Journal of Food Research, Campo Mourão, v. 10, n. 2, p. 29-49, abr./jun. 2019. Disponível em: https://periodicos.utfpr.edu.br/rebrapa
Correspondência:
Thais Lomonaco Teodoro da Silva
Departamento de Tecnologia de Alimentos, Faculdade de Engenharia de Alimentos, Universidade Estadual de Campinas, Cidade Universitária Zeferino Vaz, CEP 13083-862, Caixa Postal 6121, Campinas, São Paulo, Brasil.
Direito autoral: Este artigo está licenciado sob os termos da Licença Creative Commons-Atribuição 4.0 Internacional.