A VOLATILITY AND PREDICTABILITY
ANALYSIS.
Master’s Thesis of Economic and Corporate Decision-Making
Ivo Letra
LISBON SCHOOL OF ECONOMICS & MANAGEMENT
June 2016
Submitted to the Department of Mathematics and Statistics
Supervisor:
WHAT DRIVES CRYPTOCURRENCY VALUE?
A VOLATILITY AND PREDICTABILITY ANALYSIS.
by Ivo Letra
Submitted to the Department of Mathematics and Statistics on June 10, 2016, in partial fulfillment of the
requirements for the degree of
Master of Economic and Corporate Decision-Making Abstract
This thesis describes how digital currencies have rose as a new interesting phenomenon in the financial markets and how the most popular of the digital currencies – BitCoin – have risen crucial questions about their exchange rates and also represents a field to study the dynamics of this market, which is strongly connected with speculative traders with no fundamentals as there is no fundamental value to the currency. Using a GARCH(1, 1) model on daily data and focusing on two emerging phenomena of recent years – digital currencies, particularly Bitcoin, and web content provided by search queries on Google Trends and Wikipedia and tweets from Twitter– we discover that Bitcoin returns are driven primarily by its popularity. Thus, we analyze their relation-ship, the existence of volatility clustering and demonstrate that the web content and Bitcoin prices are connected and they exhibit some predictable power.
Contents
1 Introduction 1
2 Cryptocurrencies and Bitcoin 4
2.1 What are Cryptocurrencies? . . . 4
2.2 What is Bitcoin? . . . 5
2.3 What gives Bitcoins value? . . . 6
2.4 Is Bitcoin predictable? . . . 7
3 A Review of the Literature 9 3.1 Cryptocurrencies . . . 9
3.2 Bitcoins . . . 10
4 A Description of The Data 12 4.1 Descriptive Statistics . . . 12
4.2 Bitcoin Attractiveness . . . 13
4.2.1 Search engines . . . 13
4.2.2 Sentiment Analysis . . . 14
4.3 Bitcoin Economics and Technicals . . . 15
4.4 Macroeconomics . . . 17
5 The Econometric Model 18 5.1 Econometric methodology . . . 18
5.1.1 First order difference . . . 18
5.1.2 Stationarity . . . 19
5.1.3 Correlation Coefficient . . . 20
5.1.4 Returns . . . 21
5.1.5 GARCH(1,1) . . . 21
5.2 The Econometric Model . . . 22
5.3 Expected Results . . . 23
6 The Empirical Results 24 6.1 GARCH(1,1) . . . 24
6.2 Model Adequacy . . . 26
6.2.1 Ljung-Box Test . . . 27
6.3 Analysis of Bitcoin prices - Predictability . . . 28
7 Conclusion 31 7.1 What drives Bitcoin value? . . . 31
7.2 Why is Bitcoin volatile? . . . 32
7.3 What is the ability of the GARCH(1,1) model on the Bitcoin price? . . . 32
7.4 Is Bitcoin predictable? . . . 33
7.5 Recommendations For Future Research . . . 33
Bibliography 35
List of Figures
2.1 Bitcoin Price . . . 5
5.1 Bitcoin first order difference . . . 19
6.1 Time series dBP It- ACF of Standardized Residuals . . . 27
6.2 Time series dBP It- ACF of Observations . . . 27
6.3 Model Adequacy: Conditional Variance . . . 28
A.1 Google Searches . . . 38
A.2 Wikipedia Pageviews . . . 39
A.3 Twitter Sentiment Intensity . . . 39
A.4 Bitcoin Price and independent variables . . . 40
A.5 Correlation Plot . . . 41
List of Tables
2.1 Important events for Bitcoin. . . 6
5.1 Person Correlation - Top 10 . . . 21
6.1 Results from GARCH(1,1) - Model 1 . . . 24
6.2 Results from GARCH(1,1) - Model 2 . . . 25
6.3 Results from GARCH(1,1) - Model 3 . . . 25
6.4 Results from GARCH(1,1) . . . 25
A.1 Variables Summary . . . 38
A.2 Correlation Table . . . 41
A.3 ADF: Stationarity . . . 42
Acknowledgements
Foremost, I would like to express my sincere gratitude to my advisor Prof. Pierre Hoonhout, that was always available to help and guide me during this process. With-out his support, patience, motivation, enthusiasm, and immense knowledge I would not have been able to finish this work.
To my family, spouse and friends for providing me with the support and continuous en-couragement to accomplish my purposes through the process of researching and writing this thesis.
This accomplishment would not have been possible without them. Obrigado.
1:
Introduction
In a period of constant technological evolution, the way that we process payments changed considerably. Just by clicking, tapping or swiping, we can now complete a transaction. Processing electronic payments has seen its costs reduce significantly. The electronic banking and digital wallets grant individuals the capacity to transfer funds securely and the dissemination of smartphones has made it easier to make and receive payments in person with the e-banking features. Moreover, the development of inex-pensive card-reading equipment has enabled basically anyone to comply with electronic payments.
Simultaneously, some of the most widely used currencies are under some pressure with some questions about their safety and stability. Successive rounds of quantitative eas-ing in the United States or the instability in Europe cause fears of devaluation for both dollar and euro. Despite the recognition of its influence and the fact that many people continue to put their trust in dollars and euros, uncertainty thrives.
Under these conditions, some turned to cryptocurrencies, a possible digital substitute to conventional government-issued paper money. Cryptography intends to ensure that transactions are made in a safe and secure way, preventing users from spending the same balance more than once, and controlling the supply of digital notes in circulation. Because some cryptocurrencies can be decentralized, they allow the so-called anony-mous transactions and complicates regulation by governments. Additionally, the use of cryptocurrencies across international borders is facilitated by its electronic essence. The leading digital currency is Bitcoin, but others have emerged in the same time span, namely LiteCoin, DogeCoin and Ethereum.
Bitcoin is a decentralized digital currency that allows instant payments to anyone, any-where in the world that has a Bitcoin account. Its biggest strength is that all transac-tions and validatransac-tions are carried out collectively by the network, using a technology called Blockchain, that keeps a public ledger of all Bitcoin transactions. The “network” manages the transactions and money creation, by using peer-to-peer technology, to run
without central authority.
With its fast growth, Bitcoin attracted a growing interest by economists. Its price in-creased from zero value at the time of its inception in 2009 to around $1100 at the end of 2013. The factors that affect Bitcoin price are studied in this thesis.
Quite recently, search queries provided by Google Trends and Wikipedia, or the pub-lic feeling extracted from tweets have proved to be a useful source of information in financial applications. We use them as a proxy to capture Bitcoin’s attractiveness for investors, mainly: the volume of daily Bitcoin page views on english Wikipedia; the Google Trends data from search term “Bitcoin”; and the weighted score (bullish or bear-ish) of tweets referring Bitcoin hashtag. With these three components, we intend to measure investors’ faith in Bitcoin. This will prove to be important given the fact that Bitcoin doesn’t have any fundamental value.
How it reacts to news and what factors affect its ups and downs. By conducting our statistical tests, we will be able to assess, if there is a relationship between the price volatility of Bitcoin and the listed variables.
One of the properties of the volatility of financial assets is volatility clustering. That implies that volatility is not constant over time, a property that is easy to spot in Bit-coin price data. Periods of high volatility are usually followed by periods of similar high volatility. We will use the model developed by Bollerslev (1986) the General Autoregres-sive Conditional Heteroscedaticity (GARCH) on our daily data. This model takes into account the characteristics of series using the past errors in estimates. We can evaluate volatility clustering (the sum of ARCH and GARCH effects), the reaction to shocks and the explanatory power of our independent variables.
This thesis objective is to analyze the main drivers of Bitcoin price formation by evalu-ating four sets of determinants: supply-demand fundamentals; attractiveness; macroe-conomics; and technicals (explained below). Whereas the main focus of our econometric models is the relationship between investors’ interest in Bitcoin and how to proxy it, the attractiveness variables will be considered as more meaningful and therefore more relevant for us.
• supply-demand fundamentals like the amount of units in circulation and thus its scarcity on the market. The demand of Bitcoin is mainly determined by
transac-tion demand as a medium of exchange, Estimated output volume, Trade volume vs. transaction volume ratio. And a proxy for the network effects could be the unique Bitcoin addresses in the network or the number of transactions per day. • attractiveness for investors that is driven also by investors’ speculative behavior
measuring Bitcoin wikipedia page views, google searches for the word Bitcoin and twitter sentiment analysis over Bitcoin
• macroeconomics indicators like Gold price
• technicals that provide a measure of system productivity mainly Hash Rate, which is reflected in the system Difficulty and the Average Transaction Block
Above all we will try to evaluate the impact of events on the price of Bitcoin and try to demonstrate if that price of Bitcoin can be predictable.
This thesis is divided into the following chapters:
Chapter 2 describes the problem that we want to study, chapter 3 reviews the literature, chapter 4 describes the data, chapter 5 describes the model used, chapter 6 describes the empirical results and Chapter 7 summarizes and concludes.
2:
Cryptocurrencies and Bitcoin
2.1
What are Cryptocurrencies?
A computer currency whose implementation is based on the principles of cryptogra-phy1, used both to certify the transactions and the production of new currency. To assure the protection of sellers from fraud, cryptocurrencies will typically use a proof-of-work scheme, recording all transactions in a public ledger. To prevent the inflation phenomena, that usually happens to fiat2 currencies like Dollar and Euro, that don’t have any fundamental value as well, and their value is not backed by a physical com-modity but their value comes from government regulation or law, most cryptocurrencies are designed to have a ceiling on the total amount of currency in circulation, to gradu-ally introduce new money.
Among several digital currencies, Bitcoin became the most notable, either in terms of a remarkable market capitalisation or on the price development.
Usually, by the interaction of supply and demand on the market, currencies are priced. Macroeconomic variables such as GDP, interest rates, inflation, unemployment, and others will drive the price. Considering that digital currencies don’t have any macroe-conomic fundamentals, the supply function is either fixed (if there is a ceiling) or it develops based on some publicly known algorithm, which is the case of the Bitcoin mar-ket. The expectation of profits of holding the currency and selling it later guide the demand side of the market (as there are no interest rates on digital currencies you can-not profit from holding the currency). Speculators, trend chasers, short-term investors and noise traders dominate the market and considering that there are no
fundamen-1
http://sowmyabj.wix.com/msritcns2015#! - Cryptography is the practice and study of techniques for secure communication in the presence of third parties (called adversaries). More generally, it is about constructing and analyzing protocols that block adversaries; various aspects in information security such as data confidentiality, data integrity, authentication, and non-repudiation are central to modern cryptog-raphy.
2https://en.wikipedia.org/wiki/Fiat_money - Fiat money is currency which derives its value from
gov-ernment regulation or law. It differs from commodity money. Commodity money is created from a good, often a precious metal such as gold or silver, which has uses other than as a medium of exchange (such a good is called a commodity)
tals, either for analysis or for setting a ‘‘fair’’ price, the strong belief of investors’ on perpetual growth becomes the main driver for the digital currency price. It is for this reason crucial to measure or proxy investors’ sentiment.
●MT.Gox goes offline ●
China Bans Bitcoin
● Cyprus Capital controls
● Bitcoin Bubbles ● Bloomberg Tick ●Baidu Begins ● Subway ● Cyprus Uni accepts Bitcoin
●Baidu Stops
●
Silk Road Closed by FBI 0 300 600 900 1200 2012 2013 2014 2015 Date Bitcoin Pr ice
Bitcoin/USD Price
Figure 2.1: Bitcoin Price
2.2
What is Bitcoin?
Bitcoin is a digital currency that was created in 2009 by an anonymous person using the alias Satoshi Nakamoto. A decentralized system that allows transactions without a middle men – that is, no banks! No transaction fees (or extremely cheap) and no need to give your real name – only the wallet IDs, keeping the transactions private and anonymous, however, the Bitcoin network logs and validates every single transaction that ever happened in the network in a huge version of a general ledger, called the blockchain. More and more merchants are beginning to accept them. With no transac-tion fees, the internatransac-tional payments are easy and cheap since bitcoins are not bound to any country or subject to any regulation. Some people just use them because there are no credit card fees and others just buys bitcoins as an investment, expecting that their Bitcoin portfolio will increase in value. You can buy or sell Bitcoins in a “bitcoin exchanges” marketplace or you may try to “mine” Bitcoins using computers to solve complex math problems, the Bitcoin network allows that approximately every 10 min-utes, the winner is rewarded with 25 bitcoins (up to November 2012 the reward was 50), the reward for solving a block is automatically adjusted so that: every four years
the reward for a mined block gets halved; the difficulty (adjusted every 2016 blocks) to solve the block allows one block each 10 minutes. Therefore, money supply occurs by solving problems and computing power limits supply in the long run as the amount of processing power directed at mining changes to adjust to the existing difficulty.
2.3
What gives Bitcoins value?
Bitcoin has shown several peaks and successive ups and downs since its inception in 2009, and since then the opinions from investors are still inconclusive. Speculative trap or a safe haven? Long-run promise or a short-term hedge? These questions are frequent and demonstrates the upmost importance of this phenomenon. We know that without any fundamental value the Bitcoin’s price structure is suggests a highly sensitivity to investor sentiment, and a given set of events will likely lead to fluctuation in the Bitcoin price. As was displayed in Figure 2.1, the Bitcoin price exhibits very high volatility and historical prices do not reveal any specific pattern. We can conceive that specific events may contribute to the volatility of the Bitcoin price. The events chosen in table 2.1 are some of the most important for Bitcoin3.
Event Description
Cyprus Capital controls imposed and the financial crisis on Cyprus in of March 2013, is claimed to have increased interest for bitcoin as an alternative to the standard monetary system.
Silk Road This American website was a known market place for illegal products such as drugs. In the beginning of October 2013 it was however shut down by the FBI.
Baidu This Chinese competitor to Google announced in the middle of October 2013 that it would accept payments in Bitcoin
USA The chairman of Federal Reserve, Ben Bernanke, said in an open letter to the Homeland Security in the middle of November 2013 that bitcoin “may hold long-term promise”.
China The Chinese government declared in the beginning of December 2013 that banks and payment companies are forbidden to deal with bitcoin.
MtGox The largest bitcoin exchange, MtGox, declares bankruptcy in the end of February 2014, after being hacked and losing a great deal of investors’ money .
Table 2.1: Important events for Bitcoin.
The impact of network effects is relevant as well, the Bitcoin value may be related to the amount of people using it and accept it as a form of payment, the more people start using Bitcoin, the more likely merchants will accept it (network effects won’t be part of
our model).
2.4
Is Bitcoin predictable?
The ability to predict the stock market has attracted much attention for some decades. But is it really possible to predict the stock market? The Efficient Market Hypothesis (EMH) and random walk theory were relevant for stock market prediction and accord-ing to the EMH stock market prices are generally driven by new information, i.e. news, and not to present and past prices. Like it was referred by Qian and Rasheed (2007), because news are unpredictable, the fluctuations of the stock market will reflect a ran-dom walk pattern and cannot be predicted with more than 50% accuracy. Since Bitcoin price market doesn’t have any fundamentals the above theories of efficient markets and random walk will act as guidance to inspect Bitcoin predictability..
Besides news unpredictability, recent research also suggests that very premature indi-cators can be derived from online social media (blogs, Twitter feeds, RSS, Google, etc.) to predict changes in various economic and commercial indicators.
This thesis aims to estimate the predictable capabilities of social media sources like Google (Figure A.1), Wikipedia (Figure A.2) and Twitter (Figure A.3) on Bitcoin price and therefore if these sources are incorporated immediatly into prices. Can we have a privileged position in the market by predicting the price in advance? We know that one of the attributes of efficient markets is that at any given time, the prices on the market already incorporate all available information and adjust quickly to reflect new information, therefore it shouldn’t be possible to outperform the market by using the same information that is already known to all investors, except through luck.
The theory of efficient markets states that investors decide rationally. However, deci-sion making can be irrational according to the behavioral finance, investors can be in-fluenced by many factors. Malkiel (2003) states that new information spreads quickly and is instantaneously incorporated into prices this ensures that neither technical4nor fundamental5 analysis can be used to predict future prices. Thus, without accepting
4Technical analysis uses past patterns of price and the volume of trading as the basis for predicting
fu-ture prices. The random-walk evidence suggests that prices of securities are affected by news. Favourable news will push up the price and vice versa. It is therefore appropriate to question the value of technical analysis as a means of choosing security investments.
above-average risks, investors cannot earn above-average returns. Nevertheless, even though the release of new information is the cause of price changes, the no-arbitrage6 condition ensures that this new information cannot be used to infer predictable future returns (Shleifer, 2000).
Rational Expectations:
Etπt+1= E(πt+1|It) (2.1)
the expected price of Bitcoin, beginning month t,tπt+1should incorporate all the avail-able information, I, at beginning of month t and includes {πt, πt−1, ...}with corresponds to Bitcoin Price for period t,t − 1,... Also, It⊇ It−1⊇ It−2... That is, agents participating in the market do not forget.
A possible Bitcoin Price Model, considering web sources, would be:
BCt+1 = θ0+ α1BCt+ α2T wittert+ α3Googlet+ α4W ikit+ εt (2.2) Where BC is the Bitcoin price for period t, θ0is the constant, α is the coefficient, T witter represents the number of tweets referring “Bitcoin” for period t, Google the number of searches using the term “Bitcoin” for period t, W iki the number of pageviews on the “Bitcoin” english wikipedia page and εtthe error term.
As the Bitcoin price is not based on any fundamentals, it has implications for the appli-cability of the EMH on the Bitcoin market. Nevertheless, Bitcoin price has experienced a great deal of volatility (see Figure 2.1), and it is thus interesting to discuss its origin. Despite the thesis objective is not to study market efficiency of the bitcoin market, it forms an important basis to assess how information is incorporated into the price, for that reason essential for an analysis of the underlying causes of Bitcoin price volatility.
in order to identify undervalued (or overvalued) securities.
6In a perfectly smooth running market, you cannot find an opportunity that is risk free but still paying
more than the risk-free interest rate (assume it as rate at which your bank pays for your savings deposits). This is called the no-arbitrage theory. Arbitrage means you can find an opportunity that is low-risk, high-reward. Financial research says that in theory that is impossible. If everyone know something is low-risk and high-reward everyone will jump on to it.
3:
A Review of the Literature
3.1
Cryptocurrencies
With most weight on Bitcoin, there is a rise of academic research literature about cryp-tocurrencies. Most of them focus on the ’moneyness’ literature of Bitcoin or if it is more comparable to a fiat versus commodity money like ’digital gold’ (Harwick, 2014; Gertchev et al., 2013; Bergstra, 2014). Yermack (2013) note the weaknesses in Bitcoin as a currency and its moneyness and points out that cryptocurrencies have no intrinsic value.
By evaluating what adds to the value formation of cryptocurrencies Hayes (2015) said that the average amount of units which can be produced with a unit of hashing power is very important. A cryptocurrency may have a fixed rate set for unit formation over time, a ceiling, set into its code at its inception. The potential scarcity in terms of a fixed future ’money supply’ did not play a role in the value development.
The peer-to-peer technology and cryptographic algorithms allow a decentralized orga-nization and the information systems grant more operational security and are more transparent, thus against the centrally oriented and less transparent established mon-etary systems’ structures (Glaser et al., 2014). The digital currencies propose then, a move from the traditional design of financial system infrastructures. The financial innovation, the internet and several other developments allowed alternative curren-cies that are exclusively electronic and built on peer-to-peer mechanism, supporting near real time transactions, transparent unit formation by open algorithm and store of transactions historical log. Moreover, Brezo and Bringas (2012) says that cryptocur-rencies have the problem of being used for trafficking of illegal material and money laundering.
3.2
Bitcoins
As was defined by Nakamoto (2008), Bitcoin is an electronic financial mechanism that relies on a decentralized organizational structure providing features that are similar to a currency system, that has a specific money creation and transaction system. In contrast with the central bank’s discretionary decision making, the money creation in the Bitcoin system is clear and transparently executed by a distributed and open al-gorithm, simplifying the expectations about the future amount of money. By storing all transaction history in a ’chain’, the infrastructure grant near-real-time transaction monitoring using the public peer-to-peer network.
The Bitcoin’s popularity intrigued several economists in general (e.g. Grinberg, 2011; Barber and Odean, 2008; Kroll et al., 2013; Moore and Christin, 2013), while Bitcoin’s price formation intrigued in detail (e.g. Buchholz et al., 2012; Kristoufek, 2013; van Wijk, 2013). Previous literature showed that different factors may affect Bitcoin price: (i) market fundamentals like Bitcoin supply and demand (Buchholz et al., 2012); (ii) at-tractiveness for investors (Kristoufek, 2013); (iii) development of macroeconomic indi-cators (van Wijk, 2013). Buchholz et al. (2012) concluded that, as for of any currency, an important motive of Bitcoin price is the relation between Bitcoins’ supply and demand. The supply of Bitcoin sets the amount of units in circulation and thus its scarcity on the market. The demand of Bitcoin is mainly set by transaction demand as a way of exchange. Kristoufek (2013) says that because supply-demand fundamentals don’t ex-ist on Bitcoin markets, which usually shape the ground of currency price formation, the price development of Bitcoin shouldn’t be explained by classic economic theories. First, Bitcoin is not circulated by a specific government or central bank and thus is discon-nected from the real economy. Second, the supply-demand for Bitcoin is compelled by investors’ speculative behavior as well, because the lack of interest rate on digital cur-rencies, thus profits can be earned only from price modifications. Additionally, van Wijk (2013) emphasizes this idea, in determining Bitcoin price, the role of macroeconomics development (stock exchange indices, exchange rates, gold and oil prices) measures. van Wijk (2013) concludes that the euro-dollar exchange rate, the Dow Jones index and oil price have a significant impact on the value of Bitcoin in the long run. In opposition
to this, Ciaian et al. (2014) do not support previous findings that the macroeconomics developments are driving Bitcoin price.
Bouoiyour et al. (2014) described Bitcoin value by regressing its market price against a number of independent variables like, the market price of gold, the occurrences of the word ’bitcoin’ in Google searches, the number of transactions and so on. Generally, the variables when regressed, at the 5% level of significance, were not statistically significant. As for lags on the price of Bitcoin itself, they have some weight. Lagged Google search results were the only variable significant at the 1% level. This is an interesting finding, some variables that were expected to have value actually do not.
4:
A Description of The Data
The data collected comes from many different sources. The data necessary to perform this research comes from Wikipedia1, Twitter2, Google3, Blockchain4and Quandl5.
Time period: The time window to be analyzed in this study covers the range from
2011/26/06 through 2015/31/08 and includes a large fraction of early Bitcoin history and most importantly the growth phase of late 2012 and early 2014 to the more stable period of 2015.
4.1
Descriptive Statistics
Table A.1 shows some characteristics and properties that give us a better understand-ing of how to use the chosen variables in the model.
Figure A.6, which displays all our studied variables, offers a special view of the move-ment of the bitcoin price as well. The diagram for dBPI1, makes it clear that there is a great spread of return. We can see that in the end of 2013, December 7th and De-cember 9th, an extreme example where bitcoin exhibits a -18.65% return and 20.5%, respectively. We can observe the volatility clustering effect that is typical for financial assets. Analyzing in more detail the return distribution for the dependent variable of our model, the dBPI1, we see a daily mean of 0.14$, evidence of a relatively strong pos-itive trend in the last 4 years and standard deviation of 16.9$, consistent with a very volatile time-series The kurtosis and skewness suggests that the distribution has a high leptokurtic characteristics and is negatively skewed. Indicating that the distribution is not normally distributed.
We consider 3 main grouping vectors for our data: Bitcoin attractiveness; Bitcoin Eco-nomics and Technicals; and MacroecoEco-nomics variables
1http://stats.grok.se/ 2https://psychsignal.com/ 3 https://www.google.com/trends/explore#q=bitcoin 4 https://blockchain.info/ 5https://www.quandl.com/data/LBMA/GOLD-Gold-Price-London-Fixing
4.2
Bitcoin Attractiveness
To measure attractiveness, information demand of Bitcoin, and it´s speculative value we use the search volume reported by search engines like Google and Wikipedia and a weighted score for a sample of tweets that refer Bitcoin. This value is provided by a scoring algorithm called Sentiment Analysis from PsychSignal6.
Without any fundamental value and a perceived sensitivity to investor sentiment (Kris-toufek, 2013); (Baker and Wurgler, 2006), it is likely that the information of certain events may lead to swings in the Bitcoin price.
As seen in Figure 2.1, the Bitcoin price exhibits extremely high volatility and with no specific pattern. It is then feasible to assume that particular events add volatility to the Bitcoin price. By browsing the information on the Internet7 , and academic databases for information concerning Bitcoin, numerous events have been considered as important for the evolution of the Bitcoin market. Some of the chosen events are displayed in table 2.1.
Scanning the available information for reoccurring news, the ground of this selection is considered strong. However it is possible to perform an objective identification of other important events for the Bitcoin.
4.2.1 Search engines
The usage of Google searches using the word ‘Bitcoin’ and the page views on Wikipedia´s Bitcoin page , were demonstrated by Mondria et al. (2010) and Moat et al. (2013), to be a useful source of information in financial applications. The frequency of searches of terms related to the digital currency can be a good measure of interest in the currency and it can provide a reliable proxy have a good explanatory power.
For this study, we want to evaluate the frequency of searches for the word ‘bitcoin’, this data is downloaded from Google Trend and Wikipedia and covers the whole period of interest, from June 26th 2011 to August 31st 2015.
Many scientific studies have been performed using search queries, suggesting an
aca-6
https://psychsignal.com/
demic acceptance of this specific method. Daily data was desired but due to the con-struction of Google Trend, it is only possible to extract daily data for the three most recent months, and earlier search queries are only displayed on a weekly basis, a spe-cific adjustment factor was applied to transform it in daily data (ErikJJ, 2014). The data for Google searches uses a reference value of zero for the periods with very small amounts of search queries and 200 for the periods with very high amounts of search queries. As for Wikipedia, daily pageviews on the english Bitcoin page, are taken in consideration to evaluate the attractiveness of Bitcoin.
The investors’ attractiveness based on Google searches (GOO): To proxy the investors’ attractiveness to Bitcoin, we use daily Bitcoin searches from Google as it is capable of characterizing properly the speculative spirit of users, as it was stated by Kristoufek (2013). Additionally to that, it was chosen also by Bouoiyour et al. (2014), that used the number of times the key word Bitcoin is filed into the Google search engine. Google searches by day (normalized to 200) (see Figure A.1).
Total pageviews on Wikipedia (WIK): We adopt Wang (2012) that identified the group of specifically uninformed users, i.e., users who have only limited knowledge about Bitcoin, thus, search for initial information from an introductory source of information -Wikipedia. Like for GOO variable, we proxy the investors’ attractiveness to Bitcoin by measuring the daily hits on the English Bitcoin Wikipedia. Figure A.2 provides an overview on that metric.
4.2.2 Sentiment Analysis
Recent articles from Bollen et al. (2011), Kaminski and Gloor (2014) and Rao and Sri-vastava (2012) defend the existence of a relationship between the volume of tweets and the market evolution. There is a good chance of success that tweets can forecast the market trend 3-4 days in advance (Bollen et al., 2011). Over the last years significant progress has been made on ways to derive indicators of public mood directly from so-cial media content and in particular large-scale Twitter feeds and therefore create a sentiment tracking technique (Pak and Paroubek, 2010). We obtained a collection of public tweets that was recorded from June 26, 2011 to August 31st, 2015 and with that data we generated public mood time series using PsychSignal as a provider of real time
trader mood.
The tool acts by processing social media text, using a natural language engine that tries to assess the public’s mood about Bitcoin. The technology analyzes millions of online tweets on a daily basis, the sentiment engine, for this thesis, is designed to measure the attitudes "bullishness" and "bearishness" over Bitcoin, is the sentiment positive or negative? Taking into account users input on Twitter, the studied and distinct theory is to mix millions of phrases in a way comparable to Google, that is, examining the internet web structure by ranking and aggregating the link structure, the PsychSignal method creates a structure of world feeling by aggregating and scoring emotions. Once identified and combined, the system regularly scores the attitude or emotion, setting a specific rate. This allows us to create a detailed picture of people mood regarding Bitcoin, providing clues on the "bull" and "bear" feeling.
Twitter number of messages (TWI_M): Total messages per day where the hashtag “#Bit-coin” is present.
Twitter Sentiment Analysis (TWI_I): To conclude the proxy on investors’ attractiveness to Bitcoin, we apply, over the Twitter total number messages, the automatic Sentiment Analysis from PsychSignal (described above), on shared users tweets. Using the Psy-chSignal score, we automatically analyze people’s opinions, feelings, evaluations and attitudes. Assessing the tweets in order to see if the sentiment is Bullish, Bearish or Null (see Figure A.3).
4.3
Bitcoin Economics and Technicals
We obtain transaction data via the web-based Bitcoin data provider Blockchain that aggregates trades on a daily basis. Here we collected the close prices of Bitcoin as well as other technical variables that are relevant for the Bitcoin network (see Figure A.4 to compare Bitcoin price with Bitcoin technical variables)
The Bitcoin price (BPI): The close price of Bitcoin, in US dollars, collected daily. This will be the dependent variable in our model.
The exchange-trade ratio (ETR): Ratio between volumes on the currency exchange mar-ket and trade. Kristoufek (2015a) says that can be considered as transactions proxy,
while Bouoiyour et al. (2014) address whether Bitcoin is business income or not. The estimated output volume (EOV): The total value of all transaction outputs per day. Basically, Kristoufek (2015a), states that there is a negative relationship between the Bitcoin price and estimated output volume, i.e. an increase in output volume brings a drop in Bitcoin price notably in the long-run.
Bitcoins in Circulation (BC_Circ): Total number of bitcoins which have been mined up to August 31st, 2015 .
Average number of transactions per block (AVG_TR): As the difficulty of solving a block increases and the blocks get bigger so are the number of transactions occuring.
Miners Revenue(MINER): When a block is discovered, the finder (the miner) may award themselves a certain number of bitcoins, which is agreed-upon by everyone in the net-work, currently the award 25 bitcoins; this value will cut in half every 210,000 blocks, meaning each 4 years, because the network is designed to allow one block to be discov-ered each ten minutes.
Total number of unique Bitcoin transactions per day (TRAN): Is a transfer of Bitcoin value that is broadcast to the network and collected into blocks.
Number of unique Bitcoin addresses used per day (UA): Unique addresses in the net-work. Although addresses maybe generated all the time, it is still a relevant proxy for Bitcoin network size.
Difficulty (Diffic): Difficulty is a measure of how difficult it is to find a new block. This difficulty is adjusted by the network to guarantee that a block is discoverd each ten minutes
Hash rate (HASH): It´s a measure of the processing power of the Bitcoin network. For security goal and to solve blocks that get more and more complex, intensive mathemat-ical operations are needed, leading to an increase in the hash rate that is connected to an increase in cost with hardware. Bouoiyour et al. (2014) says that the hash rate is correlated positively to Bitcoin price .
4.4
Macroeconomics
Gold Price (GP): its underlying value derives from production or consumption process. On the other hand, demand for Bitcoin is compelled by its value in a future transaction. The demand for commodity currency, like gold, is driven by its intrinsic value and its value in a future exchange. Moreover, the changes in production technology (e.g. mining technology for gold) and returns affect the supply of commodity currency, making it endogenous. While Bitcoin supply is exogenous as it is set by the software (ceiling) algorithm.
5:
The Econometric Model
5.1
Econometric methodology
The asset returns are viewed as mean stationay by traditional models (standard and moving average deviation, among others) because it assumes that economic agents cre-ate their expectations the same way over time. It is of course well known that this allegation is far from reality, the variance-covariance of returns may be time-varying, during periods of great unrest (conflicting adjustments, crisis, political tensions, unfore-seen shocks, etc.). The usage of statistical tests to evaluate stationarity, the application of significance tests about the parameters of the model, the correlation coefficients, the autocorrelations, the analysis of volatility sensitivity to shocks and the analysis of volatility persistence will drive us to the optimal model selection. Besides, we will more skillfully handle the great deal of volatility that has been experienced by the Bitcoin returns.
5.1.1 First order difference
By analysing Figure 2.1 we could immediately determine that Bitcoin price is not sta-tionary, and to correct for stationarity first differences are applied, where ∆yt denotes the first-differenced series1:
∆yt= yt− yt−1 (5.1)
Whenever we are exposed to a non-stationary time series, and to transform our time series in a stationary one, equation 5.1 will be used, e.g., Figure 5.1 exhibit Bitcoin price after applying first differences (see Equation 5.1).
−100 0 100 2012 2013 2014 2015 Date Bitcoin Retur ns
Bitcoin first order difference
Figure 5.1: Bitcoin first order difference
The usage of unit root tests is a known method to find formal statistical evidence. Below we will see one of these tests in more detail.
5.1.2 Stationarity
The property of stationarity means that the first and second moment of time series, i.e., properties like the mean, variance and the autocorrelation function do not change over time. The stationarity is an important characteristic of the data, that for example, allows to reach conclusions about how a change in one time series variable impacts another one. Pindyck and Rubinfeld (1998) says that with stationarity it is feasible to model a process over an equation that has fixed coefficients and can be estimated with historical data . Because this thesis is concerned on how to model the Bitcoin price volatility using time series data, the existence of stationarity is of extreme importance. To test if a time series variable is I(1) we use the unit root test, that consists on applying an autoregressive model.
yt= θ + αyt−1+ εt (5.2)
Where: yt = current value of time series; θ = constant; α = real number (parameter); εt = independent random variable
We decided to use only one test in this study, the Augmented Dicker-Fuller (ADF) (Dickey and Fuller, 1979). The ADF test tests the null hypothesis that a time series
ytis I(1), one difference is required to obtain a stationary series, against the alternative that it is I(0), the time series is stationary on trend-stationary. The error term is also assumed to be homoskedastic.
If the test p-value is smaller than the level of the test (e.g. 5%), the null hypothesis of a unit root is rejected, which suggests that the time series is stationary. If the time series are I(1), first differences referred in 5.1.1, should be applied in order to convert the time series into a stationary one.
The ADF results for stationarity are summarized in table A.3 (we assume the existence of an intecept and a time trend). The test show that the variables Hash, BC_Circ, Diffic and MINER appear to be I(1). There was the need to perform first differences (see equation 5.1) on the time series data from these variables and then we test to see if we achieved stationarity.
As for the dependent variable BPI, there are signs of I(1) as well. Equation 5.3 shows α = 0.997, a figure very close to 1.
BP It= 0.716 + 0.997BP It−1+ εt (5.3)
Applying first differences, Equation 5.4, the dependent variable becames stationary, with α = 0.149.
dBP I1t= 0.119 + 0.149dBP I1t−1+ εt (5.4)
After applying the first order difference, the new variables list only displays values with a greater negative value, the correct conclusion is that after differencing Hash, BC_Circ, Diffic, MINER and BPI all variables are stationary time series. Figure A.6 shows a plot for all available time series.
5.1.3 Correlation Coefficient
To study the relationship between variables, the first differences variables are exposed to a correlation test. This test is important to detect collinearity, correlation between independent variables. Because we want to understand if our variables have an effect on Bitcoin price volatility, it is of major importance to study if there is collinearity between the variables included in our model.
The test outcome, shown in Figure A.5 and in table 5.1, suggests that there are several significant correlation between the available variables.
1 2 3 4 5 6 7 8 9 10
Var1 TRAN UA UA GP GP GP UA AVG_TR TRAN GP Var2 AVG_TR TRAN AVG_TR UA TRAN AVG_TR ETR ETR ETR ETR Freq 0.9232607 0.9213660 0.8971774 -0.8659558 -0.8252932 -0.7799055 0.5381808 0.5298560 0.5073037 -0.4701057
Table 5.1: Person Correlation - Top 10
Examining the table generated and displayed above, we can see that TRAN and AVG_TR show the strongest relationship. This corresponds to the significant value of 0.9232. The second strongest relationship is between UA and TRAN, 0.9213. Thirdly, is UA and AVG_TR, with 0.8971.
This therefore suggests that the result of the correlation test is evidence of a weak relationship. Judging from these results, the risk for multicollinearity is considered high.
5.1.4 Returns
The usage of asset returns (Bitcoin price returns by applying 5.1) is well-known and is preferred within financial studies. Mainly because asset return have more appropriate statistical properties like normalization and most of the times they are independent and identically distributed (i.i.d.) something that asset prices are not. This offers another angle of the movement of the Bitcoin price, with returns it is possible to discern the clustering effect that is common for financial assets and observe the volatility, where volatility is set as the standard deviation of the return (Hull, 2012).
5.1.5 GARCH(1,1)
The GARCH model is usually recognized as the most adequate to study the conditional variance. It uses three weighted averages: the long run, the forecast that was made in previous period and the new information that was not available when the previous forecast was made. We test the ARCH appropriateness within an auxiliary regression as proposed by Asteriou and Hall (2007).
The GARCH model consists of two equations: a conditional mean equation
rt= α0+ α1rt−1+ εt (5.5)
The conditional mean equation specifies the behavior of the returns, rt, and its error term, εt, represents the unexpected return. This conditional mean equation generates an estimation of the error terms from information provided by previous period’s return (Alexander, 2009).
The error term, εt−1, is then applied in the conditional variance equation. Together with the variance of previous period, σ2
t−1, it is then possible to estimate also the variance of the next period σ2
t. Where αi , βi and ω0 are the parameters to estimate
σ2t = ω0+ p X i=1 αiε2t−1+ q X i=1 βjσ2t−j (5.6)
αi measures the magnitude to which variance reacts to shocks and therefore goes through into next period’s volatility and ω0 measures the weighted long run average variance.
Stationarity:
αi+ βj < 1 (5.7)
and αi+ βj measures the rate at which this effect disappears over time, closer to the unit, slower will be the conditional variance convergence to a marginal variance. Since its inception, the GARCH model has been both extended and modified, but the simplest model, the GARCH(1, 1), is considered to be the most robust has claimed by Hansen and Lunde (2005).
5.2
The Econometric Model
The selected variables that come from applying stationarity tests, a time trend variable and correlation analysis generate the first econometric model. Conditional mean model:
dBP It = µt+ α1dBP It−1+ α2GOOt+ α3W IKt+ α4T W It+ α5dHash1t+ (5.8) α6AV GT Rt+ α7dDif f ic1t+ α8dM IN ER1t+ α9ET Rt+ α10T RANt+ α11U At+ α12GPt+ α13dBCCirc1t+ α14EOVt+ εt
And included in a GARCH(1, 1) model that is then fitted to the Bitcoin volatility regis-tered for the sample period and will thereby able to state, how the variables affect the Bitcoin volatility.
5.3
Expected Results
Given that the Bitcoin market is mainly consist of non-professionals we expect strong connection with web media content, that we use as proxy to evaluate the users senti-ment towards the currency. So Twitter, Google and Wikipedia should provide a positive influence on Bitcoin returns. Some technical variables like the total number of unique Bitcoin transactions per day (TRAN), Number of unique Bitcoin addresses used per day (UA) and the average number of transactions per block (AVG_TR), as seen in table 5.1 seem to have strong signs of correlation, and that occurs because of the techology behind Bitcoin market, where the more users come to the market more transactions will occur, moreover, as time passes it get harder to solve a block so more transactions are needed. The rational that we will be using is to remove from the model all the independent variables that have a high correlation.
It is our strong believe as well that the impact of web media content takes a distinct impact on the Bitcoin market, more specifically regarding the time it takes to the event occurring in GOO, WIK or TWI to influence Bitcoin returns.
Additionally, Gold Price (GP) is expected to have a positive sign, since usually this product is used has a save heaven that investor’s turn to when there is an economic crisis, and as we have seen in Table 2.1, some of the most relevent events for the Bitcoin market are connected to periods of unrest.
6:
The Empirical Results
6.1
GARCH(1,1)
The first output that we will analyze is the one coming from section 5.2, using the econo-metric model 5.8. After validating the variables for stationarity, we can now use them and study their ability to better understand the remarkable volatility of the Bitcoin price. As presented in section 5.1.5, we will use GARCH(1, 1) model, as it is considered the most suitable option for this kind of market.
Miu ar1 GOO WIK TWI_I ETR dHash1 TRAN UA GP EO
V
A
VG_TR
dDiffic1 dMINER1 dBC_Circ1 omega alpha1 beta1 Estimate 4.64 0.02 -0.06 -0.00 0.54 -0.03 -0.00 -0.00 -0.00 0.00 0.00 -0.00 0.00 0.00 -0.00 0.29 0.05 0.90 Std. Error 1.65 0.03 0.02 0.00 0.07 0.01 0.00 0.00 0.00 0.00 0.00 0.00 0.00 0.00 0.00 0.07 0.01 0.02 t value 2.82 0.48 -3.30 -0.64 7.73 -4.03 -1.24 -0.13 -1.28 0.52 0.32 -0.24 0.09 17.54 -6.58 4.39 9.60 50.49 Pr(>|t|) 0.00 0.63 0.00 0.52 0.00 0.00 0.21 0.89 0.20 0.60 0.75 0.81 0.93 0.00 0.00 0.00 0.00 0.00
Table 6.1: Results from GARCH(1,1) - Model 1
As expected some variables are not valid to our model (Table 6.1), TRAN, UA, EOV, AVG_TR and dDiffic1. Applying the high correlation rational referred in section 5.3 we will remove TRAN, UA and AVG_TR that correlate strongly with GP and ETR. Additionally, we pretend to find proof of predictability, to do that we need to understand if we can anticipate Bitcoin price. To achieve that we will lag social media data in one day.
dBP It = µt+ α1dBP It−1+ α2GOOt−1+ α3W IKt−1+ α4T W It−1+ α5dHash1t+ (6.1) α6dDif f ic1t+ α7dM IN ER1t+ α8ET Rt+ α9GPt+ α10dBCCirc1t+ α11EOVt+ εt
Miu ar1 dGOO1 WIK_1 TWI_I_1 ETR dHash1 GP EO
V
dDiffic1 dMINER1 dBC_Circ1 omega alpha1 beta1 Estimate -2.34 -0.01 0.00 0.00 0.09 -0.03 -0.00 0.00 0.00 0.00 0.00 -0.00 0.29 0.05 0.90 Std. Error 1.14 0.07 0.02 0.00 0.03 0.01 0.00 0.00 0.00 0.00 0.00 0.00 0.03 0.00 0.01 t value -2.06 -0.09 0.16 0.07 3.18 -3.30 -1.24 4.13 0.25 0.04 17.00 -4.50 11.13 11.73 77.72 Pr(>|t|) 0.04 0.93 0.87 0.95 0.00 0.00 0.22 0.00 0.80 0.97 0.00 0.00 0.00 0.00 0.00
Table 6.2: Results from GARCH(1,1) - Model 2
The results in table 6.2 show that GOO and WIK when lagged in one day became non significant, with a p-value higher than 5%. We will change the GOO and WIK lags to 31 and 7 respectively (one month; one week). EOV, dHash1 and dDiffic1 will be removed from the model as well.
dBP It = µt+ α1dBP It−1+ α2GOOt−31+ α3W IKt−7+ α4T W It−1+ (6.2) +α5dM IN ER1t+ α6ET Rt+ α7GPt+ α8dBCCirc1t+ εt
Miu ar1 GOO_31 WIK_7 TWI_I_1 ETR GP dMINER1 dBC_Circ1 omega alpha1 beta1 Estimate -0.04 0.06 -0.03 -0.00 0.01 -0.00 0.00 0.00 -0.00 0.00 0.15 0.85 Std. Error 0.27 0.04 0.01 0.00 0.01 0.00 0.00 0.00 0.00 0.00 0.01 0.01 t value -0.13 1.65 -3.92 -0.03 1.03 -1.05 1.42 7.82 -3.96 3.12 15.81 89.05 Pr(>|t|) 0.89 0.10 0.00 0.97 0.30 0.30 0.16 0.00 0.00 0.00 0.00 0.00
Table 6.3: Results from GARCH(1,1) - Model 3
Table 6.3 gives evidences that WIK, ETR, GP and dMINER1 can be removed from this model. Keeping our focus in two variables (GOO and TWI) that act has an attractive-ness proxy (see section 4.2) and one technical variable (BC_CIRC, see section 4.3).
dBP It = µt+ α1dBP It−1+ α2GOOt−31+ α3T W It−1+ α4dBCCirc1t+ εt (6.3)
Miu ar1 GOO_31 TWI_I_1 dBC_Circ1 omega alpha1 beta1 Estimate 0.12826200 0.15900404 -0.02546409 0.01361695 -0.00000738 0.00118106 0.15774186 0.84125814 Std. Error 0.02553776 0.03259479 0.00671383 0.00447652 0.00000280 0.00034953 0.01002751 0.00994862 t value 5.02244622 4.87820441 -3.79278442 3.04186323 -2.63429646 3.37895795 15.73091291 84.56029928 Pr(>|t|) 0.00000051 0.00000107 0.00014897 0.00235119 0.00843118 0.00072761 0.00000000 0.00000000
Table 6.4: Results from GARCH(1,1)
With a confidence level of 95%, it is thus highly unlikely that the result that we see in table 6.4 did happen merely by chance.
The time trend variable µtpresents a positive coeficient of 0.12826200, showing a bullish behavior for the Bitcoin returns since its inception. The Google engine search variables exhibits a slightly negative value of −0.02546441, suggesting a small effect on the Bit-coin return. When the google searches increases, there is a smoothing effect on the Bitcoin returns. More searches on Google for Bitcoin, higher is the knowledge of Bit-coin, then a decrease on volatility. The TWI_I has a similar coefficient, 0.01361695, suggesting a positive impact when the number and intensity increases so does the Bit-coin return. The number of BitBit-coins in circulation report a small impact on the BitBit-coin returns, −0.00000738, as expected an increase in the quantity of Bitcoins suggests a negative impact on the digital currency returns. We conclude that the GARCH(1, 1) model will have the following conditional mean equation:
dBP I1t = µt+ α1dBP I1t−1+ α2GOOt−31+ α3T W It−1+ α4dBCCirc1t+ εt (6.4)
Where dBP I1trepresents Bitcoin returns for period t, µt= 0.12826200, α1 = 0.15900404, α2= −0.02546441, α3 = 0.01361695,α4 = 0.00000738
While the conditional variance equation is:
σ2t = ω0+ α1ε2t−1+ β1σt−12 (6.5)
Where ω0 = 0.00118106 ,α1 = 0.15774186 and β1 = 0.84125814
The calculation above, in table 6.1, 6.2, 6.3 and 6.4, were performed using the assump-tion of normal distribuassump-tion.
6.2
Model Adequacy
The Ljung-Box test evaluates the presence of autocorrelation in the residuals of theGARCH(1, 1) model (see Equation 6.4), by displaying its ability to remove autocorrelation from the
6.2.1 Ljung-Box Test
Analysing Figure 6.1, were the correlograms of the squared residuals can be used to check autoregressive conditional heteroskedasticity (ARCH) in the residuals, no p-value is significant leading to not reject the null hypothesis.
1 3 5 7 9 11 13 15 17 19 21 23 25 27 29 31
ACF of Standardized Residuals
lag
A
CF
−0.06
0.02
GARCH model : sGARCH
1 3 5 7 9 11 13 15 17 19 21 23 25 27 29 31
ACF of Squared Standardized Residuals
lag
A
CF
−0.06
0.02
GARCH model : sGARCH
Figure 6.1: Time series dBP It- ACF of Standardized Residuals
As for the returns, their unpredictability and the clustering of volatility can be concisely shown by looking at autocorrelations in the observations (Figure 6.2). As stated by Engle (1982), the predictability may show up as significant autocorrelations in returns, and volatility clustering will show up as significant autocorrelations in squared returns.
1 3 5 7 9 11 13 15 17 19 21 23 25 27 29 31 ACF of Observations lag A CF −0.2 0.0 0.2
GARCH model : sGARCH
1 3 5 7 9 11 13 15 17 19 21 23 25 27 29 31
ACF of Squared Observations
lag A CF 0.0 0.3 0.6
GARCH model : sGARCH
The return autocorrelations are in some cases insignificant, while the square returns are all significant. This gives an evidence for some predictability of returns and volatil-ity clustering. Furthermore, the squared return autocorrelations are all positive which is highly unlikely to occur by chance.
Using the GARCH(1, 1) model refered in section 6.1 and suported by Figure 6.1, we can corroborate that this model is able to remove autocorrelation.
6.3
Analysis of Bitcoin prices - Predictability
As indicated by Fama (1965) and Malkiel (2003), prices should always reflect the funda-mental value of the asset and that information should not affect an investor’s capability to earn above-average returns. However, we know that Bitcoin has no fundamentals, and like it was argued in Chapter 2, supply and demand are the unique components that influenciate Bitcoin price.
With the existence of specific set of news that originates volatility and therefore in-dicating an increased dependence on information published about Bitcoin, we plan to understand how the web media data assist us on measuring the predictability of Bitcoin price.
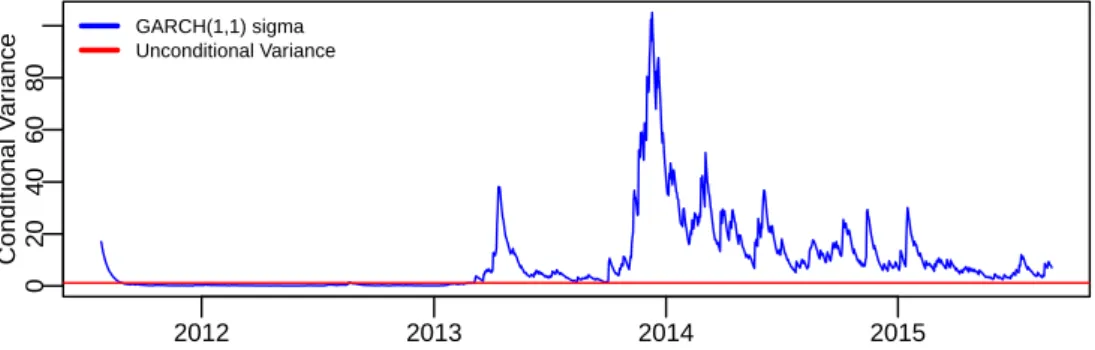
The convergence between the conditional variance series and the unconditional vari-ance line, Figure 6.3, its likely not to happen. The persistent parameters are too close to 1. Indicating that the conditional variance has a unit root, it is non-stationary, mean-ing that the mean and variance may change over time and may follow a trend.
2012 2013 2014 2015 0 20 40 60 80 Conditional V ar iance GARCH(1,1) sigma Unconditional Variance
The rise in volatility started as stock prices got higher and higher, with it’s peek around the end of 2013. Clearly, the Bitcoin market was risky from this perspective but in-vestors were willing to take this risk because the returns were so good. Only at the end of the sample, do we see substantial declines in volatility. This same volatile period can also be spotted when we compare it the events referred in Table 2.1 and Figure 2.1, as it looks that spikes in Bitcoin price seem to correspond with major events. The first small peak coincides with the Cyprus Capital controls and the second one is related to the Chinese search engine, Baidu, and their decision to accept payments in Bitcoin and its antagonic decision, plus the fact that the Chinese government declared that banks were not allowed to deal with bitcoin motivated strong up and down movements on Bitcoin price.
It is our belief that Bitcoin investors are risk taking and this implies that is decisive for them to keep track with the information flow.
Our empirical results, see table 6.4, confirmed that web content has a strong impact on Bitcoin volatility. The relationship is slightly negative for Bitcoins in circulation, implying that as the number of coins in the market increase, the Bitcoin returns de-crease, nevertheless the returns of Bitcoins in circulation moves quite close to Bitcoin returns. The Google engine search variables exhibits a slightly negative value, suggest-ing a small effect on the Bitcoin return. We may read this figure as, if Google searches increases, better is the knowleadge of Bitcoin, then a decrease on volatility. The TWI_I has a positive impact, suggesting a positive impact when the number and the positive comments intensity increases so does the Bitcoin return.
Moreover, the correlation between Bitcoin price and web content data give us some hints about the predictability power of these lagged variables, in reaction to positive and negative events. This can be considered as a logical reaction from investors to better understand the cause of the event and shorten the ambiguity produced by it. The positive events seem to have lead Bitcoin price to a continuous increase and per-haps even to an overpricing as a result of the optimistic investor sentiment.
Such overpricing is referred by Kristoufek (2013) as congruent with the Bitcoin market because it resides essentially of non-professional noise traders, whose actions can cause bubble behavior of the Bitcoin price. This kind of trading means a higher probability
of market inefficiencies (Stambaugh et al., 2012), that then boost the not optimal deci-sions, therefore increasing volatility when compared with more established markets. These unsophisticated noise traders are easily influenced by the behavior and expecta-tions of others (Kristoufek, 2013). Consequently, the Bitcoin market is more likely to experience enthusiasm and mimetic contagion1 (Topol, 1991). The bubble-behavior of the Bitcoin price could be a consequence of Bitcoin investors who overestimate the value of information and follow the behavior of others, originating a trading burst among in-vestors. The presence of noise, high volatility and predictability acts as a disturbance to the theories of efficient markets and random walk.
As the Bitcoin price has experienced such extreme volatility, and we have seen that 31 days lagged Google search data and 1 day lagged Twitter data was statistically signif-icant and with relative strong coefficients (see table 6.4), giving us the possibility to anticipate Bitcoin price. We can assume that Bitcoin price has evidence of predictabil-ity.
1Topol (1991) shows that mimetic contagion provides a mechanism for excess volatility. Imitative
be-havior under the name “mimetic rationality,” by developing models of mimetic contagion of investors in the stock markets which are based on irreversible processes of opinion forming.
7:
Conclusion
7.1
What drives Bitcoin value?
The Bitcoin currency, due to its extraordinary price growth, attracted the public atten-tion. Investors increased their interest because of possible profits of hundreds percent in just a few weeks. The market value kept building up supported by its high volatility that invited risk taking investors. The strong network effects that cause a high posi-tive trend, and the increased social media awareness, all this together, empowered the Bitcoin price, and, therefore, led the Bitcoin price.
By combining the information in the preceding chapters, we are able to discuss the cir-cumstances that may affect bitcoins price volatility. Supported by both literature and our own empirical results we found that both web content data and previous Bitcoin price variables have a significant impact on Bitcoin volatility. In addition, we found that the economics sensitivity, section 4.3, of the Bitcoin market is perhaps lower than initially assumed after the extensive data check, whereas Miner revenue seems quite connected to Bitcoin returns, showing revenue alternatives to Bitcoin investors. How-ever, our goal was to focus more on content provided by web content, through the prox-ies Google, Wikipedia and Twitter, and we found an explanatory power for the extreme Bitcoin price volatility on two of these variables.
We investigated how much the discussion on twitter precedes fluctuations on the stock market. To put it in other words, the question is how long it takes the stock market to react to the buzz on Twitter. How much investors anticipate their search in Google before investing, and how many days in advance do they express their sentiment about the Bitcoin phenomena on Twitter before going to the market. Our empirical analysis showed us that lagging 31 and 1 days, Google and Twitter, respectively, would be the wisest choice.
7.2
Why is Bitcoin volatile?
Our empirical research showed a close positive connection between web media content and Bitcoin price volatility. As we referred in the previous chapter, if investors are doubtful about their investment, they seek to decrease this ambiguity by increasing their knowledge/awareness. To measure that, we used proxies Google, Wikipedia and Twitter. As a consequence of this lack and pursue for knowledge, Bitcoin price volatility increases. Spikes on the online social media variables can be connected to the occur-rence several significant events on the Bitcoin universe, see main news on Bitcoin in table 2.1 and Figure 2.1. The characteristics of the so called risk taking investor and the non-professional noise traders ensures a strong probability of such behavior and prejudice their decision making process. Popularity and rapid growth plus the realiza-tion that a Bitcoin investment could be lost instantly because of hacks and technological difficulties are considered as very important for the Bitcoin volatility.
As it was explained in section 6.3, our results imply high presence of noise traders. In-creased trade volume and non-optimal decisions, can foment high volatility on Bitcoin price. Nevertheless, we believe that, like stated by Garcia et al. (2014), the positive trend of acceptance of Bitcoin should reduce its price volatility. During 2015 the Bitcoin market exhibited a more balanced price, suggesting that as the market gets more ma-ture, it becomes less uncertain for the investor. So, the risk of fads, mimetic contagion and bubbles should decrease over time.
7.3
What is the ability of the GARCH(1,1) model on the
Bit-coin price?
The significance and explanatory value of social media data and previous Bitcoin price were further examined through financial modeling using GARCH(1,1). The empiri-cal study was inspired by the research by Stråle Johansson and Tjernström (2014) and Kristoufek (2013). Our model, based on equation 6.5, where ω0 = 0.001187 ,α1 = 0.158687 and β1= 0.840313, showed clearly that the bulk of the information comes from the previous day forecast β1.
This means a large σ2
t−1tends to be followed by another large σ2t, generating, the well-known behavior, of volatility clustering in financial time series, the volatility is per-sistent or it “has” memory. Regarding α1 coefficient, as it is relatively big, it means that the volatility reacts intensively to the stock market shocks, meaning, the reaction coefficient or heterogeneity is considerable.
The long run average variance ω0 has a very small effect. Causing the unconditional or long run variance effect to be 1.228. Additionaly, with a persistence,λ = α1+ β1 , close to 1,particularly 0.99, volatility remains long.
We assume that the conditional variance has a very slow convergence with the uncon-ditional variance so that the process can be stationary with a finite variance. We could assume that this conditional variance model becomes non-stationary, see equation 5.7, originating an IGARCH(1, 1) model.
7.4
Is Bitcoin predictable?
News may be unpredictable but very early indicators can be extracted from online social media (blogs, Twitter feeds, etc.) to predict changes in various economic and commercial indicators. This may conceivably also be the case for the Bitcoin price.
However, the general notion of efficient markets “emphasizes a lack of return pre-dictability as the criterion for efficiency” (Chordia et al., 2008). Therefore, efficiency can be measured by the relative availability or predictable outsized returns. A perfectly efficient market would not have any return predictability, and therefore investors could not expect to beat the market.
The analysis over Figure 6.2, where the autocorrelations of the observed returns give us some idea of predictability, makes us relatively sure that Bitcoin price can be an-ticipated. Additionally, the statistical significance of the lagged social media variables, shows how we can preceed the Bitcoin price.
7.5
Recommendations For Future Research
There are several possibilities to extend the work presented in this thesis. Firstly, there is a small time frame in which the analysis is done due to the fact that the Bitcoin is
still quite new, which might render many conclusions made in this paper unsatisfying. Secondly, the independent variables used in this case may not effectively reflect the expectations and interests of agents in the currency. Other sources of web data could be used, like RSS feeds, Facebook posts, LinkedIn posts, Baidu trends, Wikipedia Bit-coin page in Chinese and YouTube video views. Using different kinds of variables, like different macroeconomic variables or data of other cryptocurrencies could also help us gaining a clearer interpretation on the Bitcoin phenomenon. Thirdly, we came across the idea that Bitcoin interest/attractiveness is affected by events. A more detailed study into this relation could prove informative, likely, the addition of binary variables to rep-resent some of these events (i.e. events from table 2.1) or a more thorough approach on the existent network effects on the Bitcoin phenomena could have improve the ex-planatory power of our model.
Additionally, a better estimator than GARCH(1, 1) could be used in the final analysis. For example, IGARCH, a restricted version of the GARCH model, is a highly suggested technique for analyzing data with serial correlation and where the persistent parame-ters sum up to one, and therefore the conditional variance becomes non-stationary in the GARCH process, or in our case, the convergence to a marginal/unconditional vari-ance takes longer to achieve.
Therefore, if the Bitcoin market keeps maturing, evaluating these same variables or adding some of the proposed variables above, could be relevant. Also, comparing the differences and similarities between an emerging market and a mature market could be insightful.
Bibliography
Alexander, C. (2009). Market Risk Analysis, Value at Risk Models, Volume 4. John Wiley & Sons.
Asteriou, D. and S. G. Hall (2007). Applied econometrics: A modern approach using eviews and microfit revised edition. Palgrave Macmillan.
Baker, M. and J. Wurgler (2006). Investor sentiment and the cross-section of stock returns. The Journal of Finance 61(4), 1645–1680.
Barber, B. M. and T. Odean (2008). All that glitters: The effect of attention and news on the buying behavior of individual and institutional investors. Review of Financial Studies 21(2), 785–818.
Bergstra, J. A. (2014). Bitcoin: not a currency-like informational commodity.
Bollen, J., H. Mao, and X. Zeng (2011). Twitter mood predicts the stock market. Journal of Computational Science 2(1), 1–8.
Bollerslev, T. (1986). Generalized autoregressive conditional heteroskedasticity. Journal of econometrics 31(3), 307–327. Bouoiyour, J., R. Selmi, et al. (2014). What bitcoin looks like? Munich Personal Repec Archive Paper (58091).
Brezo, F. and P. G. Bringas (2012). Issues and risks associated with cryptocurrencies such as bitcoin.
Buchholz, M., J. Delaney, J. Warren, and J. Parker (2012). Bits and bets, information, price volatility, and demand for bitcoin. Economics 312.
Chordia, T., R. Roll, and A. Subrahmanyam (2008). Liquidity and market efficiency. Journal of Financial
Eco-nomics 87(2), 249–268.
Ciaian, P., M. Rajcaniova, and d. Kancs (2014). The economics of bitcoin price formation. arXiv preprint
arXiv:1405.4498.
Dickey, D. A. and W. A. Fuller (1979). Distribution of the estimators for autoregressive time series with a unit root. Journal of the American statistical association 74(366a), 427–431.
Engle, R. F. (1982). Autoregressive conditional heteroscedasticity with estimates of the variance of united kingdom inflation. Econometrica: Journal of the Econometric Society, 987–1007.
ErikJJ (2014, May). Daily google trends data. http://erikjohansson.blogspot.fr/2014/05/
daily-google-trends-data-using-r.html.
Fama, E. F. (1965). The behavior of stock-market prices. Journal of business, 34–105.
Fama, E. F. (1970). Efficient capital markets: A review of theory and empirical work*. The journal of Finance 25(2), 383–417.
Garcia, D., C. J. Tessone, P. Mavrodiev, and N. Perony (2014). The digital traces of bubbles: feedback cycles between socio-economic signals in the bitcoin economy. Journal of the Royal Society Interface 11(99), 20140623.