Margarida Abreu & Victor Mendes
The Investor in Structured Retail Products:
Marketing Driven or Gambling Oriented?
WP19/2017/DE/UECE _________________________________________________________ Department of Economics
W
ORKINGP
APERSThe Investor in Structured Retail Products:
Marketing Driven or Gambling Oriented?
Margarida Abreu1
Victor Mendes2
JEL codes: G02; G11; G12 ; G41
Keywords: structured retail products; behavioral finance; overconfidence; gambling; marketing 1 ISEG, Universidade de Lisboa and UECE. ISEG ‐ Universidade de Lisboa, Department of Economics; UECE – Research Unit on Complexity and Economics, R. Miguel Lupi 20, 1249‐078 Lisbon, Portugal, email: [email protected]. UECE is supported by the Fundacão para a Ciência e a Tecnologia (Portuguese Foundation for Science and Technology). This article is part of the Strategic Project (UID/ECO/00436/2013). 2 CMVM‐Portuguese Securities Commission and CEFAGE‐EU.
The Investor in Structured Retail Products:
Marketing Driven or Gambling Oriented?
Abstract
Structured retail products (SRP) are one of the most visible faces of financial innovation and are becoming increasingly popular amongst retail investors. However, there is strong consensus that retail investors’ preference for structured products is difficult to explain using the standard rational theory, those products being in general sold at a significant premium. Studying the actual trading behavior of individual investors we provide evidence consistent with the view that SRP likely offer value to some informed investors compared to other products, that product complexity is a way to complete markets and that SRP allow investors to access segments otherwise not available to them. Nonetheless, our results also suggest that the increasing popularity of SRP is deeply related to investors’ behavioral biases, particularly overconfidence and gambling. Moreover, results also show that SRP trading activity cannot be dissociated
The Investor in Structured Retail Products:
Marketing Driven or Gambling Oriented?
1. Introduction
Structured retail products (SRP) are one of the most visible faces of financial innovation and are increasingly popular amongst retail investors. The number of SRP issued in Europe has been rising in recent years, reaching more than 850,000 in 2011. However, it is by now well established that these products are generally sold at a significant premium. Bergstresser (2008), Bernard et al. (2010), Grünbichler and Wohlwend (2005), Henderson and Pearson (2011), Jørgensen et al. (2011), Szymanowska et al. (2009), Wallmeier and Diethelm (2008), among others, address the subject of the pricing of different SRP in different markets and contexts and conclude that these products are persistently overpriced.
Some arguments have been put forward that might justify the rationality of the increased retail demand for SRP. The low interest rate environment creates incentives to search for yield (Kiriakopoulos and Mavralexakis 2011), and structured products that promise a high maximum return may be purchased. SRP’s ability to offer exposure on some asset classes and market segments that are otherwise not available for retail investors (Schneider and Giobanu 2010), as well as taxation (Nicolaus 2010), may also foster demand.
However, many other researchers claim that investors’ preferences to SRP depart from the standard rational expectations theory. It is the case of, for example, Henderson and Pearson (2008), Hens and Rieger (2011), Nicolaus (2010), Szymanowska et al. (2009), and Vanini and Dobeli (2010). As Herderson and Pearson (2008) put it, “it is
difficult to rationalize investor demand for structured equity products within any plausible normative model of the behavior of rational investors”. In this line of research,
we think that the increasing popularity of SRP can be better explained by behavioral factors like the mental accounting bias, overconfidence or desire for gambling. Das and
Statman (2012) argue that SRP can help improve portfolio allocation for investors with a mental accounting bias. According to this behavioral perspective, portfolios are composed of mental account sub‐portfolios, each associated with a particular objective. Investors optimize each mental account by finding the assets and the asset allocation that maximize the expected return of each mental account sub‐portfolio, such as retirement income or bequest. Some other behavioral biases may also explain the over investment in SRP, like investors’ overconfidence or love for gambling. Overconfident investors have been associated with excessive risk taking (Dorn and Huberman 2005; Nosic and Weber 2010), that meaning they are more prone to take on risk for which there is no apparent reward and consequently more prone to invest in SRP. Similarly, recent research postulates that some individual investors view trading in the stock market as an opportunity to gamble. For instance, Barber et al. (2009) document that the introduction of the government‐sponsored lottery in Taiwan did reduce the stock market turnover by about a quarter, apparently showing that part of the excessive trading of individual investors is motivated by their gambling desire.
Related to this literature, recent works on individual financial literacy seem to show that the higher the individual financial knowledge, the more efficient and rational will be her/his financial behavior, such as planning and saving for retirement (Lusardi and Mitchell 2009), investing in the stock market (Christelis et al. 2010) or diversifying portfolio (Abreu and Mendes 2010).
Another stream of literature emphasizes the aggressive marketing strategies as the main reason for the increasing popularity of SRP. But, how do issuers and distributers convince retail investors to buy these persistently overpriced structured products? Quite often, the selling pressure imposed by financial intermediaries conditions the marketing of SRP, thus influencing the demand. Aggressive marketing is not uncommon because financial intermediaries’ profits from SRP are higher than profits from other products (Kiriakopoulos and Mavralexakis 2011). Chang et al. (2010) reports that financially illiterate retail investors are in essence pulled by product distributors regardless of the product’s costs. Sometimes SRP offer capital protection and this may allow high risk aversion investors to invest in these products by looking only at the potential upside of returns. The literature produced on the subject focuses on investors’
misperception of the enclosed risks and on the poor ex‐post performance of SRP. In fact, the retail investor may not have the expertise to understand the complexities of these products, to compute or estimate the probabilities of the different pay‐offs of the products, and misunderstands them. Issuing firms, on the other hand, may introduce complexity to exploit uninformed (Henderson and Pearson 2011) or naïve investors (Campbell 2006) and to extract consumer surplus (Carlin and Manso 2009), and as a result are able to overprice them.
In the United States, the Securities and Exchange Commission (SEC 2011) issued a report that summarizes the results of an examination of the retail structured products placed by several broker‐dealers. It was concluded that “sales of structured products to
retail investors … may continue to increase as they are marketed as a higher return investment alternative” and that broker‐dealers might have recommended unsuitable
structured securities products to retail investors and traded at prices disadvantageous to retail investors.
In spite of the increased relevance of SRP for retail investors, little is known regarding the profile of those most likely to invest in these complex financial instruments and there is little evidence on the real impact of aggressive marketing or of overconfidence and the desire for gambling on the trading of SRP. For example, are wealthier, or more experienced investors less likely to invest in SRP and thus less likely to “get hurt” by the mis‐seling practices of financial intermediaries? Do less knowledgeable investors invest more in SRP? Among those who invest in SRP is there any difference between those who trade more often and those who trade more infrequently? What is the impact of the marketing of these products on the popularity of SRP? Are overconfident investors more prone to SRP assets? In this paper we will answer these questions with the help of a proprietary dataset of one of the largest Portuguese financial intermediaries which documents the history of individual investors' trades in securities over more than a decade. The information in the database includes detailed socio‐economic and financial information on individual investors who traded in securities at least once over the period January 1997 – April 2011.
In this context, this study contributes to characterizing the profile of individual (ie, non‐institutional) investors in SRP. Using data from the Portuguese market, this paper aims to answer the following questions: What are the main socio‐demographic characteristics of SRP investors? What is the influence of some investors’ behavioral biases (overconfidence and gambling) in characterizing the investor in SRP? What is the impact of marketing on the sale of these products? Does the level of investors’ financial literacy have any influence on SRP trading activity?
This paper contributes to the existing literature on structured retail products in some important aspects. Firstly, the design of our research combines actual trading behavior of individual investors with a survey of individual investors conducted by a securities regulator. Secondly, as far as we know this is the first study that analyzes whether investors in SRP are different than other investors, thus filling a gap in the academic literature. Thirdly, and more important, we test the validity of some theoretical hypotheses put forth to explain the investment in SRP by retail investors. It is the case of overconfidence, gambling and the marketing of these products. We start out documenting that investors in SRP have different socio‐demographic characteristics than investors in other financial instruments. We then test the impact of financial literacy on the investment in SRP and conclude that more knowledgeable and sophisticated investors are more likely to invest in SRP. This is consistent with the idea that if product complexity is a way to complete markets, then more knowledgeable and sophisticated retail investors will be offered (and will invest in) more complex structured products. We also conclude that overconfident investors participate (and trade) more in the structured retail product market, and that the contact between the product distributor and the investor is most relevant. Therefore, marketing is a strong determinant of the investment is SRP thus providing a rationale for overpricing. Finally, our results allow us to conclude that gambling may justify investors’ irrationality when they opt for SRP.
The study is structured as follows: The next section describes the database used. The third section traces the socio‐demographic profile of investors in SRP, making a comparison with equity investors and the general Portuguese population. In section 4 alternative models are estimated to help define the profile of investors in SRP and
evaluate the influence of behavioral traits in this characterization. In the last section some final conclusions are drawn. 2. The database The main database used in this study contains information from one of the top five Portuguese banks. The information relates to the accounts of individual investors that were active in late April 20113 and includes socio‐demographic data (marital status, birth date, gender, education, occupation and residence) on the first account holder and on the existence (or nonexistence) of deposits, consumer loans and mortgages associated with the account holders. In addition, we obtained information on all transactions in financial instruments linked to these accounts for the period 02/January/1997 to 30/April/2011, including the date of the transaction, the transaction type (purchase or sale), the ISIN code of the financial instrument, the quantity traded and at what price. For a comparison with the corresponding characteristics in the Portuguese population data from the 2005 INE Statistical Yearbook and the 2001 Census are used.
A different database is also used. It comes from a survey conducted by CMVM (the Portuguese Securities Commission) to identify the characteristics of individual Portuguese investors.4 The most recent one was conducted in 2000, and was publicly
released in May 2005 on the CMVM website. More than fifteen thousand individuals were contacted between 2 October and 22 December 2000 using the direct interview technique. These individuals were responsible or co‐responsible for family investment decisions. 1,559 investors in securities were identified. All of these investors were interviewed using a structured questionnaire.5 Each questionnaire included socio‐
economic questions, questions related to the nature and type of the assets held6 and 3 In general, investors and depositors do not formally close their bank accounts; when they do not want to continue their banking relationship with a certain bank, they just bring their balance and portfolio down to zero. This characteristic of investors alleviates any potential concerns with survivorship bias. 4 The survey identifies an investor in securities as one holding one or more of the following assets: stocks, bonds, mutual funds, participation certificates and derivatives. 5 However, non‐investors in securities were not all interviewed: a different questionnaire was used with 1,200 non‐investors only. 6 Unfortunately, there are no questions related to the size of the portfolio, nor the amounts invested in each type of asset.
investor experience, as well as questions related to trading behavior (frequency of transactions, acquisition of information, etc.) and to investors’ information about markets and their agents, and sources of information used. We use this database to compute proxies for overconfidence, gambling attitude towards the investment in financial products, and the marketing of SRP. We define overconfident investors as those who are better than average, that is, those who believe that they know more than they actually do, this being measured by the difference, if positive, between self‐ reported and actual financial knowledge.7 We consider that investors do have a
gambling attitude when they do not get any information regarding financial markets and products and yet they invest in financial products. Finally, we build a proxy for product marketing based on the fact that some investors go personally to the bank to talk to their account manager to get informed on financial products’ matters.8
In the period of about fifteen years covered by the database, there were 32,843 investors who traded SRP.9 In the same period there were 448,746 who traded stocks.
This means that for every 14 equity investors only one traded SRP, which is to say that the market of these financial instrument is composed of a small percentage of the Portuguese population. This may reflect the programs of privatization carried out by successive governments (which was somehow associated with the term 'popular capitalism') that led many Portuguese families to invest in the stock of firms being privatized during this period, as well as the greater complexity of SRP (in comparison with stocks) that discouraged the investment in this financial instrument. 7 Other proxies have been used in the literature. Goetzmann and Kumar (2008) and Bailey et al. (2008), for example, classify an investor as overconfident if her/his trading activity is in the top quartile of the distribution on investors’ trading activity and if her/his performance is in the bottom quartile of the distribution on investors’ performance. We cannot follow this procedure in this paper because not all investors have invested in stocks (for which we would be able to compute performance) and we do not want to leave aside investors with trading activity in other financial assets (mutual funds, bonds, derivative products) for which we do not have complete information to compute performance on those investments. 8 See the Annex for the methodology to ‘construct’ the overconfidence, gambling and marketing variables. 9 Structured products can be defined as securities derived from (or based on) other securities, basket of securities, indices, commodities or foreign currencies. In this paper, certificates, convertible bonds and other non‐plain vanilla bonds (such as structured bonds), credit liked notes, ETF and warrants are considered SRP.
3. Socio‐demographic characterisation of investors in structured retail products
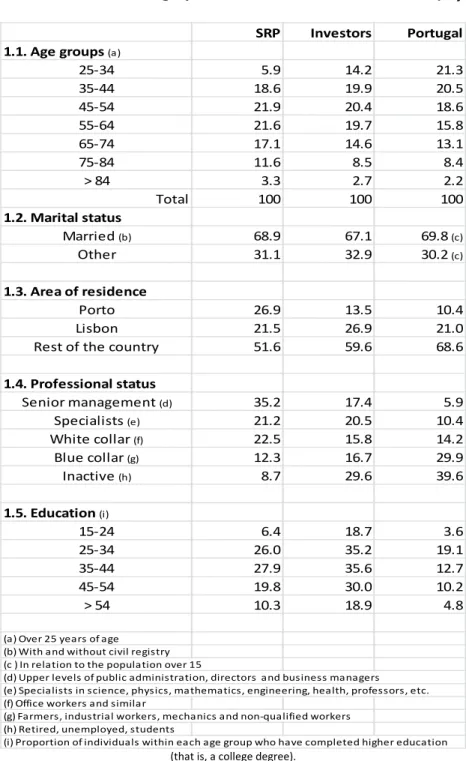
Unlike the demographics of the general Portuguese population and of most investors, less than 25% of the investors in SRP are younger than 45 (Table 1). Furthermore, albeit mostly married, SRP investors are married in a higher proportion than other investors (but lower than the Portuguese population), and mostly live in Porto. Finally, investors in SRP have more qualified occupations than most other investors and have a higher education level than the Portuguese population since, for all age groups, the proportion of individuals who have completed higher education is higher for investors in SRP (but lower than other investors). [Table 1 here] These socio‐demographic characteristics of investors in SRP lead to the conclusion that the average investor seems to have a risk profile that does not fit the financial instrument that is traded. The literature considers that the more risk‐tolerant behavior is associated with younger investors who do not have family responsibilities within marriage, whereas more qualified professions are generally associated with a higher income level and permit taking higher risks.10 On the other hand, higher levels of
education may be positively associated with greater sophistication, a necessary (but not sufficient) condition to better understand the characteristics of SRP. [Table 2 here] Among the sample there are some investors who invested in SRP only sporadically and others who can be designated ‘heavy traders’. In fact, 52.7% have only invested in one SRP (one ISIN code) throughout the sample period, while 3.6% have invested in more than 50 different SRP (that is, more than 50 ISIN codes). These two types of
10 Barber and Odean (2001) and Goetzmann and Kumar (2008) report evidence that married investors,
investors also have different demographic characteristics. Table 2 shows that, compared to occasional investors, the heavy traders are younger, are married to a lesser extent, mostly reside in Lisbon, and are more educated. However, there is no linearity in the structure of occupations in both groups (although blue collar and inactive workers trade relatively less). 4. Multivariate analysis 4.1. Are investors in SRP different than other investors? This section presents the results of a multivariate analysis. A probit model is used to distinguish the characteristics of investors in SRP among the characteristics of other investors. For this purpose only investors who have traded in financial instruments in the period January/1997 to April/2011 are selected from our database, residents abroad having been excluded. We end up with 560,005 investors in financial instruments, of which 31,022 traded at least one structured retail product during the period covered by the database. Our base model has the following specification: SRP = f (Male, Age, Married, Education, Occupation, Place of Residence, Mortgage, Consumer loan) where11 SRP = 1, if the investor trades in structured retail products during the period; Male = Gender. Is equal to 1 if male; Age = Age of investor. Defined as 2011 minus year of birth of the account holder; Married = Marital status of the investor. Equals 1 if married; Education = Years of education. Four categories are considered: Low = 1, if less than 4 years of education; Basic = 1, if 4 to 6 years of education; Intermediate = 1, if more than 11 The database does not include any variable directly linked to wealth or income of the investor, which prevents the consideration of this aspect in the analysis.
6 but 12 or less years of education; High = 1, if a technical or higher course was completed;
Occupation: Four categories are considered: Highly skilled = 1, if the investor is a business manager, director, is in the upper levels of public administration or is a specialist in science, physics, mathematics, engineering, health, professor, etc; Skilled = 1, if the investor is an office work or similar or is farmer, industrial worker, mechanic or non‐ qualified worker; Students=1 if the investor is a student; Inactive = 1, if retired or unemployed; Place of Residence: Lisbon = 1 if residing in Lisbon; Porto = 1 if residing in Porto; rest of the country = 1 if residing elsewhere; Mortgage = indicator of mortgage. Equal to 1 if the investor has a mortgage; Consumer loan = indicator of loan. Equal to 1 if the investor has a consumer loan. In fact, it has been shown that investors’ behavior depends on socio‐economic characteristics: age (DaSilva and Giannikos 2004), occupation (Christiansen et al. 2008) or the environment in which they live (Goetzmann and Kumar 2008). Calvet et al. (2009) concludes that seemingly irrational behavior diminishes substantially with investor wealth.
The probit model is estimated by maximum likelihood.12 The results are shown
in Table 3, column [1]. Our model includes the basic variables related to socio‐ demographic characteristics of investors. The results indicate that, conditioned to investors in financial instruments13, not‐married men living in Porto who have more
academic qualifications have a higher probability of being investors in structured retail products, the influence of age being non‐linear. Regarding occupations, the results show that highly skilled workers (students) have in general a higher (lower) probability to become investors in SRP than inactive people, and this could be explained by the
12 Regarding the educational level, occupation and place of residence, the omitted categories are,
respectively, less than four years of education, inactive and rest of the country.
13 In our sample we only include investors with trading activity (ie, with at least one trade) throughout the
existence of retired people among the inactive population. As for the existence of consumer loans and mortgages (which certainly affect the level of wealth of investors), these controls allow us to conclude that the investment is SRP is indeed influenced by the existence of loans. In short, investors in SRP are different than investors in other financial instruments. [Table 3 here] The literature considers that there are some other specific characteristics that influence investor behavior. Chang et al. (2010) finds that financially literate retail investors are more rational and include less structured products in the portfolio. Campbell (2006) argues that higher educated investors are less likely to make mistakes. Thus, more educated investors would be less likely to invest in SRP if the investment in SRP is indeed rational. However, if product complexity is a way to complete markets, then more knowledgeable investors will be offered more complex products and thus more sophisticated retail investors would buy more structured products.
We provide an empirical test for these predictions. Our model distinguishes those investors who may have greater knowledge of financial matters because of their education (economists) or occupation (business managers and bank staff). The variable "Literacy" is a binary variable equal to 1 if the account holder is an economist, or a business manager, or a bank officer. The hypothesis that financial literacy is a determinant of investment in SRP is not rejected. Thus, we conclude that more knowledgeable and sophisticated investors are more likely to invest in SRP (model [2]). This result is consistent with a view that, compared to other products, SRP likely offer value to some informed investors and that SRP are a way to complete markets and allow investors to access segments otherwise not available to them.14
14 We lack direct data on product pay‐offs, thus we are not able to directly test the view that these
products actually do add new assets, or merely replicate (potentially at lower transaction costs) existing assets. From our most recent knowledge of the Portuguese market it is probably both, but we are not able to disentangle them due to lack of information.
Our results are not ‘contaminated’ by overconfidence. When we control for the better than average effect (model [3]), we find that overconfident investors are more likely to invest in structured products, which is consistent with Coval and Shumway (2005) findings on future traders. An overconfident trader, overly wedded to prior beliefs, may discount negative public information that pushes down prices, thus holding on and taking on excessive risk.
It has also been argued that SRP are highly profitable for financial intermediaries (because they are sold to retail investors at above ‘fair or model’ price) and thus aggressive marketing of these instruments would not be uncommon (Kiriakopoulos and Mavralexakis 2011). Moreover, if the issuer’s profits are shared with the distributor then there are incentives for the distributor to ‘push’ the sale of SRP (Bernard et al. 2010). Subrahmanyam (2009) shows that distributors may delay educating inexperienced retail investors so as to earn more commissions. Szymanowska et al. (2009) posits that reverse convertible overpricing could be partly explained by behavioral factors such as marketing. Vanini and Dobeli (2010) claims that a communication style which uses behavioral finance insights in presenting a structured product is effective. Summing up, according to the existing literature, the contact between the product distributor and the investor contributes to the explanation of the popularity of SRP.
If financial intermediaries make relatively more money when they sell SRP and/or if there are incentives to ‘push’ the sale of SRP, then investors who get financial information from a bank are more likely to invest in SRP than other investors (because the bank is also a distributor of these products). We use the CMVM survey on retail investors to build a proxy for this effect (Marketing). Marketing is a binary variable equal to one if the investor goes personally to the bank to get information regarding financial markets and products (see details in the Annex). We conclude that indeed the marketing of SRP is a strong determinant of the investment is SRP for the marketing variable is highly significant (model [4]), thus providing a rationale for overpricing.
It has also been argued that gambling may justify investors’ irrationality when they opt for SRP. Bernard et al. (2010) attributes overpricing to the fact that retail investors may decide not to be informed about product complexity and thus choose randomly with the help of commission‐based incentivized distributors. Campbell (2006)
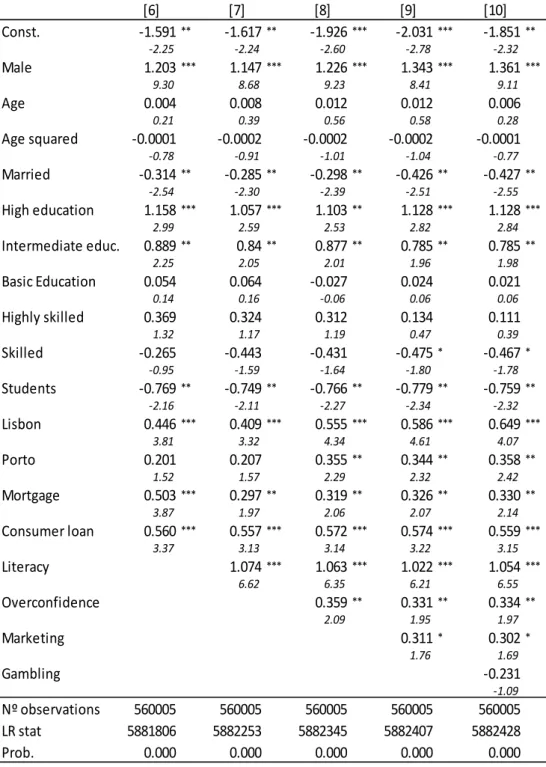
reports that either investors make random decisions or distributors are very successful in marketing and selling. Nicolaus (2010) documents a pattern of observations that is likely to be driven by speculative purposes rather than for hedging. We account for these possibilities and consider that investors who do not use any source of information at all to get informed about financial markets and instruments are gamblers and make random decisions. Our ‘gambling’ variable is the proxy we use. It is a binary variable, equal to one if the investor does not use any source to get information about financial markets and instruments (see details in the Annex). We conclude that these investors are more likely to have SRP in their portfolio (model [5]). 4.2. Is trading influenced by investor characteristics? We now turn to the possibility that the above mentioned characteristics may also play a role in the number of trades in SRP an investor makes. In fact, the retail investor makes different choices. One is the investment in SRP or in other financial products (also referred to as the decision to ‘participate’). Another is related to the number of trades in SRP (or ‘trading frequency’). Most of the SRP products are not liquid, in the sense that either there is not a secondary market (that is, the SRP is not listed and, if traded, the OTC market is used) or the SRP is listed but trading occurs very infrequently. This means that investors in these products generally buy SRP and hold them until maturity. Thus, the number of different SRP an investor trades (regardless of the amounts invested) during the sample period is a good proxy for the number of trades, and is our proxy for trading frequency. We use this proxy as the dependent variable in a count model in which the independent variables are those from the previous section. Our negative binomial count model is estimated by maximum likelihood and the results are in Table 4. [Table 4 here] In model [6] we use the base model, with socioeconomic variables only. There we can see that male, non‐married, more educated investors living in Lisbon and with loans trade more frequently than other investors, and that students trade less
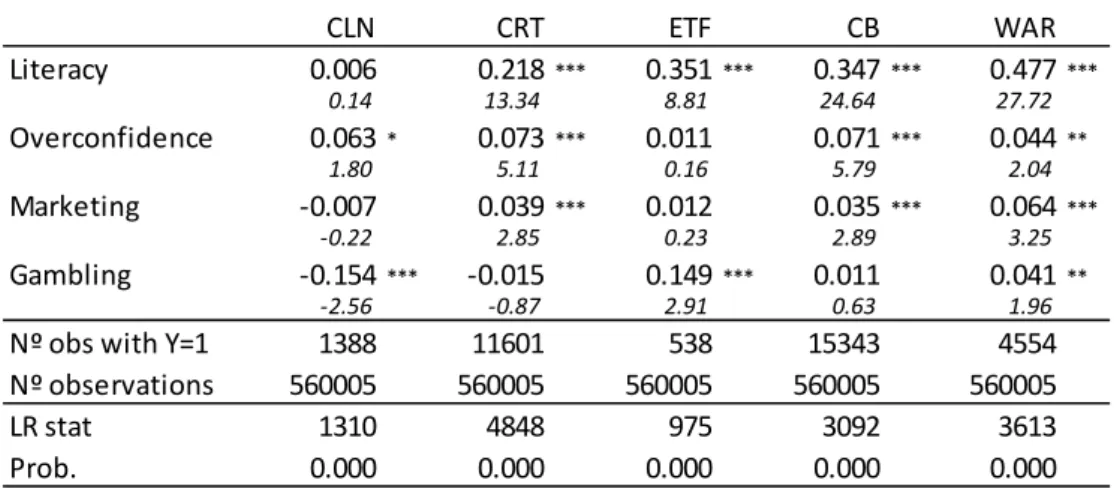
frequently. More importantly, more knowledgeable overconfident investors trade more, but those with a gambling attitude do not. On the other hand, the marketing of SRP increases trading frequency (at least at the 10% significance level). Thus, not only do we conclude that the socioeconomic characteristics of SRP investors and non‐investors are different but also that the trading frequency depends upon those characteristics. 4.3. Are investors in SRP similar regardless of the type of SRP? The literature considers that structured products are not all equal (see, for example, Nicolaus 2010, Kiriakopoulos and Mavralexakis 2011) and that demand is strongly influenced by product characteristics that should not matter to a rational investor (Nicolaus 2010). In this section, we test whether different investors invest and trade in different types of SRP (CLN – Credit Linked Notes; CRT – Certificates; ETF – Exchange Traded Funds; CB – Convertible Bonds; WAR – Warrants). [Table 5 here] In Table 5 – Panel A, we present the results of the determinants of the investment in different types of SRP for the main variables of interest and conclude that the investors in credit linked notes (notes without capital protection) are different than other SRP’s investors. Gambling conditions the investment in this type of SRP, but with an unexpected negative sign. We suspect that this can be attributed to the relatively low maximum pay‐offs of these notes, but we do not have information on the products pay‐offs to test for this possibility. On the other hand, the Literacy and the Overconfidence variables are significant in all but one SRP type, and the Marketing variable in all but two SRP types, thus confirming in general the results presented in section 4.1. As for the determinants of trading (Table 5 – Panel B), investors in credit linked notes are once again different than investors in other types of SRP, and the Gambling variable is not relevant in any regression, confirming in this case the results presented in section 4.2.
4.4. Robustness issues: Does complexity play a role?
Our next step is to account for the complexity of the products. For that purpose, we define a new variable (complex) which is equal to one if the investor only invests in less complex assets (time deposits and treasury bonds), is equal to 2 if he invests in stocks and capital protected bonds, does not invest in SRP but may have time deposits and treasury bonds, and is equal to 3 is he has SRP, regardless of his other investments. An ordered probit model is now estimated with complex as the dependent variable.15
Results are in Table 6 for the most relevant variables.
Our previous results are confirmed. In fact, financial knowledge, overconfidence, gambling and marketing are positively associated with the investment in more complex products. [Table 6 here] 5. Conclusions
There is strong consensus that retail investors’ preference for structured products is difficult to explain using the standard rational theory and that the increasing popularity of SRP can be better explained by behavioral factors. Overconfident investors are more prone to take on excessive risk for which there is no apparent reward and thus to invest and trade in SRP. Research also postulates that some retail investors view trading in the stock market as an opportunity to gamble. Moreover, it has been put forward that aggressive marketing strategies are the main reason for the increasing popularity of SRP.
The evidence we present in this paper is consistent with the view that SRP products likely offer value to some informed investors compared to other products, that 15 We alternatively define complex as one if the investor only invests in less complex assets (time deposits and treasury bonds), is equal to 2 if he only invests in stocks and capital protected bonds (and does not invest in any other assets), and is equal to 3 if he only invests in SRP (and does not invest in any other assets). Results are essentially unchanged and are not reported.
product complexity is a way to complete markets and that SRP allow investors to access segments otherwise not available to them. Nonetheless, our results also suggest that the increasing popularity of SRP is partially due to behavioral biases: gambling appears to be an important motivation for trading and overconfidence drives more trading in SRP. Results also suggest that aggressive marketing practices drives trading, thus providing a rationale for overpricing. Moreover, gambling may justify investors’ irrationality when they opt for some types of SRP. Our evidence on the impact of these behavioral aspects on the investment and trading of SRP is novel and helps one to understand how issuers and distributors of SRP use investors’ misperception of the involved risks and lack of expertise to increase product complexity and extract consumer surplus.
References
Abreu, M. and V. Mendes (2010), “Financial Literacy and Portfolio Diversification”,
Quantitative Finance 10(5), 515‐528.
Bailey, W., A. Kumar and D. Ng (2008), “Foreign Investments of US’ Individual Investors:
Causes and Consequences”, Management Science 54(3), 443‐459.
Barber, B. and T. Odean (2001), “Boys Will Be Boys: Gender, Overconfidence, and
Common Stock Investment”, Quarterly Journal of Economics 116(1), 261–292. Barber, B., Y. Lee, Y. Liu, and T. Odean (2009), “Just How Much Do Individual Investors Lose by Trading?”, Review of Financial Studies 22, 609–632. Bergstresser, D. (2008), “The Retail Market for Structured Notes: Issuance Patterns and Performance”, Harvard Business School. Bernard, C., P. Boyle and W. Gornall (2010), “Locally‐Capped Investment Products and the Retail Investor”, Working Paper, available at SSRN. Calvet, L., J. Campbell and P. Sodini (2009), “Fight or Flight? Portfolio Rebalancing by Individual Investor’’, The Quarterly Journal of Economics 124(1), 301–348. Campbell, J. (2006), “Household Finance”, Journal of Finance 61, 1553‐1604. Carlin, B. and G. Manso (2009), “Obfuscation, Learning, and the Evolution of Investor Sophistication”, Working Paper NBER. Chang, E., D. Tang and M. Zhang (2010), “Household Investments in Structured Financial Products: Pulled or Pushed”, Working Paper, University of Hong Kong.
Coval, J. and T. Shumway (2005), “Do Behavioral Biases Affect Prices?”, Journal of
Finance 60, 1‐34.
Christelis, D., T. Japelli and M. Padula (2010), “Cognitive Abilities and Portfolio Choice,”
European Economic Review 54, 18‐38.
Christiansen, C., J. Joensenand and J. Rangvid (2008), “Are Economists More Likely to
Hold Stocks?”, Review of Finance, 12(3), 465–496.
Das, S. and M. Statman (2012), “Options and Structured Products in Behavioral
Portfolios”, Journal of Economic Dynamics & Control, Available online 16 July 2012.
DaSilva, A. and C. Giannikos (2004), “Higher Risk Aversion in Older Agents: Its Asset
Pricing Implications”. Paper presented at the Financial Management Association 2005 conference, Chicago. Available at SSRN.
Dorn, D., and G. Huberman (2005), “Talk and Action: What Individual Investors Say and
What They Do”, Review of Finance, 9(4), 437‐481.
Goetzmann, W., and A. Kumar (2008), “Equity Portfolio Diversification”, Review of
Finance 12(3), 433–463.
Grünbichler, A. and H. Wohlwend (2005), “The Valuation of Structured Products:
Empirical Findings For The Swiss Market”, Financial Markets and Portfolio Management 19(4), 361‐380.
Henderson, B. and N. Pearson (2008), “Patterns in the Payoffs of Structured Equity
Derivatives”, Working Paper, AFA 2008 New Orleans.
Henderson, B. and N. Pearson (2011), “The Dark Side of Financial Innovation”, Journal
of Financial Economics 11, 227 ‐247.
Hens, T. and M. Rieger (2011), “Why do Investors Buy Structured Products?”, Working
Jørgensen, P., H. Nørholm and D. Skovmand (2011), “Overpricing and Hidden Costs of
Structured Bonds for Retail Investors: Evidence from the Danish Market for Principal Protected Notes”, Working Paper. Kiriakopoulos, K. and T. Mavralexakis (2011), “Structured Bonds and Greek Demons – Is the Attack ‘Fair’?”, Journal of Applied Finance and Banking 1(2), 231‐277. Lusardi, A. and O. Mitchell (2009), “How Ordinary Consumers Make Complex Economic Decisions: Financial Literacy and Retirement Readiness”, NBER Working Paper nº15350. Nicolaus, D. (2010), “Derivative Choices of Retail Investors: Evidence from Germany”, Working Paper. Nosic, A. and M. Weber (2010), “How Riskily Do I Invest? The Role of Risk Attitudes”, Risk Perceptions, and Overconfidence Decision Analysis, 7(3), 282‐301.
Schneider, R. and G. Giobanu (2010), “Capital‐Protected Structured Bonds”, The
Romanian Economic Journal 27, 69‐93.
SEC (2011), “Staff Summary Report on Issues Identified in Examinations of Certain
Structured Securities Products Sold to Retail Investors”, Securities and Exchange Commission.
Subrahmanyam, A. (2009), “Optimal Financial Education”, Review of Financial
Economics 18, 1‐9. Szymanowska, M., J. Horst and C. Veld (2009), “Reverse Convertible Bonds Analyzed”, Journal of Futures Markets 29(10), 895‐919. Vanini, P. and B. Dobeli (2010), “Stated and Revealed Investment Decisions Concerning Retail Structured Products”, Journal of Banking and Finance 34(6), 1400‐1411. Wallmeier, M. and M. Diethelm (2008), “Market Pricing of Exotic Structured Products: The Case of Multi‐asset Barrier Reverse Convertibles in Switzerland”, Working Paper, available at SSRN.
Table 1 – Socio‐demographic characterisation of investors (%) (that is, a college degree). SRP Investors Portugal 1.1. Age groups (a) 25‐34 5.9 14.2 21.3 35‐44 18.6 19.9 20.5 45‐54 21.9 20.4 18.6 55‐64 21.6 19.7 15.8 65‐74 17.1 14.6 13.1 75‐84 11.6 8.5 8.4 > 84 3.3 2.7 2.2 Total 100 100 100 1.2. Marital status Married (b) 68.9 67.1 69.8 (c) Other 31.1 32.9 30.2 (c) 1.3. Area of residence Porto 26.9 13.5 10.4 Lisbon 21.5 26.9 21.0 Rest of the country 51.6 59.6 68.6 1.4. Professional status Senior management (d) 35.2 17.4 5.9 Specialists (e) 21.2 20.5 10.4 White collar (f) 22.5 15.8 14.2 Blue collar (g) 12.3 16.7 29.9 Inactive (h) 8.7 29.6 39.6 1.5. Education (i) 15‐24 6.4 18.7 3.6 25‐34 26.0 35.2 19.1 35‐44 27.9 35.6 12.7 45‐54 19.8 30.0 10.2 > 54 10.3 18.9 4.8 (a) Over 25 years of age (b) With and without civil registry (c ) In relation to the population over 15 (d) Upper levels of public administration, directors and business managers (e) Specialists in science, physics, mathematics, engineering, health, professors, etc. (f) Office workers and similar (g) Farmers, industrial workers, mechanics and non‐qualified workers (h) Retired, unemployed, students (i) Proportion of individuals within each age group who have completed higher education
Table 2 – Occasional investors versus ‘heavy traders’ (%) 1 SRP >50 SRP 1.1. Age groups (a) 25‐34 3.9 11.9 35‐44 16.3 38.2 45‐54 23.0 25.0 55‐64 22.7 13.9 65‐74 17.8 7.1 75‐84 12.5 3.1 > 84 3.8 0.8 1.2. Marital status Married (b) 72.1 57.7 Other 17.9 42.3 1.3. Area of residence Porto 20.3 18.3 Lisbon 24.2 41.1 Rest of the country 55.5 40.6 1.4. Professional status Senior management (d) 36.6 24.4 Specialists (e) 17.5 26.6 White collar (f) 21.6 34.0 Blue collar (g) 14.5 7.5 Inactive (h) 9.8 7.6 1.5. Education Low (i) 56.3 31.9 Intermediate (j) 21.2 26.0 High (k) 22.5 42.1 (a) Over 25 years of age (b) With and without civil registry (c ) In relation to the population over 15 (d) Upper levels of public administration, directors and business managers (e) Specialists in science, physics, mathematics, engineering, health, professors, etc. (f) Office workers and similar (g) Farmers, industrial workers, mechanics and non‐qualified workers (h) Retired, unemployed, students (i) Four or less years of schooling (j) Between five and twelve years of schooling (k) Higher education completed
Table 3 – Determinants of investment in SRP – probit model Note: The dependent variable is a binary variable, equal to one if the investor trades in structured retail products during the sample period. The Overconfidence, Marketing and Gambling variables are constructed from the survey (see the Annex); all other variables are from the proprietary database. [1] [2] [3] [4] [5] Const. ‐2.077 *** ‐2.099 *** ‐2.177 *** ‐2.181 *** ‐2.248*** ‐37.45 ‐37.70 ‐38.54 ‐38.65 ‐39.03 Male 0.263*** 0.257*** 0.275*** 0.292*** 0.29*** 43.58 42.49 43.12 39.46 39.13 Age ‐0.003** ‐0.002* ‐0.002 ‐0.002 ‐0.0003 ‐2.36 ‐1.65 ‐1.49 ‐1.59 ‐0.22 Age squared 0.000*** 0.000*** 0.000*** 0.000*** 0.000*** 5.88 5.41 5.61 5.69 4.54 Married ‐0.043*** ‐0.047*** ‐0.049*** ‐0.068*** ‐0.067*** ‐6.40 ‐6.93 ‐7.18 ‐8.62 ‐8.53 High education 0.342*** 0.313*** 0.351*** 0.347*** 0.346*** 9.67 8.83 9.82 9.69 9.68 Intermediate educ. 0.196*** 0.197*** 0.232*** 0.215*** 0.219*** 5.56 5.57 6.52 6.01 6.12 Basic Education 0.078** 0.092*** 0.095*** 0.095*** 0.097*** 2.22 2.61 2.70 2.71 2.76 Highly skilled 0.195*** 0.189*** 0.179*** 0.153*** 0.158*** 7.07 6.87 6.50 5.46 5.63 Skilled 0.003 ‐0.034 ‐0.035 ‐0.042 ‐0.045 0.11 ‐1.22 ‐1.27 ‐1.52 ‐1.62 Students ‐0.083*** ‐0.070** ‐0.073** ‐0.074** ‐0.079** ‐2.58 ‐2.18 ‐2.26 ‐2.30 ‐2.46 Lisbon ‐0.030*** ‐0.043*** ‐0.015** ‐0.011 ‐0.029*** ‐4.48 ‐6.40 ‐2.07 ‐1.52 ‐3.58 Porto 0.095*** 0.089*** 0.121*** 0.122*** 0.119*** 13.15 12.41 15.16 15.21 14.89 Mortgage 0.180*** 0.143*** 0.143*** 0.142*** 0.142*** 21.65 17.19 17.12 16.99 16.97 Consumer loan 0.037*** 0.027** 0.027** 0.027** 0.027** 3.22 2.33 2.34 2.33 2.36 Literacy 0.394*** 0.395*** 0.392*** 0.388*** 34.90 34.91 34.61 34.24 Overconfidence 0.091*** 0.087*** 0.086*** 9.29 8.81 8.76 Marketing 0.045*** 0.05*** 4.64 5.11 Gambling 0.071*** 5.63 Nº obs with Y=1 31022 31022 31022 31022 31022 Nº observations 560005 560005 560005 560005 560005 LR stat 6814 7929 8015 8036 8067 Prob. 0.000 0.000 0.000 0.000 0.000 Obs: (i) z‐stats in italics ; (ii) *, ** and *** denote statistical significance at 10%, 5% and 1% respectively
Table 4 – Determinants of trading in SRP – count model
Note: The dependent variable is the number of different SRP an investor trades during the sample period. The
Overconfidence, Marketing and Gambling variables are constructed from the survey (see the Annex); all other variables are from the proprietary database. [6] [7] [8] [9] [10] Const. ‐1.591** ‐1.617** ‐1.926*** ‐2.031*** ‐1.851** ‐2.25 ‐2.24 ‐2.60 ‐2.78 ‐2.32 Male 1.203*** 1.147*** 1.226*** 1.343*** 1.361*** 9.30 8.68 9.23 8.41 9.11 Age 0.004 0.008 0.012 0.012 0.006 0.21 0.39 0.56 0.58 0.28 Age squared ‐0.0001 ‐0.0002 ‐0.0002 ‐0.0002 ‐0.0001 ‐0.78 ‐0.91 ‐1.01 ‐1.04 ‐0.77 Married ‐0.314** ‐0.285** ‐0.298** ‐0.426** ‐0.427** ‐2.54 ‐2.30 ‐2.39 ‐2.51 ‐2.55 High education 1.158*** 1.057*** 1.103** 1.128*** 1.128*** 2.99 2.59 2.53 2.82 2.84 Intermediate educ. 0.889** 0.84** 0.877** 0.785** 0.785** 2.25 2.05 2.01 1.96 1.98 Basic Education 0.054 0.064 ‐0.027 0.024 0.021 0.14 0.16 ‐0.06 0.06 0.06 Highly skilled 0.369 0.324 0.312 0.134 0.111 1.32 1.17 1.19 0.47 0.39 Skilled ‐0.265 ‐0.443 ‐0.431 ‐0.475* ‐0.467* ‐0.95 ‐1.59 ‐1.64 ‐1.80 ‐1.78 Students ‐0.769** ‐0.749** ‐0.766** ‐0.779** ‐0.759** ‐2.16 ‐2.11 ‐2.27 ‐2.34 ‐2.32 Lisbon 0.446*** 0.409*** 0.555*** 0.586*** 0.649*** 3.81 3.32 4.34 4.61 4.07 Porto 0.201 0.207 0.355** 0.344** 0.358** 1.52 1.57 2.29 2.32 2.42 Mortgage 0.503*** 0.297** 0.319** 0.326** 0.330** 3.87 1.97 2.06 2.07 2.14 Consumer loan 0.560*** 0.557*** 0.572*** 0.574*** 0.559*** 3.37 3.13 3.14 3.22 3.15 Literacy 1.074*** 1.063*** 1.022*** 1.054*** 6.62 6.35 6.21 6.55 Overconfidence 0.359** 0.331** 0.334** 2.09 1.95 1.97 Marketing 0.311* 0.302* 1.76 1.69 Gambling ‐0.231 ‐1.09 Nº observations 560005 560005 560005 560005 560005 LR stat 5881806 5882253 5882345 5882407 5882428 Prob. 0.000 0.000 0.000 0.000 0.000 Obs: (i) z‐stats in italics ; (ii) *, ** and *** denote statistical significance at 10%, 5% and 1% respectively
Table 5 – Determinants of investment and trading, by type of SRP Panel A: Determinants of investment (probit model) Panel B: Determinants of trading (count model) Note: In Panel A the dependent variable is a binary variable, equal to one if the investor trades in each type of SRP during the sample period. In Panel B the dependent variable is the number of different products of each type an investor trades during the sample period. The Overconfidence, Marketing and Gambling variables are constructed from the survey (see the Annex); all other variables are from the proprietary database. Included in all the models reported in this table are the controls used in model [1] of Table 3. Table 6 – Determinants of investment – ordered probit model Note: The dependent variable is Complex. The Overconfidence, Marketing and Gambling variables are constructed from the survey (see the Annex); all other variables are from the proprietary database. CLN CRT ETF CB WAR Literacy 0.006 0.218*** 0.351*** 0.347*** 0.477*** 0.14 13.34 8.81 24.64 27.72 Overconfidence 0.063* 0.073*** 0.011 0.071*** 0.044** 1.80 5.11 0.16 5.79 2.04 Marketing ‐0.007 0.039*** 0.012 0.035*** 0.064*** ‐0.22 2.85 0.23 2.89 3.25 Gambling ‐0.154*** ‐0.015 0.149*** 0.011 0.041** ‐2.56 ‐0.87 2.91 0.63 1.96 Nº obs with Y=1 1388 11601 538 15343 4554 Nº observations 560005 560005 560005 560005 560005 LR stat 1310 4848 975 3092 3613 Prob. 0.000 0.000 0.000 0.000 0.000 CLN CRT ETF CB WAR Literacy ‐0.111 0.877*** 1.588*** 1.023*** 0.948*** ‐0.49 10.58 3.85 7.57 4.66 Overconfidence 0.003 0.152** 0.079 0.291*** 0.412 0.02 2.12 0.18 4.56 1.58 Marketing ‐0.109 ‐0.029 0.796* 0.051 0.563** ‐0.66 ‐0.38 1.85 0.73 2.15 Gambling ‐0.299 ‐0.088 0.201 ‐0.021 ‐0.041 ‐0.97 ‐0.69 0.51 ‐0.39 ‐0.23 Nº observations 560005 560005 560005 560005 560005 LR stat 576396 475236 1647050 59104 5827721 Prob. 0.000 0.000 0.000 0.000 0.000 Obs: (i) z‐stats in italics ; (ii) *, ** and *** denote statistical significance at 10%, 5% and 1% respectively [11] [12] [13] [14] Literacy 0.326*** 0.323*** 0.312*** 0.302*** 29.88 29.89 28.64 27.68 Overconfidence 0.119*** 0.101*** 0.101*** 16.61 13.93 13.99 Marketing 0.195*** 0.202*** 27.17 28.08 Gambling 0.155*** 16.26 Nº observations 322024 322024 322024 322024 LR stat 23200 23479 24215 24478 Prob. 0.000 0.000 0.000 0.000 Obs: (i) z‐stats in italics ; (ii) *, ** and *** denote statistical significance at 10%, 5% and 1% respectively
Annex
We use the CMVM survey to construct proxies for overconfidence, gambling and
marketing variables. We define overconfidence based on the question: “How do you
rate, on a 1 (very low) to 7 (very high) scale, your own knowledge of financial assets and markets?” (Self‐evaluation). Answers to this question were compared with a financial knowledge variable measured in the 1 to 7 scale, which comes out of the survey as well. If the difference between self‐reported and actual knowledge is positive and greater than 0.9 then overconfidence = 1. We then regress this overconfidence variable on a set of socio‐demographic investor characteristics. The estimated coefficients of this model are used to estimate whether investors in our main database are (are not) overconfident, using the same socio‐demographic investor characteristics, and assuming that the percentage of overconfident investors is equal to the percentage of overconfident investors in the survey. Thus, overconfidence=1 for the investors with the higher score in the estimated overconfident model.
Similar procedures are used to construct the gambling and marketing variables. From the survey we define the socio‐demographic characteristics of the investors who do not use any source of information to get informed on financial markets and products (investors with a gambling attitude), and those of investors who get information on financial markets and products from the bank. Assuming that the percentage of gamblers (bank informed) investors in the survey and in the main database are similar,
gambling=1 (marketing=1) for the investors with the higher score in the estimated