Abstract—Market bubbles often occur around the same time that new means of investing become available to enable increased market participation. An important aspect of increased market participation is the possible introduction of new investors who behave differently from existing traditional investors. Preliminary evidence from a new data set constructed from publicly available information suggests that these new investors display social referencing behaviour – their investment decisions are based more on social information (e.g., members of their peer group have purchased a stock) and less on typical financial information (e.g., the price of a stock). During the internet bubble of the late 1990s, our collected data show how investors using newly introduced on-line brokerages may have invested differently than investors using traditional and established brokerages. Using this model, we simulate an influx of these new social referencing investor agents in a proportion that is similar to the market weight that new on-line investors had during the internet bubble. The ability of our model to cause a quantitatively accurate, multi-agent simulation of traditional investors to similarly produce a price bubble demonstrates the potential that multi-agent models can have to produce quantitative results for qualitative investor models.
Index Terms—hybrid multi-agent model, market manias, price bubbles, social investors
I. INTRODUCTION
In conventional models of financial asset prices, the price of equities reflects fully and accurately the existing information on the income earning potential of an asset. This “efficient market” outcome as explored by Fama [1]–[4] suggests that the present discounted value of the expected future income over the life of the asset – its “fundamental value” – will ultimately govern the asset’s market price. In addition to fundamentals-based investors, some models of market behaviour also include “noise” traders or “chartists” to help explain the excess volatility observed in stock markets. Chartists attempt to exploit short-term momentum in the movement of stock prices, and their actions (e.g., buying
Manuscript received October 8, 2010. This work was supported in part by the Natural Sciences and Engineering Research Council of Canada and York University.
S. Chen is with the School of Information Technology, York University, Toronto, ON M3J 1P3 Canada (phone: 416-736-2100 x:30526; fax: 416-736-5287; e-mail: [email protected]).
B. Spotton Visano is with the School of Public Policy and Administration and the Department of Economics, York University, Toronto, ON M3J 1P3 Canada ([email protected]).
M. Lui is with the Department of Physics, York University, Toronto, ON M3J 1P3 Canada ([email protected]).
C. Lu is with the Department of Economics, Carleton University, Ottawa, ON K1S 5B6 Canada ([email protected]).
when prices are rising, and selling when prices are falling) can exaggerate any movement in prices.
The presence of noise traders alters, however, neither the ultimate equilibrium market price for stocks (as fixed by the fundamental value of the underlying assets) nor the fact that the market will eventually reach it. In the extant literature, the formal introduction of “noise” traders creates a mean-reverting market dynamic to explain temporary deviations from fundamentals [5],[6]. The presence of noise traders can confound market dynamics to such an extent that under some conditions or for some time, it is profitable for the more sophisticated traders to disregard the intrinsic value of the asset, follow the herd, and thus contribute to the resulting asset bubble [7]. Alternatively, studies by Lux and Marchesi [8]–[10] which employ an agent-based model suggest that herding may explain the excess kurtosis observable in high-frequency market data.
Both fundamental and “noise” traders base their decisions solely on objective market information. Traditional financial models commonly exclude by assumption the possibility that investment activity may also be a social activity. In certain situations, and where individuals are motivated to belong to a group, the possibility of fads, fashions, and other forms of collective behaviour can exist. Spotton Visano [11] suggests that investing in equity markets is not immune from social influences, especially when investors face true uncertainty. Consistent with the early views of financial markets as “voting machines” when the future is uncertain [11],[12], Spotton Visano’s result explains the fad and contagion dimensions of investing which relate to Lynch’s [13] explanations of the recent internet bubble.
Investors in internet stocks in the 1990s faced considerable uncertainty about the future commercial prospects of the internet companies in which they were investing. As such their investment decisions would have been motivated by reasons other than the typical analysis of financial information which was contemporaneously unavailable. As “new” investors, facing an absence of financial information for this revolutionary industry, they would have been motivated by other sources of information. Emulating the behaviour of others in their social reference group is one such known motivation.
During the internet bubble, the internet itself enabled the increase in investor participation through on-line trading. Since many of these on-line brokerages were in fact central to the internet bubble, their quarterly reports offer valuable information about the manner in which the internet bubble unfolded. We extracted from these quarterly reports the data required to examine our hypotheses that both social referencing investor behaviour occurred and that this
Evidence and Effects of Social Referencing
Investor Behaviour during Market Bubbles
behaviour could have contributed to a bubble in the stock market.
Within the limits of such sparse and coarse data, we find preliminary evidence suggestive of two investor classes. There appears to have been some degree of investor differentiation and market segmentation. Inferences drawn from correlations in portfolio returns suggest that traditional investors using traditional brokerages such as Merrill Lynch invested in traditional stocks as represented by the S&P 500. New investors using new internet brokerages such as E*Trade appear to have invested primarily in internet-related stock portfolios as approximated by the NASDAQ. By the peak of the bubble in the spring of 2000, total assets invested through these new internet brokerages were equal to approximately 10 percent of the market capitalization of the NASDAQ [14].
Previous research describes in a qualitative manner how social referencing investor behaviour can affect market dynamics. Yet, quantifying the possible effects of these social influences eludes these models. Fundamentally, it is difficult to acquire quantitative results from a qualitative model. Even multi-agent models of the type used by Lux and Marchesi [8]–[10], for example, rely on mathematics-based aggregating equations to describe and constrain the overall behaviour of a set of agents.
In this paper, we employ a hybrid multi-agent model with both software-based agents and “slave” agents controlled by aggregating mathematical equations. This hybrid model allows the effects of qualitative investor behaviour (programmed into the software agents) to be observed within the context of a quantitatively accurate financial model. The overall goal is to explore the conditions necessary to reproduce market dynamics – such as the spike in stock prices observed during the internet bubble – by using a model that simulates the perceived market conditions as accurately as possible.
To the Lux and Marchesi model, we introduce a new class of investors. Whereas Lux and Marchesi restrict their analysis to one type of agent which can alternate between two investment strategies informed by either fundamentals or past price movements, we introduce a second type of investor agent which makes investment decisions based on social information alone. Specifically, these new investors are “social” investors which buy when they see others buying, and they sell when they see others selling. The number of new investor agents we add to the multi-agent model is equal to 10 percent of the number of existing traditional investor agents. Thus, the approximate market weight of social investors in our hybrid multi-agent model is equal to the market weight of internet-based investors during the internet bubble that we have estimated from our analysis of brokerage data. During our market simulation, the addition of the new social investors causes a spike in prices to occur. This simulated event represents new and unique evidence in support of the role that social referencing investor behaviour can have during market bubbles.
The background for the significance of this result is presented in section II which reviews several historical bubbles and the coincidental introduction of new means to increase market participation. We present the new data
compiled from quarterly reports for E*Trade and Merrill Lynch in section III and offer a preliminary analysis of it. Section IV details our development of a hybrid multi-agent model and how it is affected by the introduction of new social referencing investors. Although the introduction of the new investors creates the expected price spike, important limitations exist in both the brokerage data and the hybrid model, and these limitations are discussed in detail in section V. The paper concludes in section VI with a summary of key results, limitations, and future work.
II. BACKGROUND
Since the introduction of the formal financial system in the late 1600s, episodes of extreme market events periodically occur (e.g., fantastic speculative optimism driving up asset prices followed by recoil in pessimism and a market crash). A notable number of these episodes occur in liquid asset markets. Stock and foreign exchange markets, for example, are renowned for their potential to exhibit extreme market volatility.
Episodes of extreme market movements share other characteristics in common. The focus of the speculative enthusiasm often centers on assets directly related to an innovation of substantial material consequence. Easy credit on the upswing supports and feeds the exponential growth of asset prices. Credit constraints on the downswing have fed panics in the crash. The preceding speculative activity attracts substantial new interest in people previously unfamiliar with investing. Not uncommonly, this interest is encouraged and enabled by developments in the asset markets that increase the ease with which all investors can participate [11].
New means of investing that enable greater access to equity markets at a time when a spreading speculative enthusiasm is attracting attention to the markets can feed a market bubble. For example, in the early 1700s, the introduction of the joint stock company revolutionized social relations – for the first time wealth was obtainable by means other than birthright. The ability to purchase stocks on low margin created the possibility of pyramiding credit which financed investment in the 1920s. The introduction of discount brokerage services in the 1980s arguably contributed to the rising level of speculative activity in that decade. Most recently, in the 1990s, the introduction of investing via the internet contributed significantly to the contemporaneous speculation by enhancing the ease with which new investor-speculators could participate in that decade’s internet bubble.
NASDAQ market at its peak.
Overall, the internet bubble offers a unique opportunity to examine the relationship between extreme market events and the behaviour of new investors attracted to the market. Nowhere before in history has the revolutionary innovation underlying the transformational shift been so intimately related to the institutional changes affecting investors’ access to the speculation. In the 1990s, speculation in the innovations in information and communications technologies was itself enabled considerably by those innovations – speculators in internet stocks could speculate directly via the online brokerages.
III. BROKERAGE DATA
Although a large amount of anecdotal evidence exists on how new investors used on-line brokerages to buy internet stocks during the internet bubble (e.g., [15]), it is difficult to quantify the size of this phenomenon and thus the potential magnitude of the market effects of these new internet-enabled investors. However, on-line brokerages were also internet stocks themselves, so they made many public announcements about the growth of their industry. In the following analysis, we use E*Trade as our example of an on-line brokerage and Merrill Lynch as our example of a traditional brokerage. 1
A. E*Trade
Quarterly and annual reports for E*Trade only become available in 19992, but the consistency of their reported data makes some analysis possible. There are two key numbers that E*Trade reports on a quarterly basis: total client assets and new client assets – columns 2 and 3 in Table I. From these data, the new market value of the total client assets from the previous quarter can be estimated by subtracting the new client assets from the total client assets – see column 4. Finally, given the market value of the former assets, the return for the quarter can calculated – see column 5. (Note:
1One of the pioneers of on-line trading was Charles Schwab, and we
looked at their data first. Unfortunately, the data presented in their quarterly reports do not consistently separate on-line clients from traditional clients.
2All quarterly reports are from the EDGAR database of the U.S. Securities
and Exchange Commission [16].
the post-crash low for the NASDAQ occurs in the fourth quarter of 2002.)
B. Merrill Lynch
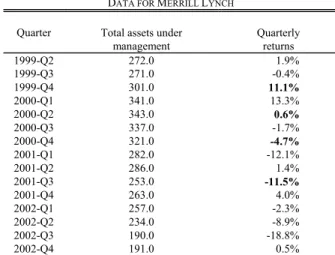
During the time frame of the data in Table I, Merrill Lynch changed its reporting format several times. The most consistent value they report is their “total assets under management”. As an established brokerage, their growth causes less distortion, so calculating returns from this value is sufficiently accurate for our study. Table II reports these returns.
C. Comparisons
The returns for E*Trade’s clients are compared to those for Merrill Lynch’s clients (see Fig. 1). From 1999 Q2 until 2002 Q4, there is relatively little correlation between the returns of these two sets of stock market investors. In particular, there are four quarters when their investment returns differ by more than 15 percentage points (see bold values in Table I): 1999 Q4 has a 23.1 point difference, 2000 Q2 has a 16.3 point difference, 2000 Q4 has a 28.3 point difference, and 2001 Q3 has a 17.4 point difference. These differences in portfolio returns suggest that E*Trade’s clients invested differently than Merrill Lynch’s clients.
Fig. 1. Comparison of estimated returns for clients of E*Trade and Merrill Lynch from 1999-Q2 to 2002-Q4.
TABLEI DATA FOR E*TRADE
1 2 3 4 5
Quarter Total client assets
New client assets
Market value, former assets
Quarterly returns
1999-Q2 26.0 4.4 21.6 2.4%
1999-Q3 28.4 4.3 24.1 -7.3%
1999-Q4 44.1 6.0 38.1 34.2%
2000-Q1 61.6 10.0 51.6 17.0%
2000-Q2 59.5 7.6 51.9 -15.7%
2000-Q3 59.9 6.0 53.9 -9.4%
2000-Q4 45.7 5.6 40.1 -33.1%
2001-Q1 40.0 5.3 34.7 -24.1%
2001-Q2 44.6 5.7 38.9 -2.8%
2001-Q3 35.2 3.5 31.7 -28.9%
2001-Q4 43.5 3.8 39.7 12.8%
2002-Q1 44.7 5.5 39.2 -9.9%
2002-Q2 38.0 3.7 34.3 -23.3%
2002-Q3 33.0 3.5 29.5 -22.4%
2002-Q4 35.1 3.6 31.5 -4.5%
Quarterly returns (column 5) for E*Trade clients are estimated from reported data in columns 2 and 3 (in billions of dollars).
TABLEII DATA FOR MERRILL LYNCH
Quarter Total assets under management
Quarterly returns
1999-Q2 272.0 1.9%
1999-Q3 271.0 -0.4%
1999-Q4 301.0 11.1%
2000-Q1 341.0 13.3%
2000-Q2 343.0 0.6%
2000-Q3 337.0 -1.7%
2000-Q4 321.0 -4.7%
2001-Q1 282.0 -12.1%
2001-Q2 286.0 1.4%
2001-Q3 253.0 -11.5%
2001-Q4 263.0 4.0%
2002-Q1 257.0 -2.3%
2002-Q2 234.0 -8.9%
2002-Q3 190.0 -18.8%
2002-Q4 191.0 0.5%
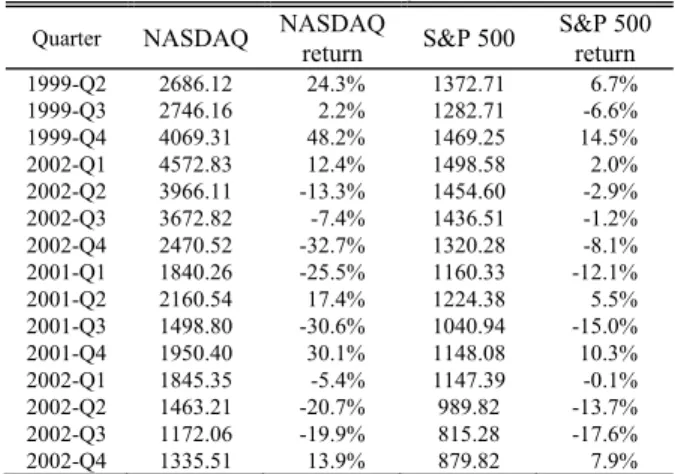
To analyze how these variations in market returns might have come about, we plot the returns of E*Trade’s clients against the returns of the NASDAQ index in Fig. 2 and the returns of Merrill Lynch’s clients against the returns of the S&P 500 index in Fig. 3. (See Table III for index returns.) In general, the market returns of E*Trade’s clients follow the performance of the NASDAQ, and the returns of Merrill Lynch’s clients follow the performance of the S&P 500 index. For the four quarters highlighted previously, the divergences in the client returns from the above indices are much less than those previously stated (see Table IV).
Fig. 2. Estimated returns for clients of E*Trade vs. NASDAQ returns from 1999-Q2 to 2002-Q4.
Fig. 3. Estimated returns for clients of Merrill Lynch vs. S&P 500 returns from 1999-Q2 to 2002-Q4.
D. Analysis
Exploring the apparent correlations further, we show in Table V the returns between the E*Trade portfolio and the NASDAQ are most highly positively correlated (i.e., have the highest Pearson correlation coefficient) as compared with the S&P 500 and the Dow Jones Industrial Average (DJIA). Conversely, for the Merrill Lynch portfolio, we see its returns are most highly correlated with the S&P 500.
Correlations between data randomly sampled from bivariate normal populations distribute t in small samples. We examine the correlations between quarter over quarter changes in the returns between market indexes and the brokerage portfolios to examine the strength and significance of the relationships. Tables V and VI summarize these results.
The NASDAQ in this sample accounts for 92 percent of the variation in the quarter over quarter changes in returns on the E*Trade portfolio – 20 percent stronger than the S&P 500 contribution and nearly 56 percent stronger than the contribution of the portfolio inherent in the DJIA. For Merrill Lynch, it is the S&P 500 that offers the greatest accountability for variation in portfolio returns. Notably however, all correlation coefficients are significant to 5 percent in a one-tailed test. This is unsurprising since the correlations between the market indexes are themselves high. For example, the correlation coefficient between movements
TABLEIII
INDEX VALUES FOR NASDAQ AND S&P500
Quarter NASDAQ NASDAQ
return S&P 500
S&P 500 return
1999-Q2 2686.12 24.3% 1372.71 6.7%
1999-Q3 2746.16 2.2% 1282.71 -6.6%
1999-Q4 4069.31 48.2% 1469.25 14.5%
2002-Q1 4572.83 12.4% 1498.58 2.0%
2002-Q2 3966.11 -13.3% 1454.60 -2.9%
2002-Q3 3672.82 -7.4% 1436.51 -1.2%
2002-Q4 2470.52 -32.7% 1320.28 -8.1%
2001-Q1 1840.26 -25.5% 1160.33 -12.1%
2001-Q2 2160.54 17.4% 1224.38 5.5%
2001-Q3 1498.80 -30.6% 1040.94 -15.0%
2001-Q4 1950.40 30.1% 1148.08 10.3%
2002-Q1 1845.35 -5.4% 1147.39 -0.1%
2002-Q2 1463.21 -20.7% 989.82 -13.7% 2002-Q3 1172.06 -19.9% 815.28 -17.6%
2002-Q4 1335.51 13.9% 879.82 7.9%
Implicit rates of return for the NASDAQ and S&P 500 indices from 1999-Q2 to 2002-Q4. Index values are for close on last day of quarter.
TABLEIV COMPARISON OF KEY QUARTERS
Quarter ML vs.
E*Trade
E*Trade vs. NASDAQ
ML vs. S&P 500
1999-Q4 23.1 14.0 3.5
2000-Q2 16.3 2.5 3.5
2000-Q4 28.3 0.3 3.3
2001-Q3 17.4 1.7 3.4
From 1999-Q2 to 2000-Q4, there are four quarters where the client returns for E*Trade and Merrill Lynch (ML) differ by more than 15 points. These quarters help to highlight how much more closely the returns for clients of E-Trade track the NASDAQ index and the returns for clients of Merrill Lynch track the S&P 500 index.
TABLEV
CORRELATIONS OF CHANGES IN E*TRADE AND MERRILL LYNCH PORTFOLIO RETURNS WITH MARKET RETURNS,1999-Q2 TO 2002-Q4
Correlation
Coefficient r E*Trade Merrill Lynch
NASDAQ .9593
(0.0000)
0.8077 (0.0002)
S&P 500 0.8754
(0.0000)
0.8585 (0.0000)
DJIA 0.7694 (0.0006)
0.8304 (0.0000)
Numbers in parentheses represent p-values indicating the statistical significance of the correlation values. Values in bold represent the highest correlation.
TABLEVI
COEFFICIENTS OF DETERMINATION IN CHANGES IN E*TRADE AND MERRILL LYNCH PORTFOLIO RETURNS WITH MARKET RETURNS,1999-Q2 TO
2002-Q4 Coefficients of
determination r2 E*Trade Merrill Lynch
NASDAQ .92 .65
S&P 500 .77 .74
DJIA .59 .69
in the NASDAQ and the S&P 500 is itself quite high (0.9454).
Normally, the confounding effects of external influences on all stock market returns could be sifted through further to permit the identification of more clearly differentiated effects on the two brokerage portfolios. The small sample size (n=15) due to the limited sample of E*Trade data, however, leaves us with uncomfortably few degrees of freedom to explore our hypothesis further.
IV. MULTI-AGENT MODELS
Previous research on the role of social referencing investor behaviour during market bubbles is fundamentally qualitative in nature. Although the research describes the types of events that could occur, it has been difficult to quantify the magnitude of the potential effects of these events. The data presented in section 3 suggest that new social referencing investors could have owned around 10 percent of the NASDAQ during the internet bubble. Starting with an existing multi-agent model [8]–[10] that is viewed to be an accurate model of traditional investors (i.e., fundamentalists and chartists), we introduce a new class of agents which model social referencing investors. The addition of these new agents leads to a price spike (i.e., a bubble and then a collapse) during a market simulation using the new multi-agent model. This result represents novel support of the possibility that new social referencing investors can have sufficient influence to cause a market bubble.
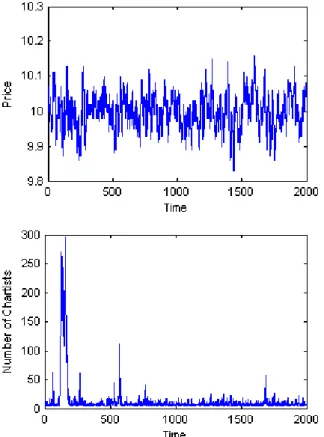
Fig. 4. Deviations from the fundamental value of 10 are exaggerated when a large number of the 500 agents are following the chartist investment strategy
A. The Lux and Marchesi Model
The base model we use is the one developed by Lux and Marchesi [8]–[10]. Their multi-agent model simulates a homogeneous set of investors who can alternate between a fundamentals-based investment strategy and a price momentum-based investment strategy. This latter group of “chartists” are further divided into two subclasses which represent optimistic chartists and pessimistic chartists. The (aggregate) actions of each set of investors lead to a price pressure component, and the subsequent changes in price affect the future actions of the investors. The two key features of the model which allow it to accurately produce simulated prices are the mechanisms which allow investors to switch trading strategies and the method used to specify price changes at any given time step.
The Lux and Marchesi model can generate a time series of prices which accurately reflects the returns observed in actual stock markets. The key feature of real-world returns that had been difficult to model previously was the existence of excess kurtosis – compared to a normal distribution of returns, real-world returns are more likely to have unusually large gains and losses. By being able to simulate quantitative features observed in real-world returns, this multi-agent model is viewed as a viable explanation for the roles and interactions of multiple investment strategies.
An implementation of the Lux and Marchesi model has been developed (further details are provided in [17]). In Fig. 4, the prices observed during 2000 time steps are shown against the total number of chartists (out of 500 total agents). The chartist trading strategy has spikes in popularity which coincide with the periods of exaggerated price volatility. By buying when prices are rising and selling when prices are falling, the actions of the chartists cause a distortion from normally distributed returns. The excess kurtosis of 4.40 in the shown prices is comparable to those originally obtained by Lux [8]. Absent from this version of the model, however, is the sudden surge in prices followed by a rapid decline characteristic of a market bubble.
B. A Discrete Implementation of the Lux and Marchesi Model
The Lux and Marchesi multi-agent model [8]–[10] is simulated entirely by mathematical equations that describe the aggregate agent behaviour. To develop a market price, this model only needs to know how many agents are pursuing the various trading strategies, and not which actual agents are in the various states. Thus, the model requires no individual “agents” – it is not a true multi-agent model in the artificial intelligence sense.
n b a
p N n n p N n n
N n p n p n t
n f f f f
f
) (
) / ( )
/ (
) / 1 )( (
d /
d (1)
Equation (1) represents how the number of agents following the optimistic chartist strategy (n+) changes with
time. The first part of the equation represents “mimetic contagion”, the second part represents “changes of strategies”, and the third part represents “market entry and exit”. An example of the effects of the aggregate equations is shown in Fig. 4, but the internal components of the equation are not directly programmable in a discrete implementation with individual agents.
To develop an artificial intelligence-style multi-agent model in which each agent has a software state, all transition probabilities p are limited to a range of [0-1]. (We note that the original Lux and Marchesi implementation in section III above occasionally required a negative number of agents to change investment strategies in one of the equation parts in order for the aggregate equations to balance.) It is also assumed that an agent will not change its investment strategy more than once during a single time step. Thus, the discrete model selects an integer number of agents (e.g., if 7.7 optimistic chartists are slated to become fundamentalists, seven agents with that trading strategy will be selected first, and an eighth will be selected with a 70% probability) from the pool of agents that existed at the end of the previous time step (up to a maximum of all agents switching their investment strategy).
Fig. 5. The discrete implementation of the Lux and Marchesi model produces similar price changes and agent behaviours as the original version shown in Fig. 4. The kurtosis in the shown prices is 2.94
This discrete implementation of the Lux and Marchesi model thus has two phases for each time step. In the first phase, the agent actions are calculated based on the aggregating equations. In the second phase, a discrete number of agents perform actions as directed by the preceding calculations. The subsequent discrete values for the number of agents of each type in each state are then fed into the aggregating equations for the first phase of the next time step. The price and agent behaviours shown in Fig. 5 confirm the consistency of our discrete implementation with the original Lux and Marchesi model.
C. Social Investors and a Hybrid Multi-Agent Model
The previous “traditional” investors base their decisions on quantitative economic data such as the current market price of the stock, the expected future value of the stock, and the recent rate of change in the observed market prices. To mimic some of the social aspects of investing, we introduce an investor class that bases its decisions on the popularity of the investment activity. Specifically, if a social investor sees a large number of other investors buying, then that social investor will buy as well. Conversely and symmetrically, when the social investor observes a large number of sellers in the market, they will sell.
We distinguish between two types of social investors. “Savvy” social investors randomly sample seven (7) traditional investors – both fundamentalists and chartists – and record the difference between the number of buyers and the number of sellers. If this difference in the observed participation of traditional investors matches or exceeds a social investor’s threshold (randomly selected from a uniform distribution from 1-5 for each agent), then that social investor will have an inclination to buy. Conversely, if the number of sellers exceeds the number of buyers by the same threshold, that same investor will have an inclination to sell. A difference of less than the specific threshold for a given social investor in either direction causes that agent to perform no action during that time step. “Naïve” social investors are similar to savvy social investors in the decision process and their choice of decision criteria. However, rather than sampling traditional investors, they examine a random sample of seven (7) other social investors – both savvy and naïve.
Fig. 6. A small number of social investors is capable of destabilizing the Lux and Marchesi model. The large upward movement in price coincides with the sustained buying interest of the social investors
The resulting hybrid multi-agent model has two components. The first is a set of “simulated” agents that are controlled by the aggregating mathematical equations developed by Lux and Marchesi. The second is a set of
independent agents whose actions affect the state variables used in the previous mathematical equations. The overall system thus benefits from being able to model and measure the effects of both collective, quantitative behaviours and individual, qualitative behaviours.
The effects of introducing social investors into a previously stable financial market simulation are shown in Fig. 6. The model starts as the discrete version of the Lux and Marchesi model for the first 1000 time steps. After 1000 time steps, the social investors become active – similar to the introduction of the internet and on-line investing in the 1990’s. The effects of social investors in the hybrid multi-agent model create a price chart that leaves the previously stable range to the upside and to the downside – similar to a market bubble and the subsequent crash.
V. DISCUSSION
The assumption of independent investor preferences dominates the finance literature. The possibility of agent-dependent, social referencing behaviour receives scant attention. Increasing attention to the behavioural characteristics of investors is broadening our understanding of what may better explain asset price movements. Unlike traditional models of standard finance, behavioural finance permits heterogeneity in both cognitive processes and investor preferences and thus a deeper understanding of market outcomes. Yet, very much like traditional models of finance, behavioural finance models assume an independence of these preferences. Using a new data set, this paper examined the market effects of the possibility that preferences may be, in part, socially constituted with meanings socially constructed. Using a new hybrid agent-based model, we examined the implications on market stability of such socially referenced investment behaviour.
Where previous multi-agent models (e.g., Lux and Marchesi) have explored agent heterogeneity appearing in the form of a single agent type that can be in one of two different states, our version of the agent-based model permits two distinct agents each existing in one of two distinct states. Our hybrid multi-agent model provides a new and unique opportunity to model and observe the effects of social referencing investor behaviour. In particular, investors who buy when others are buying and investors who buy when prices are rising can create amongst themselves a positive feedback loop. As this feedback loop operates, the fundamentals-based investment strategy drops in popularity (a phenomenon also observed during the internet bubble) as more of the traditional investors become chartists. When the supply of new investors and convertible traditional investors becomes exhausted, the market peaks. After the peak, the reverse feedback loop of investors selling when prices are dropping and investors selling because others are selling leads to a rapid decline in prices. The ability of the model to produce both halves of the price bubble and to produce it with a quantitatively appropriate number of new investors (i.e., 10 percent – the approximate market weight of on-line traders during the internet bubble) are both very promising results.
the limitations of the Lux and Marchesi model. The intention of the Lux and Marchesi model is to simulate market returns. Although the distribution of the returns produced by the Lux and Marchesi model replicates some specific characteristics of the returns of real-world stock prices, the overall price chart does not actually look like a price chart for a real-world stock. Specifically, the Lux and Marchesi model does not fully model all of the dynamics of a stock market. Similarly, the spike in prices produced by the new hybrid model does not look like the NASDAQ chart or any prices during a real-world bubble. Within the specific scope of observing interactions among social referencing investors and traditional investors (fundamentals-based and chartist), the hybrid model is sufficient. However, a significantly more complex and detailed model is required to fully replicate all of the dynamics of a market bubble.
With regards to the brokerage data, quarterly reports are a coarse and sparse data set. The inconclusive statistical analysis clearly indicates that more data is required. The key contribution of the current analysis is the discovery that (new) investors with on-line brokerages may have invested differently than (existing) investors at traditional brokerages. A full analysis of this situation requires access to proprietary client data. We hope to acquire access to this data as a part of on-going research in this area.
VI. CONCLUSION
The hybrid multi-agent model developed in this paper allows the actions of both qualitative and quantitative investor behaviours to be simulated. The model represents a new and unique opportunity to observe the effects of social referencing investor behaviour. When the weighting of social investors in the model is similar to that of on-line investors during the internet bubble, market simulations with the model also produce a price spike. This promising result is tempered by limitations in the brokerage data and the fidelity of the underlying multi-agent model. We hope to address these issues in future research.
REFERENCES
[1] E. F. Fama, “The behavior of stock market prices,” Journal of Business, vol. 38, 1965, pp. 34-105.
[2] E. F. Fama, “Efficient capital markets: A review of theory and empirical work,” Journal of Finance, vol. 25, 1970, pp. 383-416.
[3] E. F. Fama, Foundations of Finance. Basic Books, New York, 1976.
[4] E. F. Fama, “Efficient markets II,” Journal of Finance, vol. 46(5), 1991, pp. 1575-1617.
[5] J. B. De Long, A. Schleifer, L. H. Summers, and R. J. Waldman, “Noise trader risk in financial markets,” Journal of Political Economy, vol. 98, 1990, pp. 703-738.
[6] J. B. De Long, A. Schleifer, L. H. Summers, and R. J. Waldman, “Positive feedback investment strategies and destabilizing rational speculation,” Journal of Finance, vol. 45(2), 1990, pp. 379-395.
[7] K. A. Froot, D. S. Scharfstein, and J. C. Stein, “Herd on the street: Informational inefficiencies in a market with short-term speculation,” Journal of Finance, vol. 47, 1992, pp. 1461-1484.
[8] T. Lux, “The socio-economic dynamics of speculative markets: Interacting agents, chaos, and the fat tails of return
distribution,” Journal of Economic Behavior and Organization, vol. 33, 1998, pp. 143-165.
[9] T. Lux and M. Marchesi, “Scaling and criticality in a stochastic multi-agent model of a financial market,” Nature, vol. 397, 1999, pp. 498-500.
[10] T. Lux and M. Marchesi, “Volatility clustering in financial markets: A microsimulation of interacting agents,”
International Journal of Theoretical and Applied Finance, vol. 3(4), 2000, pp. 675-702.
[11] B. Spotton Visano, Financial Crises: Socio-economic causes and institutional context. Routledge, London, 2006.
[12] J. B. Williams, The Theory of Investment Value. Reprinted Augustus M. Kelley, New York, 1938, 1965.
[13] A. Lynch, “Thought contagions in the stock market,” Journal of Psychology and Financial Markets, vol. 1, 2000, pp. 10-23. [14]D. R. Clyman, K. M. Eades, and D. C. Kelly, “Merrill Lynch &
Co., Inc.” Case UVA-F-1284, Darden Business Publishing, University of Virginia, 2000.
[15] B. M. Barber and T. Odean “The Internet and the Investor,”
Journal of Economic Perspectives, vol. 15, 2001, pp. 41-54. [16] http://www.sec.gov/edgar.shtml
[17] S. Chen, J. Tien, and B. Spotton Visano, “A hybrid multi-agent model for financial markets,” in Lecture Notes in Computer Science, Vol. 5027 : Proceedings of the 21st International Conference on Industrial, Engineering and Other Applications of Applied Intelligent Systems, N. T. Nguyen, L. Borzemski, A. Grzech, and M. Ali, Eds. Heidelberg: Spring-Verlag, 2008, pp. 531-540.