MSP
MESTRADO EM
SAÚDE PÚBLICA
UNIVERSIDADE DO PORTO
FACULDADE DE MEDICINA
INSTITUTO DE CIÊNCIAS BIOMÉDICAS ABEL SALAZAR
Andreia Henriques da Costa
EFFECT OF TELEVISION VIEWING ON FOOD AND
NUTRIENTS INTAKE AMONG ADOLESCENTS
EFFECT OF TELEVISION VIEWING ON FOOD AND
NUTRIENTS INTAKE AMONG ADOLESCENTS
Dissertação de candidatura ao grau de Mestre em
Saúde Pública apresentada à Universidade do Porto.
Orientadora: Professora Doutora Elisabete Ramos
Investigação realizada no Serviço de Higiene e Epidemiologia da Faculdade de Medicina da
Universidade do Porto, sob orientação da Prof. Doutora Elisabete Ramos.
Este projecto foi efectuado com base em projectos financiados pela Fundação para a
AGRADECIMENTOS
À Professora Doutora Elisabete Ramos pela oportunidade de integrar o EPITeen, por tudo
quanto me ensinou, pela orientação e pelo empenho.
A todos os colegas do Serviço de Higiene e Epidemiologia, por me receberem, pelo
companheirismo e profissionalismo.
À Andreia Oliveira por ter acreditado em mim e pela oportunidade.
À Sílvia Fraga e Sandra Sousa pelos bons momentos no EPITeen e por toda a ajuda.
TABLE OF CONTENTS TABLES LIST V ABREVIATIONS LIST VI RESUMO 1 ABSTRACT 3 1. INTRODUCTION 5
1.1 DIET AND HEALTH 6
1.2 ADOLESCENT DEVELOPMENT 10
1.3 NUTRITION IN ADOLESCENCE 12
1.4 PYSICAL ACTIVITY AND SEDENTARY BEHAVIOURS 16
2. AIMS 20
3. PARTICIPANTS AND METHODS 21
4. REFERENCES 25
5. CHAPTER I 36
EFFECT OF TELEVISION VIEWING ON FOOD AND NUTRIENTS INTAKE
TABLES LIST
Table 1. Comparison between adolescents included and excluded. 24
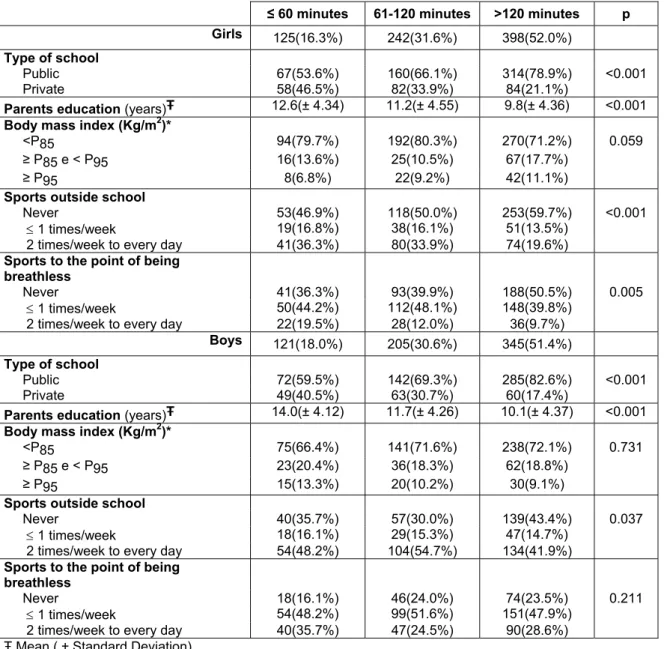
Table 1, Chapter I. Description of the characteristics according categories of time watching
TV, by sex. 46
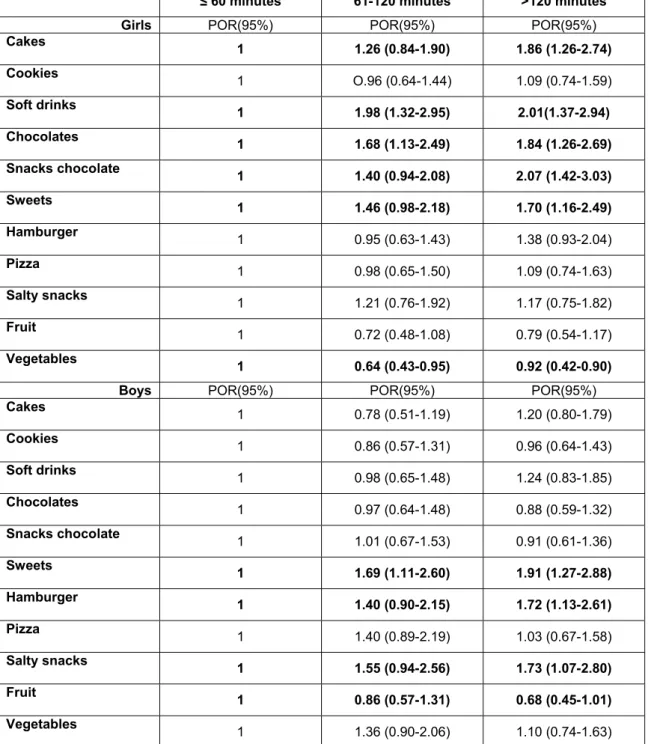
Table 2, Chapter I. Associations between time spent watching TV and quartiles and tertiles
of food intake, by sex. 47
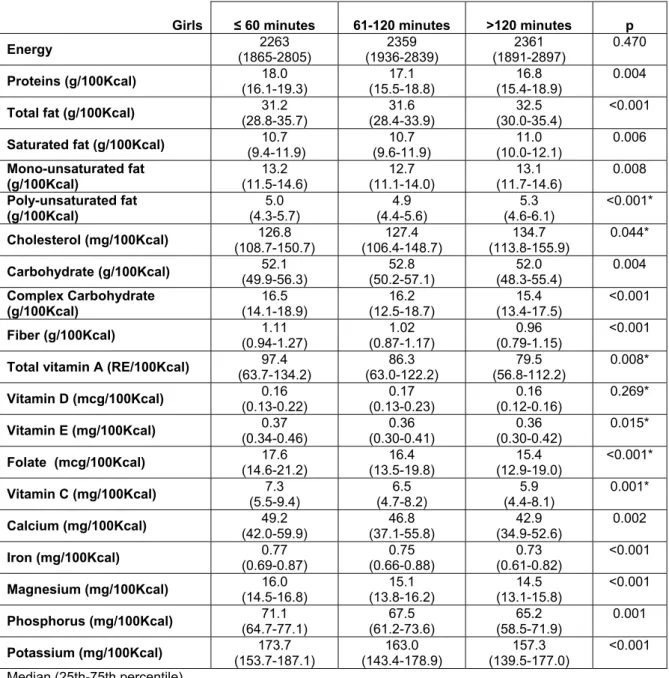
Table 3, Chapter I. Intakes of total energy and nutrients according categories of time
watching TV, in girls. 48
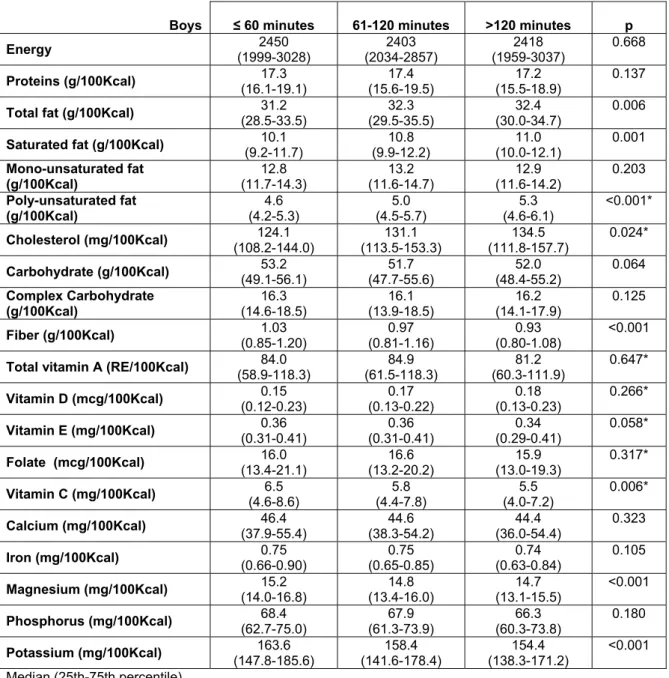
Table 4, Chapter I. Intakes of total energy and nutrients according categories of time
watching TV, in boys. 49
Table 5, Chapter I. Associations between time spent watching TV and quartiles of nutrients
and vitamins intake, in girls. 50
Table 6, Chapter I. Associations between time spent watching TV and quartiles of nutrients
ABREVIATIONS LIST
BMI – body mass index
DALYs - disability-adjusted life-years
DASH - Dietary Approaches to Stop Hypertension
EPITeen - Epidemiological Investigation of Teenagers Health in Porto
FFQ - food frequency questionnaire
g – grams
HBSC – Health Behaviour in School-Aged Children
Kcal – Kilocalories
LDL – low density lipoprotein
mg – milligrams
NCDs - non-communicable diseases
NHANES – National Health and Nutrition Examination Survey
POR – proportional odds ratio
TV – Television
US – United States
RESUMO
Introdução: A adolescência é a oportunidade para preparar uma vida adulta saudável e
para promover a prática de exercício físico e hábitos alimentares saudáveis. Adicionalmente,
a adolescência constitui um período particularmente vulnerável em termos nutricionais
dadas as necessidades para o crescimento e desenvolvimento. Entre os comportamentos
relacionados com a ingestão alimentar, o tempo a ver televisão é particularmente importante
dada a quantidade de adolescentes expostos. Além disso, o tempo elevado a ver televisão
nos adolescentes tem sido associado com inactividade física e com hábitos alimentares
menos saudáveis.
Objectivo: Foi desenhada uma avaliação transversal com o objectivo de avaliar a
associação entre o tempo a ver televisão e a ingestão alimentar em adolescentes de 13
anos. Analisámos, de acordo com o tempo a ver televisão, a ingestão de alimentos (bolos,
bolachas, refrigerantes, chocolates, snacks de chocolate, rebuçados, pizza, hambúrguer,
snacks salgados e fruta e vegetais) e a ingestão de macronutrientes, vitaminas e minerais.
Métodos: O presente estudo foi desenvolvido no âmbito do projecto EPITeen. Integraram o
estudo as 27 escolas públicas e 19 das 24 escolas privadas contactadas. Foram
identificados 2787 adolescentes elegíveis, nascidos em 1990 durante o ano escolar de
2003/2004. Não foi possível contactar 44 adolescentes (1.6%) e 583 (20.9%) não
devolveram a declaração de consentimento assinada, pelo que foram considerados recusas.
Participaram no estudo 2160 adolescentes (1651 inscritos em escolas públicas e 509 em
privadas). A proporção de participação foi 77.5%, semelhante em escolas públicas e
privadas (77.7% vs 77.0%, p=0.71). Após exclusão dos participantes com informação
incompleta e com uma ingestão energética total superior a 3 desvios inter-quartil ou uma
ingestão de fruta ou vegetais superior a 1.5 desvio inter-quartil, a amostra final incluiu 1436
As informações sobre características comportamentais, sociais e demográficas, história
pessoal e familiar de doença, foram recolhidas utilizando dois questionários estruturados e
foi realizada uma avaliação física na escola.
A ingestão alimentar foi avaliada através de um questionário de frequência alimentar.
A avaliação antropométrica incluiu a medição do peso e da estatura. Para determinar os
percentis de índice de massa corporal, foram utilizados os percentis de referência para o
sexo e a idade, desenvolvidos pelo Centers for Disease Control and Prevention.
Resultados: Em ambos os sexos, as escolas públicas apresentaram uma proporção
significativamente maior de adolescentes que vêem mais de 2 horas de televisão por dia e a
média de escolaridade dos pais é menor no grupo que vê mais horas de televisão. Não
foram encontradas diferenças estatisticamente significativas em relação ao índice de massa
corporal. As raparigas que vêem mais de 2 horas de televisão por dia referiram uma menor
prática de desporto.
Os adolescentes que vêem mais de 2 horas de televisão por dia apresentaram uma ingestão
significativamente superior de gordura total e polinsaturada e uma menor ingestão de
magnésio, em ambos os sexos. Adicionalmente, nas raparigas, ver mais de duas horas de
televisão por dia foi associado a uma menor ingestão de hidratos de carbono complexos,
fibras, vitamina A total, folato, vitamina C, cálcio, ferro, fósforo e potássio. Nos rapazes que
vêem mais de duas horas de televisão por dia foi encontrada uma maior ingestão de gordura
saturada e colesterol.
Conclusões: O tempo a ver televisão está associado com uma maior ingestão de alimentos
com elevado teor de gordura e açúcar e uma menor ingestão de fruta e vegetais.
Consequentemente, os adolescentes que vêem mais horas de televisão por dia apresentam
uma maior ingestão de gordura total e polinsaturada e menor ingestão de minerais e
vitaminas. Este comportamento alimentar entre adolescentes poderá ter implicações na
ABSTRACT
Introduction: Although a generally healthy period, adolescence is the opportunity to prepare
for a healthy adult live, and to promote the practice of physical activity and healthy eating
habits. Additionally, adolescence is a period of potential nutritional risk given the nutritional
requirements for growth and development. Among the behaviours that were associated with
food intake, exposure to television is particularly important given the amount of adolescents
exposed. Also, increased time spent watching television (TV) has been associated with
physical inactivity and with less desirable dietary intake among adolescents.
Objective: We designed a cross-sectional survey to examine the association between
television viewing and dietary intake, among 13-year-old adolescents. We analyse, according
to time spent watching TV, food intake (cakes, cookies, soft drinks, chocolates, snacks of
chocolate, sweets, pizza, hamburger, salty snacks and fruit and vegetables) and
macronutrients, vitamins and minerals intake.
Methods: The present study was part of the EPITeen cohort. In the compliant schools (all 27
public schools and 19 private schools) we identified 2787 eligible adolescents born in 1990
during the 2003/2004 school year. Forty-four (1.6%) could not be reached always missing
classes during the study period and 583 (20.9%) did not return the signed informed consent
form and were considered refusals. Information, at least for part of the planned assessment,
was provided by 2160 adolescents (1651 public and 509 private schools students). The
overall participation proportion was 77.5%, similar in public and private schools (77.7% vs
77.0%, p=0.71). After exclusion of participants with incomplete information and with a total
energy intake above 3 interquartile deviations or an intake of fruit or vegetables above 1.5
interquartile deviations, the final sample includes 1436 students (765 girls and 671 boys).
Data on behavioural, social, demographic and clinical characteristics was collected by two
self-administered questionnaires and a physical examination was performed. Dietary intake
Anthropometric evaluation included weight and height measurements. The age and sex
specific body mass index (BMI) references developed by the Centers for Disease Control
and Prevention were used to assign BMI percentiles.
Results: In both genders, public school presented a significant higher proportion of
adolescents that watched more than 2 hours of TV per day, also the mean parent’s
education of adolescents that watched TV more time was lowest. No statistically significant
differences were found according to body mass index. Girls that watched more than 2 hours
of TV per day reported less practice of sports.
Spending more than 2 hours per day watching TV was significantly associated with higher
intake of total fat and poly-unsaturated fat and was associated with lower intake of
magnesium, in both genders. In addiction, in girls, spending more than 2 hours per day
watching TV was associated with lower intake of complex carbohydrates, fiber, total vitamin
A, folate, vitamin C, calcium, iron, phosphorus and potassium. In boys, higher intake of
saturated fat and cholesterol was found among those with watching TV more time.
Conclusions: We found that television viewing is associated with higher consumption of
higher-fat and sugar food and less fruit and vegetables. Consequently, adolescents that
watched more television presented higher intake of total fat and poly-unsaturated fat and
lower intake of minerals and vitamins. This dietary behaviour among adolescents may have
1. INTRODUCTION
Adolescent is someone between 10 and 19 years of age, as defined by the World Health
Organization (WHO) (1). One in every five people in the world, approximately 1.2 billion, is
an adolescent (2). They have survived the diseases of early childhood, have a low incidence
of infections such as pneumonia and gastroenteritis compared with younger children, and the
clinical health problems associated with ageing are still many years away. Nevertheless, the
World Health Organization estimated that 1.4 million deaths occur, each year, among 10-19
year olds due to road traffic accidents, complications during pregnancy and child birth,
suicide, violence, and HIV/AIDS (3). In Portugal, in 2006 the death rate in the 15 to 24 years
old group was 44.2 per 100,000 males and 9.4 per 100,000 females, most of this due to the
mortality rate related to traffic accidents (22.4 and 4.3 per 100,000, respectively) (4).
In the adult population, the population aging leads to a continuous increasing in the burden of
chronic diseases, mainly cardiovascular diseases, cancers, diabetes and chronic respiratory
diseases (5). In 2005 these diseases caused an estimated 35 million deaths, which
represents 60% of all deaths worldwide (5). It has been projected that, by 2030, chronic
disease will account for almost 70% of all deaths. Global cancer deaths are projected to
increase from 7.1 million in 2002 to 11.5 million in 2030, and global cardiovascular deaths
from 16.7 million in 2002 to 23.3 million in 2030 (6). These deaths cause major impact in
both health and socioeconomic systems, and often follow long standing impaired quality of
life, disability and suffering. Cardiovascular diseases are at this moment and will continue to
be the major contributor to the global burden of disease among the non-communicable
diseases (NCDs).
Moreover, chronic diseases are largely preventable diseases (7). Up to 80% of heart
disease, stroke, and type 2 diabetes and over a third of cancers could be prevented by
eliminating shared risk factors, mainly tobacco use, unhealthy diet, physical inactivity and
affordable and sustainable course of action to cope with the chronic disease epidemic
worldwide (7).
There is increasing evidence that chronic disease risks begin in fetal life and continue into
old age (8). For instance, atherosclerosis constitutes an important contributor to
cardiovascular diseases and despite the clinical outcome of the atherosclerosis being usually
detected only in adult life, this process begins early in life (9-10). The lag-time effect of risk
factors for cardiovascular disease means that the full effect of exposure to behavioural risk
factors during childhood and adolescence will only be seen in the future. Adult chronic
disease, therefore, reflects cumulative differential lifetime exposures to damaging physical
and social environments. From the above, it is clear that risk factors must be addressed
throughout the life course.
There is a continuity in the influences contributing to chronic disease development, and thus
also to the opportunities for prevention. For chronic diseases, risks occur at all ages,
conversely, all ages are part of the continuum of opportunities for their prevention and control
(7).
There are critical aspects of adolescence that have an impact on chronic diseases as the
development of risk factors that tend to stay throughout life. Although a generally healthy
period, adolescence is the opportunity to prepare for a healthy adult live, and promote the
practice of physical activity and healthy eating habits and prevent risky behaviours like
smoking, use of alcohol and drugs and obesity.
1.1 DIET AND HEALTH
Nutrition is coming to the fore as a major modifiable determinant of chronic disease, with
scientific evidence increasingly supporting the view that alterations in diet have strong
effects, both positive and negative, on health throughout life (7). There are five important
intake; specific nutrients intake, such as fat; specific minerals intake, such as calcium; and
dietary patterns.
A chronic disease that frequently starts during childhood and adolescence and have a very
important burden in morbidity during life is overweight and obesity. Obesity is the result of an
imbalance of energy intake and expenditure. Thus, any factor that raises energy intake or
decreases energy expenditure by even a small amount will cause obesity in the long-term
(11). Pediatric obesity is likely to be a major cause of ill in adulthood, but also contributes
substantially to illness in childhood (12). Elevated pediatric body mass index (BMI) is
associated with numerous consequences including high blood pressure (13), atherosclerosis
(9), left ventricular hypertrophy (14), sleep apnea (15), asthma (16), polycystic ovarian
syndrome (17), type 2 diabetes (18), gastroesophogeal reflux (19), constipation (20), and
orthopedic complications (21). Obesity during the adolescence is also an important predictor
of adult obesity, with an associated raised risk of disease and premature mortality (22-25).
More than 60% of children who are overweight before puberty will be overweight in early
adulthood, which is of particular concern as it will probably reduce the average age at which
NCDs become apparent, thus greatly increasing the burden on health services which will
have to provide treatment during much of their adult life. Excess body weight is responsible
for more than 1 million deaths and the loss of 12 million disability-adjusted life-years (DALYs)
in the WHO European Region every year. This and obesity are responsible for about 80% of
adult cases of type 2 diabetes, 35% of cases of ischaemic heart disease and 55% of cases
of hypertensive disease among adults. Obesity also has a negative effect on psychosocial
health and personal quality of life (26).
The importance of fruit and vegetables consumption is largely recognized and since 1990 the
World Health Organization recommends a minimum consumption of 400g/day,
corresponding approximately to 5 portions of fruit or/and vegetables per day (27), being that
the consumption of vegetables should be higher than the fruit. According to World Health
Overall, 2.7 million deaths and 26.7 million DALYs are attributable to low fruit and vegetable intake. Of the burden attributable to low fruit and vegetables intake, about 85% was from
cardiovascular diseases and 15% from cancers (28). Results of a meta-analysis of cohort
studies indicate that fruit and vegetables consumption is inversely associated with the
occurrence of coronary heart disease (29). Accordingly, the risk of coronary heart disease is
decreased by 4% for each additional portion per day of fruit and vegetables and by 7% for
fruit consumption (29).
Certain dietary patterns can havesubstantial effects on coronary heart disease risk factors
such as blood pressure in adults. The effects of increased fruit and vegetables consumption
on blood pressure alone and in combination with a low-fat diet, were assessed in the Dietary
Approaches to Stop Hypertension (DASH) trial. While the combination diet was more
effective in lowering blood pressure, the fruit and vegetables diet also lowered blood
pressure (by 2.8 mmHg systolic and 1.1 mmHg diastolic) in comparison to the control diet.
Such reductions, while seeming modest at the individual level, would result in a substantial
reduction in population wide risk of cardiovascular diseases by shifting the blood pressure
distribution (30).
The protective effect of fruit and vegetables intake was also found in a cohort study from
childhood to adulthood indicated that higher intake of vegetables in childhood was
associated with lower risk of stroke death (31). In this cohort was also found that an increase
in fruits intake was associated with decrease risk of cancer over a 60-years period (32).
The possible effects of fruit and vegetables may be by the protective effect of their
constituents such as fiber, potassium, folate, vitamins, and other phenolic compounds (28). A
combination of antioxidants and phytochemicals found in fruit and vegetables might promote
health by combating free radicals, which are linked with early phase development of some
chronic diseases (33). Dietary fiber is an important component of diet and essential for the
proper functioning of the body. There are multiple health benefits of consuming fiber, namely,
protection against cardiovascular disease risk factors, reduction of risk of diabetes and
preventing some types of cancer (34-38).
Dietary fat is one of the most frequently studied components of diet. The role of dietary fat in
chronic disease has been the focus of a large number of experimental and epidemiological
studies. In general, high intake of fat is associated with a greater risk of developing
cardiovascular disease such as coronary heart disease and stroke mainly through the
atherogenic effects of plasma lipids (serum total cholesterol and LDL-cholesterol). The
effects of dietary fats on thrombosis and endothelial function as well as the relationship of
plasma and tissue lipids to the pathways of inflammation have been more recently
understood. Similarly, the effects of dietary fats on blood pressure have also become more
evident through observational and experimental research (39-40). Nevertheless we be aware
that not all dietary fat have de same role and not all are risk factors for disease. If on one
hand, the risk associated with intake of trans is clear, the role of others fats, such as
unsaturated fat, especially omega-3 fatty acids, remains in discuss (41).
Although cancer and cardiovascular diseases are the diseases with a major impact on
mortality, osteoporosis is currently one of the diseases with the greatest impact on morbidity
of the adult population. Peak bone mass, which happens close to the adolescence (42), is a
major determinant of the risk of fracture due to osteoporosis since the mass of bone tissue at
any time during adult life is the difference between the amount accumulated at maturity and
that lost with ageing (43). While several nutrients are important for achieving good levels of
bone mass during adolescence, including calcium, phosphorus magnesium, potassium,
sodium, fluoride, and vitamins A, C, D and K (44-45) about 80 to 90% of bone mineral
content is composed of calcium and phosphorus and calcium is the main nutrient (46). Even
thought there is controversy as to the existence of a significant association between calcium
intake and dairy products and bone mass in children and adolescents (47), is recommended
an adequate calcium intake, particularly from dairy products during adolescence for the
Many studies have evaluated the associations between food groups, foods, or nutrients and
chronic diseases, but in the last years interest has concentrated on dietary patterns, because
they can accommodate the complex interplay of nutrients within a diet. The study of dietary
patterns addresses the effect of diet as a whole and thus may provide insight beyond the
effects described for single nutrients and foods. The most studied dietary pattern is the
Mediterranean diet. This dietary pattern may play a beneficial role in health and longevity
(48) and has been associated with a decrease in overall mortality in several studies (49-54).
1.2 ADOLESCENT DEVELOPMENT
Adolescents are in the process of establishing responsibility for their own health-related
behaviours. Many of these behavioural patterns are developed during adolescence, such as
physical activity and eating habits, and persist into adulthood.
The second decade of live is a period of great physical, emotional and psychological change,
accompanied by biological developments characterized by evolving growth and maturation. It
is, as well, a period of great changes in social interactions and relationships (3). Maturation
refers to stages of progress towards the mature biological state and it is most often
considered in the context of secondary sex characteristics or skeletal age. The norm for
timing of maturation in human is large. The average onset for pubertal development occurs
generally at 11 years old for females and 13 years old for males, but individual variation
within the same sex can be wide (55-56). Despite this variability, adolescence may be
divided into three developmental stages based on physical, psychological and social
changes: early, middle and late adolescence (57).
Early adolescence is characterized by the developmental tasks of physical and cognitive
maturation, emotional expressiveness, increased need for belonging and peer membership
and experimentation with social relationships. Body image is of great concern as is a
an inability to see beyond the immediate or to deal with remote, future or hypothetical
problems (58).
In middle adolescence, the developmental tasks and physical changes tend to become more
settled with an emphasis on emotional control, intimacy, moral development, social justice
and spirituality. The focus is also on improving appearance and attractiveness, and
socializing occurs in mixed-sex peer groupings, if culturally appropriate. It is during this
phase of adolescence that more realistic career goals are considered and limitations
recognized (58).
Late adolescence sees an increased involvement in acquiring the practical skills necessary
for functioning independently of parents, making critical decisions related to adult life, as well
as consolidating a moral code and socio-political ideology. (58).
The increasing autonomy of adolescents and the beginning of the separation from parents
makes them more susceptible to peers and social influences and one expression of
adolescents’ search to establish themselves as autonomous members of society is through a
change in eating habits (59). With increasing age, adolescents’ personal choices and
preferences gain priority over eating habits acquired in the family, and they have
progressively more control over what they eat, when and where (60-61). For these reasons,
adolescents are an ideal target for nutrition education. In younger children, parents are in
charge and need to be influenced, in adults, it may be more difficult to modify
well-established patterns. Furthermore, adolescents may not only adopt healthy eating patterns
and lifestyles for themselves, but also influence their peers, family and other community
members (59). Many eating habits are developed during adolescence and will last for life and
habits learned in childhood and adolescence will be carried over into adulthood when they
1.3 NUTRITION IN ADOLESCENCE
Adolescents are a nutritionally vulnerable group for a number of specific reasons, including
their high requirements for growth, their eating patterns and lifestyles, their risk-taking
behaviours and their susceptibility to environmental influences.
Inadequate nutrition in adolescence can potentially retard growth and sexual maturation,
although these are likely consequences of chronic malnutrition in early infancy and childhood
(59). The World Health Organization recognized protein-energy malnutrition, iron, iodine,
vitamin A, folate, and calcium deficiencies as the main nutritional issues of adolescents. The
effects of this deficiencies in adolescents, and others nutrition-related disorders such as
obesity, may have consequences during adolescence or further increase chronic disease risk
later on in adulthood (59).
Obesity is globally increasing in children and adolescents (62-63). Since 1980, the
prevalence of BMI for age at or above the 95th percentile has tripled among United States
(US) school-age children and adolescents, and it remains high at approximately 17%
(64-66). In 9-year-old children the mean body mass index increased of 2.3 kg/m2 form 1970 to
2002 (67). According with National Health and Nutrition Examination Survey (NHANES)
2007-2008, 18.1% of 12- through 19-year-old adolescents were at or above the 95th
percentile of BMI for age, 19.3% among boys and 16.8% among girls. Based on the adult
definition of obesity (BMI≥30), in 2007-2008, 12.6% of adolescents aged 12 through 19 years
were obese (68). Data from Health Behaviour in School-aged Children (HBSC) shows that
the prevalence of obesity and excess body weight ranges from 6% to 31% in 13-year-olds
and from 6% to 30% in 15-year-olds. On average, the prevalence of obesity and excess body
weight in 13-year-olds is 16% among boys and 10% among girls, and 17% and 10% among
15-year-olds, respectively. In this study, the prevalence among Portuguese adolescents was
13% for girls and 18% for boys. A high prevalence of obesity has already been described in
EPITeen cohort, in which inserts this investigation (69). Using WHO criteria, the prevalence
boys were at risk of overweight. When using the International Task Force recommendations,
the prevalence of obesity was 5.7% in girls and 6.6% in boys and the prevalence of
overweight was 18.8% in girls and 20.8% in boys (69).
The rapid physical growth that happens during adolescence creates an increased demand
for energy and some nutrients (70-71) such vitamins and minerals. Nevertheless, in last
decades, significant changes have occurred in adolescent’s food consumption and in general
to an adverse pattern. These include a decreased in consumption of fruit and vegetables and
dairy products, along with insufficient consumption of micronutrients such as calcium and
some vitamins. Besides, there is an excess of consumption of fat, saturated fat, trans fats,
added sugars and sodium (72).
These changes may be a result of a change of eating patterns among adolescents, such as,
a reduction in regular breakfast consumption, an increase in consumption of soft drinks and
foods prepared away from the home, an increase in the percentage of total calories from
snacks and an increase in consumption of fried and nutrient-poor foods (70, 73).
Results in a series of cross-sectional studies in developed industrialized countries show that
despite high levels of fat intake, particularly saturated, we are seeing a downward trend in
consumption over the years and with age (74-75). Compared with other developed countries,
adolescents in this sample have a lower fat intake, particularly saturated fat (76).
As previous said, fruits and vegetables are important sources of vitamins, minerals,
phytochemicals and fibre, and this inadequate intake has a tremendous impact on the intake
of these nutrients. Nutritional surveys show that children and adolescents are not meeting
the recommendation to a minimum consumption of 5 portions of fruit or/and vegetables per
day (77-80). Data from the HBSC study 2005-2006 shows that 35% of 13-year-old
adolescents eat fruit daily, and 32% eat vegetables each day (78). However, adolescent’s
fruit and vegetables intake decreased with their increasing age (78, 81-82), consumption of
fruit and vegetables decreased from 11 to 15 years old among boys and girls (78).
vegetables during the transition from early to middle and from middle to late adolescence
(81).
Another factor there is becoming less frequent with increasing age is breakfast consumption.
Regular breakfast consumption can have a multitude of positive health benefits (83).
Breakfast consumption is important to overall dietary quality and nutritional adequacy among
children and adolescents (84-85) and children who report eating breakfast on a regular basis
tend to have better nutritional profiles than their breakfast skipping peers (83). Taking a
complete and well-balanced breakfast avoids hunger feelings in the morning which can lead
to nibbling snack foods, particularly those high in sugar and/or fat (86). However, breakfast
skipping among children and adolescents is highly prevalent, particularly in later adolescence
(70, 83, 87). The breakfast-skipping prevalence reported in several studies ranged from 10%
to 30%, depending on age group, population, and definition (83). Breakfast skipping among
young people has been shown to be associated with an increased likelihood of being
overweight or obese (88).
Although adolescence is a time of high calcium requirements (71), several studies suggest
that children and adolescents diets are often inadequate in calcium (89-92). The frequency of
an inadequate dietary calcium intake in Portuguese 7-9 years-old children was high, 35.4%
vs 33.0%, for girls and boys, respectively (92) and also at 13-year-old it is expected to be
higher (76).
Some researchers have argued that this insufficient intake of calcium results exist because
soda intake may displace more nutritious beverages, such as milk and fruit juice, and
nutrients associated with these beverages. They arguments are based on data showing that
while consumption of milk has significantly decreased, adolescent’s intake of soft drinks has
increased in recent decades (93-95). And because beverage patterns, characterized by high
levels of soda intake, have been negatively associated with children’s diet quality (93, 96).
Harnack and colleagues (93), in analyzing Continuing Survey of Food Intakes by Individuals
data (1994-1996), found that children who consumed more soda consumed less milk and
(97), in a prospective analysis among girls ages 5 to 15, revealed that relative to girls who
were not consuming soda at age 5 years, girls who consume soda at age 5 had higher
subsequent soda intake, lower milk intake, higher intake of added sugars, and lower intakes
of protein, fiber, vitamin D, calcium, magnesium, phosphorous, and potassium from age 5 to
15 years.
The increasing autonomy that is characteristic of the adolescence allow that adolescents
beginning to buy and prepare more food for themselves. One prevalent dietary pattern
among adolescents that might contribute to the unhealthy food intake is the shift away from
home-prepared food. Consumption by 12- to 17-year-old adolescents of food prepared away
from home increased from 20% and 22% of total energy intake in boys and girls,
respectively, in the 1970s to 35% of total energy intake between 1994 and 1996 (98). The
vast amount of this increase has resulted from a more than doubling of the energy consumed
at restaurants and fast food establishments (99). Away-from-home foods might encourage
higher energy and fat intake than at-home foods because of larger portion sizes, that have
been increasing both in pre-packaged, ready-to-eat products and at restaurants (100) and is
associated with poorer diet quality among adolescents (101). An important reason to this
relation may be the popular use of fast food for meals or snacks especially among
adolescents. Fast-food was associated with significantly lower intake of fruit, vegetables,
grains and serving of milk, and with significantly higher intake of soft drinks, cheeseburgers,
pizza and French fries (101). Consequently, adolescents who frequently eat fast food
consume more energy, total fat and saturated fat, more total carbohydrates and added
sugars and less calcium, vitamin A and fiber (101-102).
Also, snacking incidence among children and adolescents has increased over the last 25
years (103). Energy intake from snacks has increased by 30% among US children and
adolescents in the last few decades, accounting for a quarter of total energy intake (103).
The effect of snacking on dietary intakes has been examined but results are contradictory.
have shown it to lower the nutrient density of the total diet (105). Thus it is unclear how this
phenomenon impacts the overall quality of the diet.
Because of the extent of the eating patterns changes taking place among adolescents, early
interventions are relevant due the tracking of behaviors throughout life which makes more
difficult changing habits later in life (59).
1.4 PYSICAL ACTIVITY AND SEDENTARY BEHAVIOURS
On the other hand, an active lifestyle during childhood and adolescence can play an
important role in optimizing growth and development. It is also a determinant of health in
adulthood (23, 106).
The global estimate for prevalence of physical inactivity among adults is 17%, ranging from 11% to 24% across WHO sub-regions. Estimates for prevalence, of some, but insufficient activity (<2.5 hours per week of moderate activity) ranged from 31% to 51%, with a global average of 41% across the same sub-regions. Overall physical inactivity was estimated to cause 1.9 million deaths (28).
Children establish a sedentary lifestyle at a young age (107), and the level of physical activity
tends to fall significantly at the time of adolescence. This is true for both gender, however it
had a major effect on girls (108-110). Recently,an expert panel conducted a comprehensive
review of the literature on physical activity in school-age youth and recommended that
children and youth participate in 60 minutes per day of physical activity that is
developmentally appropriate, enjoyable, andinvolves a variety of activities (111). The panel’s
reportsuggested that the 60 minutes can be accumulated throughout the day in school,
during physical education and recess breaks, during intramural sports,and in before-school
and after-school programs (111). Data from Portugal shows that only 8% of girls and 21% of
boys of 13-years-old reported at least one hour of moderate-to-vigorous activity daily (78).
Associated with decreased levels of physical activity are increased levels of sedentary
with obesity among children and adolescents in several epidemiologic studies (112-115).
Furthermore, reducing television viewing has reduced weight gain and prevalence of obesity
in experimental trials (113, 116). The most discuss mechanisms by witch television viewing
contributes to obesity are the reducing energy expenditure, not only because it is a sedentary
activity but also for the displacement of physical activity, and the increasing dietary energy
intake (113).
The effect on dietary energy intake may be due to snaking during viewing or from increased
highly advertised food intake (113). Previous studies demonstrating that TV viewing is
associated with less desirable dietary behaviours, including increased energy intake (112,
115, 117-118), increased consumption of high-energy foods like snacks, fast-food and soft
drinks (101, 117, 119-123), and lower consumption of fruit and vegetables (117, 119-121,
123-124). Only a few studies have examined the association between television viewing and
nutrients intake. Utter et al. found that adolescents in the high television/video category were
significantly more likely to consume a higher percent of fat energy than the average and
lower users (117). Data from other study also found significantly higher consumption of total
fat among children who watching TV more than 2 hours per day. Moreover, it was observed
that 1 hour per day increase in TV viewing time is associated with 0.22% of total energy
intake increase in total fat (118). Nevertheless, Proctor et al. reported no differences in fat,
carbohydrates, proteins, vitamin A, magnesium and calcium intake among children (115).
Others studies have been addressing not only in time spent watching TV but also in the
relationship between the presence of television at meals and children (125) and adolescents
(126) food consumption patterns. Watching TV during family meals was also associated with
lower intakes of fruit, vegetables and dairy products and higher intakes of soft drinks, meat,
pizza and snacks among children and adolescents.
Advertising broadcast is another variable that can explain the effect of television on dietary
energy intake. Television food advertisements have been linked to children’s food
food advertisements embedded within children’s programming resulted in the children
choosing the advertised brand of food over a similar unadvertised product (128).
Several content analyses of children and adolescent’s television programs showed that
foods, especially high-fat or high-sugar foods, are more frequently advertised (127, 129-130).
Powell et al. examined the nutritional content of food advertisements seen by children and
adolescents and found that 97.8% of all food-product advertisements viewed by children 2 to
11 years old were unhealthy, being either high in fat, sugar, or sodium. Among the food
advertisements seen by children 2 to 11 years old, almost all (97.6%) cereal products were
high in sugar, and the majority (78.6%) had low fiber content. Sweets were not only high in
sugar (88.6%), but almost one half (47.4%) were high in saturated fat. Almost two thirds of
advertised snacks were high in sugar, with over one third being high in fat and one quarter
being high in saturated fat. Virtually all beverage advertisements (99.5%) were for high-sugar
beverages. Compared with the advertisements viewed by their younger counterparts,
products in advertisements seen by adolescents for food in general and within each food
category were more likely to be high in fat, whereas slightly less likely to be high in sugar.
Just less than three quarters of all food advertisements seen by adolescents were high sugar
food products, whereas one quarter were high in fat and high in saturated fat. In particular,
among sweets and snack products, 46.3% and 45.1%, respectively, of food advertisements
were high in fat (129). Data from Portugal show that sugar products (67%) were the
dominant food subcategory of advertisements targeted to child/adolescent public and 86%
of the total food products advertisements could not be included in the Nova Roda dos
Alimentos (130).
Besides this issue of food advertising, watching TV is also an important predictor of
cognitive, behavioural, and physical outcomes in children and adolescents, including school
performance (131), bullying (132) and attention (133). Accordingly, the American Academy of
Pediatrics currently recommends limiting children’s television watching to no more than 2
hours of quality programming per day (134). However, a systematic review suggests that
decreases during adolescence, the earlier high users are at risk to maintain this pattern to
older ages (135). Results of the 2005-2006 HBSC study indicate that 70% of 13-year-old
adolescents report watching TV more than 2h each day in WHO European regions. In
2. AIMS
The present study was carry on during the assembling of a cohort of urban adolescents born
in 1990 enrolled at schools in Porto, known by the acronym EPITeen (Epidemiological
Investigation of Teenagers Health in Porto). We designed a cross-sectional survey to
examine the association between television viewing and dietary intake, among 13-year-old
adolescents.
The specific objectives of this thesis were: to analyse food intake (cakes, cookies, soft drinks,
chocolates, snacks of chocolate, sweets, pizza, hamburger, salty snacks and fruit and
vegetables) and macronutrients, vitamins and minerals intake, according to time spent
3. PARTICIPANTS AND METHODS
The EPITeen research project was designed to study growth, development and health in a
population-based cohort of urban adolescents, from 13 years of age until young adulthood
(69). The study addresses four primary areas of research: (1) growth and physical
development; (2) behavioural and biological risk factors; (3) prevalence of selected diseases
with large public health impact; and (4) psycho-social measures. It also aims to provide
information for a comprehensive understanding of the tracking of risk factors and their effects
on adulthood health.
The EPITeen study was approved by the ethics committee of the São João University
Hospital, Porto and by Direcção Regional de Educação do Norte, the official entity that
provides general orientation and regional policies for all schools in Porto. Policies and procedures were developed to guarantee data confidentiality and protection and written informed consent was obtained both from the adolescents and their parents or legal guardians.
The executive boards of every Porto school attended by 13-year-old adolescents (27 public and 24 private) were contacted. All public schools and 19 private schools (79%) agreed to participate.
The sample included adolescents born in 1990 and enrolled at public and private schools in
Porto, during 2003/2004.
Approximately 200 eligible students were present in non-participating schools but no effort
was made to contact them using alternative approaches. We identified 2787 eligible
adolescents. Forty-four (1.6%) could not be reached due to absences during period of
evaluation, 584 (20.9%) did not return the signed informed consent form and were
considered refusals, and 2160 ( 1651 public and 509 private schools students) agreed to
participate and provide information at least for part of the planned assessment. The overall
In addition, 631 were excluded because of no information or inconsistent information on key
variables for this work and 93 were not considered for this analysis because their total
energy intake was more than 3 interquartile deviations or their intake of fruit or vegetables
was more than 1.5 interquartile deviations. The final sample includes 1436 students (765
girls [53.3%] and 671 boys [46.7%]).
The baseline evaluation comprised two self-administered questionnaires and a physical
examination. One questionnaire was completed at home and another was completed at
school immediately before physical examination during the field team visit.
The home questionnaire comprised information on the characteristics of the adolescents and
the family, namely, demographic, social, behavioural, as well as information on perinatal
circumstances and the overall medical history and medical care use.
Parents’ educational level was recorded as an index of social and economic class. Each
adolescent was finally classified according the highest completed degree regardless of
maternal or paternal. The same procedure was followed considering parents profession,
which were obtained for both parents using open questions.
We recorded for physical activity evaluation the extra curricular activities. Leisure time
activity was obtained after completion of a set of questions focusing on the self-perceived
usual energy expenditure. To quantify usual practices of sports, adolescents where asked to
indicate the name of organized and unorganized sports, and the total time spent per week on
each sport. Time spent watching TV was evaluated as mean hours per day, separately for
week and weekend days. The total hours were computed and participants were classify in
three categories: watching 1 hour or less per day, between 1 and 2 hours and those that
watching more than 2 hours per day.
Dietary intake was evaluated using a semi-quantitative food frequency questionnaire (FFQ),
previously validated in the Portuguese adult population (136-137) and added food items
more eat by adolescents. The FFQ comprises 92 food or food group items and an additional
section to add food or food group items missing at the list. Respondents were asked to report
number of times per day, week, or month. For each food item, participants were asked to
indicate their usual consumption in any of nine frequency categories, ranging from never or
less than 1 per month to 6 or more per day. The food frequency questionnaire did not include
specific questions on portion size, a standard portion size has been considered for nutrient
calculation. The frequency reported was multiplied by the previously defined average portion
size to estimate the intake in grams or millilitres. To estimate the nutrient intake we used the
nutrient contents of the individual food items using an USA data base (Food Processor Puls®
version: 7.02). Soft drinks included soda, Ice-Tea®, fruit juices and nectars packaged.
During the visit of the research team to the schools, adolescents answered an additional
self-administered questionnaire comprising further information on health-related behaviours.
Physical activities were also reported according to a set of close questions about the
frequency and time spent in sports activities out of school.
Physical examination was performed at school, between 8 a.m. and 10 a.m. after 12-hours
overnight fast, by a team of experienced nurses, nutritionists and doctors, following
standardized procedures. The evaluation at school included measurements of
anthropometry, blood pressure, lung function and bone mineral density.
Weight was measured using a digital scale - Tanita® (in kilograms, to the nearest tenth), and height was measured (in centimetres, to the nearest tenth) using a portable stadiometer.
Body mass index was calculated and classified according to the age and sex specific body
mass index reference percentiles, developed by the United States Centers for Disease
Control and Prevention (138).
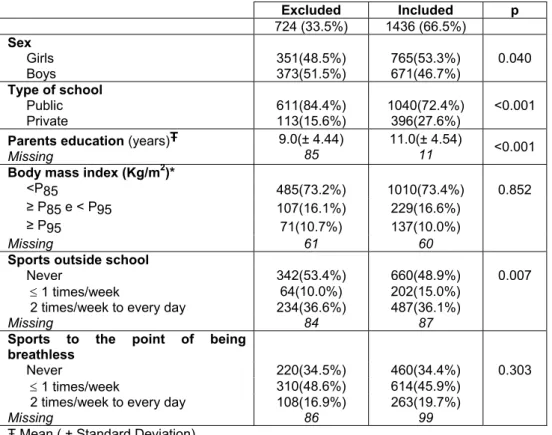
Table 1. Comparison between adolescents included and excluded. Excluded Included p 724 (33.5%) 1436 (66.5%) Sex Girls 351(48.5%) 765(53.3%) 0.040 Boys 373(51.5%) 671(46.7%) Type of school Public 611(84.4%) 1040(72.4%) <0.001 Private 113(15.6%) 396(27.6%)
Parents education (years)Ŧ
Missing
9.0(± 4.44)
85
11.0(± 4.54)
11 <0.001
Body mass index (Kg/m2)*
<P85 485(73.2%) 1010(73.4%) 0.852
≥ P85 e < P95 107(16.1%) 229(16.6%)
≥ P95 71(10.7%) 137(10.0%)
Missing 61 60
Sports outside school
Never 342(53.4%) 660(48.9%) 0.007
≤ 1 times/week 64(10.0%) 202(15.0%)
2 times/week to every day 234(36.6%) 487(36.1%)
Missing 84 87
Sports to the point of being breathless
Never 220(34.5%) 460(34.4%) 0.303
≤ 1 times/week 310(48.6%) 614(45.9%)
2 times/week to every day 108(16.9%) 263(19.7%)
Missing 86 99
Ŧ Mean ( ± Standard Deviation)
* According to the age and sex specific body mass index references percentiles developed by the United States Centers for Disease Control and Prevention.
4. REFERENCES
1. World Health Organization. Programming for adolescent health and development. World Health Organization 1999 [cited 2010 Jul 8]; Available from:
http://www.who.int/child_adolescent_health/documents/trs_886/en/index.html.
2. World Health Organization. The second decade: Improving adolescent health and development. World Health Organization 2001 [cited 2010 Oct 9]; Available from:
http://whqlibdoc.who.int/hq/1998/WHO_FRH_ADH_98.18_Rev.1.pdf.
3. World Health Organization. Child and adolescent health and development: progress report 2009: highlights. Geneva: World Health Organization 2010 [cited 2010 Jul 5]; Available from: http://whqlibdoc.who.int/publications/2010/9789241599368_eng.pdf.
4. Direcção de Serviços de Informação e Análise. Divisão de Epidemiologia. Risco de morrer em Portugal 2006 - Volume I. Lisboa: Direcção-Geral da Saúde 2009 [cited 2010 Jul 21]; Available from: http://www.dgs.pt/?cr=14952.
5. World Health Organization. 2008-2013 Action Plan for the Global Strategy for the Prevention and Control of Noncommunicable Diseases. Geneva: World Health Organization 2008 [cited 2010 Jul 21]; Available from:
http://www.who.int/nmh/Actionplan-PC-NCD-2008.pdf.
6. Mathers CD, Loncar D. Projections of global mortality and burden of disease from 2002 to 2030. PLoS Med. 2006 Nov;3(11):e442.
7. World Health Organization. Diet, nutrition and the prevention of chronic diseases. Joint WHO/FAO Expert Consultation. WHO Techninal Report Series no. 916. World Health Organization 2003 [cited 2010 Jul 18]; Available from:
http://whqlibdoc.who.int/trs/WHO_TRS_916.pdf.
8. Barker DJ. The developmental origins of chronic adult disease. Acta Paediatr Suppl. 2004 Dec;93(446):26-33.
9. Berenson GS, Srinivasan SR, Bao W, Newman WP, 3rd, Tracy RE, Wattigney WA. Association between multiple cardiovascular risk factors and atherosclerosis in children and young adults. The Bogalusa Heart Study. N Engl J Med. 1998 Jun 4;338(23):1650-6.
10. Daniels SR. Cardiovascular disease risk factors and atherosclerosis in children and adolescents. Curr Atheroscler Rep. 2001 Nov;3(6):479-85.
11. Ebbeling CB, Pawlak DB, Ludwig DS. Childhood obesity: public-health crisis, common sense cure. Lancet. 2002 Aug 10;360(9331):473-82.
12. Reilly JJ, Methven E, McDowell ZC, Hacking B, Alexander D, Stewart L, et al. Health consequences of obesity. Arch Dis Child. 2003 Sep;88(9):748-52.
14. Hanevold C, Waller J, Daniels S, Portman R, Sorof J. The effects of obesity, gender, and ethnic group on left ventricular hypertrophy and geometry in hypertensive children: a collaborative study of the International Pediatric Hypertension Association. Pediatrics. 2004 Feb;113(2):328-33.
15. Redline S, Tishler PV, Schluchter M, Aylor J, Clark K, Graham G. Risk factors for sleep-disordered breathing in children. Associations with obesity, race, and respiratory problems. Am J Respir Crit Care Med. 1999 May;159(5 Pt 1):1527-32.
16. Ford ES. The epidemiology of obesity and asthma. J Allergy Clin Immunol. 2005 May;115(5):897-909; quiz 10.
17. Michelmore KF, Balen AH, Dunger DB, Vessey MP. Polycystic ovaries and associated clinical and biochemical features in young women. Clin Endocrinol (Oxf). 1999 Dec;51(6):779-86.
18. Sorof J, Daniels S. Obesity hypertension in children: a problem of epidemic proportions. Hypertension. 2002 Oct;40(4):441-7.
19. Hampel H, Abraham NS, El-Serag HB. Meta-analysis: obesity and the risk for gastroesophageal reflux disease and its complications. Ann Intern Med. 2005 Aug 2;143(3):199-211.
20. Pashankar DS, Loening-Baucke V. Increased prevalence of obesity in children with functional constipation evaluated in an academic medical center. Pediatrics. 2005 Sep;116(3):e377-80.
21. Taylor ED, Theim KR, Mirch MC, Ghorbani S, Tanofsky-Kraff M, Adler-Wailes DC, et al. Orthopedic complications of overweight in children and adolescents. Pediatrics. 2006 Jun;117(6):2167-74.
22. Engeland A, Bjorge T, Tverdal A, Sogaard AJ. Obesity in adolescence and adulthood and the risk of adult mortality. Epidemiology. 2004 Jan;15(1):79-85.
23. Ferreira I, Twisk JW, van Mechelen W, Kemper HC, Stehouwer CD. Development of fatness, fitness, and lifestyle from adolescence to the age of 36 years: determinants of the metabolic syndrome in young adults: the amsterdam growth and health longitudinal study. Arch Intern Med. 2005 Jan 10;165(1):42-8.
24. Srinivasan SR, Myers L, Berenson GS. Predictability of childhood adiposity and insulin for developing insulin resistance syndrome (syndrome X) in young adulthood: the Bogalusa Heart Study. Diabetes. 2002 Jan;51(1):204-9.
25. Freedman DS, Khan LK, Serdula MK, Dietz WH, Srinivasan SR, Berenson GS. The relation of childhood BMI to adult adiposity: the Bogalusa Heart Study. Pediatrics. 2005 Jan;115(1):22-7.
26. World Health Organization. Prevalence of excess body weight and obesity in children and adolescents. Fact sheet no 2.3. World Health Organization 2007 [cited 2010 Mar 7]; Available from:
http://www.euro.who.int/__data/assets/pdf_file/0010/97831/ENHIS_Factsheet_2_3.pdf.
27. World Health Organization. Diet, nutrition and the prevention of chronic diseases. WHO Techninal Report Series no. 797. World Health Organization 1990 [cited 2010 Jul 18]; Available from: http://www.iaso.org/site_media/uploads/WHO_TRS_797_part1.pdf.
28. World Health Organization. The World Health Report 2002. Reducing risks, promoting healthy life. World Health Organization 2002 [cited 2010 Jul 8]; Available from:
http://www.who.int/whr/2002/en/whr02_en.pdf.
29. Dauchet L, Amouyel P, Hercberg S, Dallongeville J. Fruit and vegetable consumption and risk of coronary heart disease: a meta-analysis of cohort studies. J Nutr. 2006 Oct;136(10):2588-93.
30. Appel LJ, Moore TJ, Obarzanek E, Vollmer WM, Svetkey LP, Sacks FM, et al. A clinical trial of the effects of dietary patterns on blood pressure. DASH Collaborative Research Group. N Engl J Med. 1997 Apr 17;336(16):1117-24.
31. Ness AR, Maynard M, Frankel S, Smith GD, Frobisher C, Leary SD, et al. Diet in childhood and adult cardiovascular and all cause mortality: the Boyd Orr cohort. Heart. 2005 Jul;91(7):894-8.
32. Maynard M, Gunnell D, Emmett P, Frankel S, Davey Smith G. Fruit, vegetables, and antioxidants in childhood and risk of adult cancer: the Boyd Orr cohort. J Epidemiol Community Health. 2003 Mar;57(3):218-25.
33. Miller HE, Rigelhof F, Marquart L, Prakash A, Kanter M. Antioxidant content of whole grain breakfast cereals, fruits and vegetables. J Am Coll Nutr. 2000 Jun;19(3 Suppl):312S-9S.
34. Schatzkin A, Park Y, Leitzmann MF, Hollenbeck AR, Cross AJ. Prospective study of dietary fiber, whole grain foods, and small intestinal cancer. Gastroenterology. 2008 Oct;135(4):1163-7.
35. Ludwig DS, Pereira MA, Kroenke CH, Hilner JE, Van Horn L, Slattery ML, et al. Dietary fiber, weight gain, and cardiovascular disease risk factors in young adults. JAMA. 1999 Oct 27;282(16):1539-46.
36. Meyer KA, Kushi LH, Jacobs DR, Jr., Slavin J, Sellers TA, Folsom AR. Carbohydrates, dietary fiber, and incident type 2 diabetes in older women. Am J Clin Nutr. 2000 Apr;71(4):921-30.
37. Slavin JL. Position of the American Dietetic Association: health implications of dietary fiber. J Am Diet Assoc. 2008 Oct;108(10):1716-31.
38. Williams CL. Importance of dietary fiber in childhood. J Am Diet Assoc. 1995 Oct;95(10):1140-6, 9; quiz 7-8.
39. Kris-Etherton P, Daniels SR, Eckel RH, Engler M, Howard BV, Krauss RM, et al. Summary of the scientific conference on dietary fatty acids and cardiovascular health: conference summary from the nutrition committee of the American Heart Association. Circulation. 2001 Feb 20;103(7):1034-9.
40. Srinath Reddy K, Katan MB. Diet, nutrition and the prevention of hypertension and cardiovascular diseases. Public Health Nutr. 2004 Feb;7(1A):167-86.
41. Hu FB, Manson JE, Willett WC. Types of dietary fat and risk of coronary heart disease: a critical review. J Am Coll Nutr. 2001 Feb;20(1):5-19.
42. Bailey DA, Martin AD, McKay HA, Whiting S, Mirwald R. Calcium accretion in girls and boys during puberty: a longitudinal analysis. J Bone Miner Res. 2000 Nov;15(11):2245-50.
43. World Health Organization. Prevention and management of osteoporosis. Report of a WHO Scientific Group. WHO Techninal Report Series no. 921. World Health Organization 2003 [cited 2010 Aug 9]; Available from: http://whqlibdoc.who.int/trs/who_trs_921.pdf.
44. Nieves JW. Osteoporosis: the role of micronutrients. Am J Clin Nutr. 2005 May;81(5):1232S-9S.
45. Tylavsky FA, Holliday K, Danish R, Womack C, Norwood J, Carbone L. Fruit and vegetable intakes are an independent predictor of bone size in early pubertal children. Am J Clin Nutr. 2004 Feb;79(2):311-7.
46. Standing Committee on the Scientific Evaluation of Dietary Reference Intakes, Food and Nutrition Board, Institute of Medicine. Dietary Reference Intakes for Calcium, Phosphorus, Magnesium, Vitamin D, and Fluoride. National Academy Press 1997 [cited 2010 Jul 21]; Available from: http://books.nap.edu/openbook.php?record_id=5776&page=R1. 47. Lanou AJ, Berkow SE, Barnard ND. Calcium, dairy products, and bone health in children and young adults: a reevaluation of the evidence. Pediatrics. 2005 Mar;115(3):736-43.
48. Trichopoulou A. Traditional Mediterranean diet and longevity in the elderly: a review. Public Health Nutr. 2004 Oct;7(7):943-7.
49. Trichopoulou A, Kouris-Blazos A, Wahlqvist ML, Gnardellis C, Lagiou P, Polychronopoulos E, et al. Diet and overall survival in elderly people. BMJ. 1995 Dec 2;311(7018):1457-60.
50. Trichopoulou A, Costacou T, Bamia C, Trichopoulos D. Adherence to a Mediterranean diet and survival in a Greek population. N Engl J Med. 2003 Jun 26;348(26):2599-608.
51. Mitrou PN, Kipnis V, Thiebaut AC, Reedy J, Subar AF, Wirfalt E, et al. Mediterranean dietary pattern and prediction of all-cause mortality in a US population: results from the NIH-AARP Diet and Health Study. Arch Intern Med. 2007 Dec 10;167(22):2461-8.
52. Trichopoulou A, Orfanos P, Norat T, Bueno-de-Mesquita B, Ocke MC, Peeters PH, et al. Modified Mediterranean diet and survival: EPIC-elderly prospective cohort study. BMJ. 2005 Apr 30;330(7498):991.
53. Haveman-Nies A, de Groot LP, Burema J, Cruz JA, Osler M, van Staveren WA. Dietary quality and lifestyle factors in relation to 10-year mortality in older Europeans: the SENECA study. Am J Epidemiol. 2002 Nov 15;156(10):962-8.
54. Knoops KT, de Groot LC, Kromhout D, Perrin AE, Moreiras-Varela O, Menotti A, et al. Mediterranean diet, lifestyle factors, and 10-year mortality in elderly European men and women: the HALE project. JAMA. 2004 Sep 22;292(12):1433-9.
55. Tanner JM, Whitehouse RH. Clinical longitudinal standards for height, weight, height velocity, weight velocity, and stages of puberty. Arch Dis Child. 1976 Mar;51(3):170-9.
56. Coleman L, Coleman J. The measurement of puberty: a review. J Adolesc. 2002 Oct;25(5):535-50.
57. Steinberg L. Cognitive and affective development in adolescence. Trends Cogn Sci. 2005 Feb;9(2):69-74.
58. World Health Organization. Contraception - Issues in adolescent health and development. World Health Organization 2004 [cited 2010 Jul 22]; Available from:
http://whqlibdoc.who.int/publications/2004/9241591447_eng.pdf.
59. World Health Organization. Nutrition in adolescence - Issues and challenges for the health sector. Issues in adolescent health and development. World Health Organization 2005 [cited 2010 Jul 8]; Available from:
http://whqlibdoc.who.int/publications/2005/9241593660_eng.pdf.
60. Thomas J. Food choices and preferences of schoolchildren. Proc Nutr Soc. 1991 Mar;50(1):49-57.
61. Shepherd R, Dennison CM. Influences on adolescent food choice. Proc Nutr Soc. 1996 Mar;55(1B):345-57.
62. Daniels SR, Arnett DK, Eckel RH, Gidding SS, Hayman LL, Kumanyika S, et al. Overweight in children and adolescents: pathophysiology, consequences, prevention, and treatment. Circulation. 2005 Apr 19;111(15):1999-2012.
63. James PT, Leach R, Kalamara E, Shayeghi M. The worldwide obesity epidemic. Obes Res. 2001 Nov;9 Suppl 4:228S-33S.
64. Ogden CL, Flegal KM, Carroll MD, Johnson CL. Prevalence and trends in overweight among US children and adolescents, 1999-2000. JAMA. 2002 Oct 9;288(14):1728-32.
65. Ogden CL, Carroll MD, Curtin LR, McDowell MA, Tabak CJ, Flegal KM. Prevalence of overweight and obesity in the United States, 1999-2004. JAMA. 2006 Apr 5;295(13):1549-55. 66. Ogden CL, Carroll MD, Flegal KM. High body mass index for age among US children and adolescents, 2003-2006. JAMA. 2008 May 28;299(20):2401-5.
67. Padez C, Fernandes T, Mourao I, Moreira P, Rosado V. Prevalence of overweight and obesity in 7-9-year-old Portuguese children: trends in body mass index from 1970-2002. Am J Hum Biol. 2004 Nov-Dec;16(6):670-8.
68. Ogden CL, Carroll MD, Curtin LR, Lamb MM, Flegal KM. Prevalence of high body mass index in US children and adolescents, 2007-2008. JAMA. 2010 Jan 20;303(3):242-9. 69. Ramos E, Barros H. Family and school determinants of overweight in 13-year-old Portuguese adolescents. Acta Paediatr. 2007 Feb;96(2):281-6.
70. Spear BA. Adolescent growth and development. J Am Diet Assoc. 2002 Mar;102(3 Suppl):S23-9.
71. Otten JJ, Hellwig JP, Meyers LD. Dietary Reference Intakes: The Essential Guide to Nutrient Requirements. Washington: National Academy Press; 2006.
72. Gidding SS, Dennison BA, Birch LL, Daniels SR, Gillman MW, Lichtenstein AH, et al. Dietary recommendations for children and adolescents: a guide for practitioners. Pediatrics. 2006 Feb;117(2):544-59.
73. French SA, Story M, Jeffery RW. Environmental influences on eating and physical activity. Annu Rev Public Health. 2001;22:309-35.
74. Alexy U, Sichert-Hellert W, Kersting M. Fifteen-year time trends in energy and macronutrient intake in German children and adolescents: results of the DONALD study. Br J Nutr. 2002 Jun;87(6):595-604.
75. Nicklas TA, Elkasabany A, Srinivasan SR, Berenson G. Trends in nutrient intake of 10-year-old children over two decades (1973-1994) : the Bogalusa Heart Study. Am J Epidemiol. 2001 May 15;153(10):969-77.
76. Franco T. Prevalência de ingestão inadequada e seus determinantes em Adolescentes do Porto [MPH Thesis]. Porto: University of Porto; 2009.
77. Cavadini C, Siega-Riz AM, Popkin BM. US adolescent food intake trends from 1965 to 1996. Arch Dis Child. 2000 Jul;83(1):18-24.
78. Currie C et al., eds. Inequalities in young people’s health. Health Behaviour in School-aged Children (HBSC) study: international report from the 2005/2006 survey. Copenhagen, WHO Regional Office for Europe, 2008.
79. Guenther PM, Dodd KW, Reedy J, Krebs-Smith SM. Most Americans eat much less than recommended amounts of fruits and vegetables. J Am Diet Assoc. 2006 Sep;106(9):1371-9.
80. Pomerleau J, Lock K, McKee M, Altmann DR. The challenge of measuring global fruit and vegetable intake. J Nutr. 2004 May;134(5):1175-80.
81. Larson NI, Neumark-Sztainer D, Hannan PJ, Story M. Trends in adolescent fruit and vegetable consumption, 1999-2004: project EAT. Am J Prev Med. 2007 Feb;32(2):147-50. 82. Cullen KW, Eagan J, Baranowski T, Owens E, de Moor C. Effect of a la carte and snack bar foods at school on children's lunchtime intake of fruits and vegetables. J Am Diet Assoc. 2000 Dec;100(12):1482-6.
83. Rampersaud GC, Pereira MA, Girard BL, Adams J, Metzl JD. Breakfast habits, nutritional status, body weight, and academic performance in children and adolescents. J Am Diet Assoc. 2005 May;105(5):743-60; quiz 61-2.
84. Chitra U, Reddy CR. The role of breakfast in nutrient intake of urban schoolchildren. Public Health Nutr. 2007 Jan;10(1):55-8.
85. Affenito SG, Thompson DR, Barton BA, Franko DL, Daniels SR, Obarzanek E, et al. Breakfast consumption by African-American and white adolescent girls correlates positively with calcium and fiber intake and negatively with body mass index. J Am Diet Assoc. 2005 Jun;105(6):938-45.
86. Billon S, Lluch A, Gueguen R, Berthier AM, Siest G, Herbeth B. Family resemblance in breakfast energy intake: the Stanislas Family Study. Eur J Clin Nutr. 2002 Oct;56(10):1011-9.
87. Deshmukh-Taskar PR, Nicklas TA, O'Neil CE, Keast DR, Radcliffe JD, Cho S. The relationship of breakfast skipping and type of breakfast consumption with nutrient intake and weight status in children and adolescents: the National Health and Nutrition Examination Survey 1999-2006. J Am Diet Assoc. 2010 Jun;110(6):869-78.
88. Keski-Rahkonen A, Kaprio J, Rissanen A, Virkkunen M, Rose RJ. Breakfast skipping and health-compromising behaviors in adolescents and adults. Eur J Clin Nutr. 2003 Jul;57(7):842-53.
89. Affenito SG, Thompson DR, Franko DL, Striegel-Moore RH, Daniels SR, Barton BA, et al. Longitudinal assessment of micronutrient intake among African-American and white girls: The National Heart, Lung, and Blood Institute Growth and Health Study. J Am Diet Assoc. 2007 Jul;107(7):1113-23.
90. Salamoun MM, Kizirian AS, Tannous RI, Nabulsi MM, Choucair MK, Deeb ME, et al. Low calcium and vitamin D intake in healthy children and adolescents and their correlates. Eur J Clin Nutr. 2005 Feb;59(2):177-84.
91. Rajeshwari R, Nicklas TA, Yang SJ, Berenson GS. Longitudinal changes in intake and food sources of calcium from childhood to young adulthood: the bogalusa heart study. J Am Coll Nutr. 2004 Aug;23(4):341-50.
92. Moreira P, Padez C, Mourao I, Rosado V. Dietary calcium and body mass index in Portuguese children. Eur J Clin Nutr. 2005 Jul;59(7):861-7.
93. Harnack L, Stang J, Story M. Soft drink consumption among US children and adolescents: nutritional consequences. J Am Diet Assoc. 1999 Apr;99(4):436-41.
94. Nielsen SJ, Popkin BM. Changes in beverage intake between 1977 and 2001. Am J Prev Med. 2004 Oct;27(3):205-10.
95. Vartanian LR, Schwartz MB, Brownell KD. Effects of soft drink consumption on nutrition and health: a systematic review and meta-analysis. Am J Public Health. 2007 Apr;97(4):667-75.
96. Frary CD, Johnson RK, Wang MQ. Children and adolescents' choices of foods and beverages high in added sugars are associated with intakes of key nutrients and food groups. J Adolesc Health. 2004 Jan;34(1):56-63.
97. Fiorito LM, Marini M, Mitchell DC, Smiciklas-Wright H, Birch LL. Girls' early sweetened carbonated beverage intake predicts different patterns of beverage and nutrient intake across childhood and adolescence. J Am Diet Assoc. 2010 Apr;110(4):543-50.
98. Guthrie JF, Lin BH, Frazao E. Role of food prepared away from home in the American diet, 1977-78 versus 1994-96: changes and consequences. J Nutr Educ Behav. 2002 May-Jun;34(3):140-50.
99. Nielsen SJ, Siega-Riz AM, Popkin BM. Trends in food locations and sources among adolescents and young adults. Prev Med. 2002 Aug;35(2):107-13.
100. Nielsen SJ, Popkin BM. Patterns and trends in food portion sizes, 1977-1998. JAMA. 2003 Jan 22-29;289(4):450-3.
101. French SA, Story M, Neumark-Sztainer D, Fulkerson JA, Hannan P. Fast food restaurant use among adolescents: associations with nutrient intake, food choices and behavioral and psychosocial variables. Int J Obes Relat Metab Disord. 2001 Dec;25(12):1823-33.
102. Bowman SA, Gortmaker SL, Ebbeling CB, Pereira MA, Ludwig DS. Effects of fast-food consumption on energy intake and diet quality among children in a national household survey. Pediatrics. 2004 Jan;113(1 Pt 1):112-8.
103. Jahns L, Siega-Riz AM, Popkin BM. The increasing prevalence of snacking among US children from 1977 to 1996. J Pediatr. 2001 Apr;138(4):493-8.
104. Sebastian RS, Cleveland LE, Goldman JD. Effect of snacking frequency on adolescents' dietary intakes and meeting national recommendations. J Adolesc Health. 2008 May;42(5):503-11.
105. Ovaskainen ML, Reinivuo H, Tapanainen H, Hannila ML, Korhonen T, Pakkala H. Snacks as an element of energy intake and food consumption. Eur J Clin Nutr. 2006 Apr;60(4):494-501.