Household Socioeconomic and Demographic
Correlates of
Cryptosporidium
Seropositivity
in the United States
Daniel J. Becker1, James Oloya2, Amara E. Ezeamama2*
1Odum School of Ecology, University of Georgia, Athens, Georgia, United States of America,2Department of Epidemiology & Biostatistics, College of Public Health, University of Georgia, Athens, Georgia, United States of America
*aezeamam@uga.edu
Abstract
Background
Cryptosporidiumare parasitic protozoa that infect humans, domestic animals, and wildlife globally. In the United States, cryptosporidiosis occurs in an estimated 750,000 persons annually, and is primarily caused by either of theCryptosporidium parvumgenotypes 1 and 2, exposure to which occurs through ingestion of food or water contaminated with oocytes shed from infected hosts. Although most cryptosporidiosis cases are caused by genotype 1 and are of human origin, the zoonotic sources of genotype 2, such as livestock, are increas-ingly recognized as important for understanding human disease patterns. Social inequality could mediate patterns of human exposure and infection by placing individuals in environ-ments where food or water contamination and livestock contact is high or through reducing the availability of educational and sanitary resources required to avoid exposure.
Methodology/Principal Findings
We here analyzed data from the National Health and Nutritional Examination Survey (NHANES) between 1999 and 2000, and related seropositivity toCryptosporidium par-vumto correlates of social inequality at the household and individual scale. After account-ing for the complex samplaccount-ing design of NHANES and confoundaccount-ing by individual
demographics and household conditions, we found impaired household food adequacy was associated with greater odds ofCryptosporidiumseropositivity. Additionally, we iden-tified individuals of non-white race and ethnicity and those born outside the United States as having significantly greater risk than white, domestic-born counterparts. Furthermore, we provide suggestive evidence for direct effects of family wealth onCryptosporidium
seropositivity, in that persons from low-income households and from families close to the poverty threshold had elevated odds of seropositivity relative to those in high-income fam-ilies and in households far above the poverty line.
OPEN ACCESS
Citation:Becker DJ, Oloya J, Ezeamama AE (2015) Household Socioeconomic and Demographic Correlates ofCryptosporidiumSeropositivity in the United States. PLoS Negl Trop Dis 9(9): e0004080. doi:10.1371/journal.pntd.0004080
Editor:Patrick J. Lammie, Centers for Disease Control and Prevention, UNITED STATES
Received:May 17, 2015
Accepted:August 21, 2015
Published:September 14, 2015
Copyright:© 2015 Becker et al. This is an open access article distributed under the terms of the
Creative Commons Attribution License, which permits unrestricted use, distribution, and reproduction in any medium, provided the original author and source are credited.
Data Availability Statement:All data underlying the findings are fully available without restriction. Data from this study were taken from the National Health and Nutrition Examination Survey (NHANES), a publicly available, deidentified data set produced by the National Center for Health Statistics (NCHS) in the United States. Those wishing to access the 1999–2000 SAS files may download them at the
following link:http://wwwn.cdc.gov/nchs/nhanes/ search/nhanes99_00.aspx.
Conclusions/Significance
These results refute assertions that cryptosporidiosis in the United States is independent of social marginalization and poverty, and carry implications for targeted public health inter-ventions forCryptosporidiuminfection in resource-poor groups. Future longitudinal and multilevel studies are necessary to elucidate the complex interactions between ecological factors, social inequality, andCryptosporidiumdynamics.
Author Summary
We examined if and how social inequality in the United States influences seropositivity to Cryptosporidium parvum. By using nationwide data on parasite seropositivity, demo-graphics, and household metrics of socioeconomic status provided through the National Health and Nutritional Examination Survey, we quantified how measures of social inequality affect the odds of parasite infection. After adjusting for the complex sampling design of NHANES and potential confounding by individual demographics and household conditions, we found household food inadequacy was associated with greater parasite seropositivity. Additionally, we found that individuals of non-white races and ethnicities and those born outside of the United States have significantly greater odds of seropositivity than white, domestic-born counterparts. Furthermore, our study suggests evidence for direct effects of family wealth on cryptosporidiosis risk, in that persons in low-income households have elevated odds of parasite seropositivity relative to those in high-income families. These results refute the claim that cryptosporidiosis in the United States in inde-pendent of poverty and social marginalization and carry implications for targeted public health interventions for this parasitic infection in resource-poor groups.
Introduction
Cryptosporidiumare parasitic protozoa that infect humans, domestic animals, and wildlife globally [1]. In humans, cryptosporidiosis is a major cause of global diarrheal illness, and in the United States an estimated 750000 cases occur annually [2]. Although direct mortality from Cryptosporidiuminfection is rare and often limited to immunocompromised individuals, cryptosporidiosis can cause significant morbidity that in turn can result in high healthcare expenses and losses to productivity [3–5]. Human cryptosporidiosis is primarily caused by either of theCryptosporidium parvumgenotypes 1 and 2, also known asCryptosporidium hominisandCryptosporidium parvum[6,7]. Human exposure toCryptosporidium parvum occurs primarily through ingestion of food or water contaminated with oocytes shed from infected hosts [8,9]. While genotype 1 is limited to human transmission cycles [10], transmis-sion of genotype 2 is based in livestock reservoir hosts such as cattle [11]. Although the major-ity of cryptosporidiosis cases are caused by genotype 1, the zoonotic capacmajor-ity of genotype 2 is increasingly recognized as important for understanding human disease patterns [12–14]. For example, cryptosporidiosis cases in the United Kingdom are highest in agricultural areas that utilize cattle manure [15], and water-borne outbreaks in Ireland and the United States have been traced back to cattle [16,17]. Furthermore, exposure directly from livestock has also been observed, particularly among persons working closely with cattle such as children and farm-workers [18,19].
for College Students Foundation Award (https://www. arcsfoundation.org/) to DJB. The funders had no role in study design, data collection and analysis, decision to publish, or preparation of the manuscript.
Despite potential linkages between livestock reservoir sources and cryptosporidiosis, we know less about how social inequality may mediate patterns of human exposure and infection. This is unfortunate, asCryptosporidiumis now included in the WHO Neglected Disease Initia-tive [20], and epidemiological evidence suggests low socioeconomic conditions may amplify human risk. A cross-sectional study in Venezuela found individuals residing in poor urban sec-tors and in thatched roof–style housing had higherCryptosporidiumprevalence [21]. In a simi-lar setting in Brazil, household water and nearby domestic animals tested positive for
Cryptosporidiumoocysts [22]. Such work suggests living in physically impaired environments can increase exposure to contaminated water or animals harboring infection [23]. An impaired social environment could also influence patterns of human exposure, as individuals within these environments may lack resources necessary for proper sanitation or educational avoid-ance of transmission routes. For example, women in Kenyan agricultural communities had greater exposure to cattle and contaminated food and water owing to power hierarchies within households [24].
A major limitation of past work on social determinants of cryptosporidiosis is a focus on either the individual or household level at small spatial scales, restricting understanding inter-actions between scales and broader inference [25]. To simultaneously address individual- and household-scale socioeconomic drivers of cryptosporidiosis risk, we utilized the National Health and Nutrition Examination Survey (NHANES) from the United States to ask how poor physical and social conditions affect the odds of seropositivity toCryptosporidium parvum. Several reviews of neglected infections in the United States have noted that cryptosporidiosis is without significant links to poverty or social marginalization [26,27], and socioeconomic fac-tors remain absent in syntheses of risk facfac-tors for this disease in the United States [28]. Yet a prior analysis of NHANES found that Hispanics, African Americans, and women all have greater odds ofCryptosporidiumseropositivity [29]. Incorporation of household-scale socioe-conomics may therefore improve our understanding of how an impaired physical or social environment contextualizes these individual-level relationships. Furthermore, reorienting our focus on cryptosporidiosis towards socioeconomic determinants could offer tangible opportu-nities for public health interventions and environmental management.
Methods
Population and design
Our analysis used cross-sectional data from NHANES, a series of large nationally representa-tive surveys conducted by the National Center for Health Statistics (NCHS) based on a strati-fied, multistage, probability cluster design. Data are collected through household interviews, standardized physical examinations, and collection of biological samples at mobile examina-tion centers. A naexamina-tionally representative sample is selected annually, but data are released in two-year cycles to protect confidentiality and increase statistical reliability. All data were obtained from NHANES between 1999 and 2000, the only two years for which Cryptosporid-iumserological testing occurred.
available for relevant socioeconomic and demographic covariates for this study. Participants with hemophilia or recipients of chemotherapy within four weeks were excluded.
Ethics statement
NHANES is reviewed and approved annually by the NCHS institutional review board, and informed written consent was obtained from all participants or their parents or legal guardians. All individual records were anonymized through unique respondent sequence numbers within NHANES.
Determining seropositivity
Infection withCryptosporidium parvumis accompanied by the production of parasite-specific antibody (Ig) of all major classes [30,31]. NHANES used an experimental enzyme-linked immunosorbent assay (ELISA) to measure IgG antibodies to two surface antigens to Cryptospo-ridium parvum, 17kDA and 27kDA [32,33]. In experimental human studies, IgG reactivity to these antigens peaks within 4 to 6 weeks [34]. The IgG response to 17kDA declines to near background levels by 4 to 6 months, whereas the same antibody response to 27kDA can remain elevated for at least 6 to 12 months [35,36]. Evidence from animal and human studies suggests that this antibody response requires inoculation withCryptosporidium parvumoocysts and that seropositivity to both antigens develops after either asymptomatic or symptomatic infec-tion [34,37]. Hence the IgG response to both antigen groups likely reflects recent or current Cryptosporidium parvuminfection and not merely exposure [36,38].
To determine seropositivity toCryptosporidium parvum, serum samples were tested for reactivity to both antigen groups through the ELISA methods detailed by NHANES and [32,33]. Briefly, sample absorbance was measured using a Molecular Devices UVmax kinetic microplate reader, and IgG levels were assigned a unit value based on the eight-point positive control standard curve with a four-parameter curve fit. The 1:50 dilution of the positive control was assigned a value of 6400 units; unknown samples with absorbance values above the stan-dard curve were diluted further and reassayed. Cutoff values to determine seropositivity are not reported within NHANES; however, prior studies have used cutoffs for seropositivity to the 17kDA and 27kDA antigens as a sample absorbance greater than 86 units, exceeding the mean plus three standard deviations of the negative control, or exceeding 10% of the positive control [38–40].
NHANES reports seropositivity separately to the 17kDA and 27kDA antigen groups as binary outcomes. Because of our interest in the social determinants ofCryptosporidium sero-positivity, which likely remain constant through the duration of both IgG antibody responses, we here report seropositivity as a positive IgG response to both 17kDA and 27kDA antigen groups. Following experimental studies, a seropositive response to both of these antigens repre-sents a likely recent or current infection with either genotype 1 or genotype 2 of Cryptosporid-ium parvum[36,38]; however, a seropositive result does not distinguish between the distinct human or zoonotic sources of oocysts nor whether or not an individual is currently infected.
Socioeconomic covariates and confounding
qualities of food [41,42]. To consider direct effects of financial resources onCryptosporidium seropositivity, annual income was defined as total combined family income and was divided evenly into categories of less than $25,000, between $25,000 and $45,000, and greater than $45,000. The PIR was calculated within NHANES to provide a relative measure of income rela-tive to poverty thresholds. Annual family income was divided by the poverty guidelines specific to family size and the appropriate year and state. A PIR less than one indicates a household below the poverty threshold, whereas a ratio of one or greater indicates income above that pov-erty threshold. We reclassified the PIR into even categories of households below the povpov-erty threshold (PIR<1), households one to three times above the poverty threshold (PIR 1–3), and
households with income more than three times above the poverty threshold (PIR 3+). In addition to these primary household socioeconomic variables, we also considered con-founding by the source and treatment status of household water, asCryptosporidium parvumis predominantly transmitted through water-borne pathways and untreated water may also be symptomatic of low socioeconomic status. The source of household water was defined as a pri-vate or public water company, a pripri-vate or public well, or another source. Water treatment was defined as whether or not the following treatment devices were used within a household: pitcher water filter, ceramic or charcoal filter, water softener, aerator, or reverse osmosis. Our analysis also considered the size of a household, defined as the number of rooms per home, to account for larger households potentially stemming from greater wealth.
We also considered confounding by demographic covariates of individual race and ethnic-ity, age, gender, country of birth, and education [29]. Age was defined in one-year intervals, and race and ethnicity were defined by self-report and categorized as non-Hispanic white, non-Hispanic black, Mexican American, and other. Country of birth was categorized as the United States, Mexico, or other. Education was defined by the highest grade of school pleted, which we reclassified into a binary variable describing whether or not individuals com-pleted high school. Lastly, associations between socioeconomic status andCryptosporidium parvumcould be confounded by individual health status, as immunocompromised persons are more susceptible to infection [1,43]. Lymphocytes play key roles in the immune defense against Cryptosporidium, and in particular T helper lymphocytes (CD4+ cells) are required for parasite clearance [31,44]. We therefore considered the number of thousand lymphocytes per microliter of blood in our analyses, derived from the total count of leukocytes times the differential count of percent lymphocytes. Although NHANES has directly quantified CD4+ counts, these data were only available for human immunodeficiency virus–positive individuals, which represent a very small subset of the sample tested forCryptosporidiumseropositivity (n = 34 records,<1%
of dataset).
Statistical analysis
[51,52]. To adjust for the NHANES survey design, the degrees of freedom for Wald tests were calculated as the number of primary sampling units (n = 27) minus the number of strata (n = 13). This method is recommended for retaining power when considering individual-level covariates within a survey-adjusted analysis [49,53]. Due to this limited degrees of freedom imposed by the sampling design (df = 14), we only included covariates withp<0.20 from a
Satterthwaite-adjustedFstatistic as potential confounders to avoid overfitting final multivari-able models (shown inTable 1).
We next constructed three survey-weighted multiple logistic regression models. These mod-els incorporated household socioeconomic variables separately owing to strong associations between each (S1 Table). For each household socioeconomic variable (food adequacy, annual income, PIR), we included confounder variables within each model to then test associations between impaired environments andCryptosporidiumseropositivity. We again used Wald tests as the omnibus test of covariate significance within each model, and those variables with p0.05 from a Satterthwaite-adjustedFstatistic were considered significant. We also tested for differences between groups within each exposure variable after adjusting for the potentially inflated false-discovery rate associated with multiple comparisons using the Benjamini and Hochberg correction andmultcomppackage in R [54,55]. Crude and adjusted odds ratios and 95% confidence intervals were reported for all variables in the final survey-weighted models. Odds ratios and confidence intervals from the survey-weighted logistic regression models were also calculated using the adjusted degrees of freedom described above. Owing to the cross-sec-tional nature of NHANES, neither cause–effect relationships nor distinction between recent or currentCryptosporidiuminfection can be established, and hence odds ratios should be inter-preted accordingly.
Results
Of the 4359 persons tested for seropositivity to theCryptosporidium parvum17kDA and 27kDA antigen groups in our NHANES sample, 925 persons were IgG positive. This corre-sponds to a weighted seroprevalence for individuals aged 6 and 49 years of 21.2% (95% CI = 18.5–23.9%). Seroprevalence estimates specific to household food adequacy, family income, PIR, water source and treatment, household size, age, gender, race and ethnicity, coun-try of birth, education, and immunocompetence (lymphocyte count) are shown inTable 1. Seropositivity was influenced by all household socioeconomic variables in our univariate analy-ses (allF2,14>2.7, allp0.10), with living in low-income households, close to the poverty
line, and with food inadequacy associated with increased odds of seropositivity. Demographics were also strong correlates of seropositivity, with odds increasing with age (F1,14= 188.96,
p<0.001); with seroprevalence higher among non-Hispanic blacks, Mexican Americans, and
other racial and ethnic groups than non-Hispanic whites (F3,14= 81.29,p<0.001); and with
seroprevalence higher among persons born outside the United States compared to those born within the country (F2,14= 52.53,p<0.001). Odds of seropositivity differed little between men
and women (F1,14=2.2,p= 0.162) and were not influenced by individual lymphocyte count
(F1,14=0.86,p= 0.371). Lastly, we found significant associations between serostatus and home
water treatment (F1,14= 4.91,p= 0.045) but not with the source of household water (F2,14=
1.42,p =0.28); household size was also a weak negative predictor of seroprevalence (F1,14=
2.58,p =0.132).
Table 1. Cryptosporidium parvumIgG seropositivity to the 17kDA and 27kDA antigens among persons aged 6–49 in the United States, NHANES
1999–2000.
Variablesa 17kDA & 27kDA antigen test
Sample 4359 (100%) IgG negative 3434 (78.8%) IgG positive 925 (21.2%) F p
Food adequacy 3.35 0.07
Enough 3190 (73.18) 2555 (74.40) 635 (68.65)
Some 944 (21.66) 715 (20.82) 229 (24.76)
Not enough 225 (5.16) 164 (4.78) 61 (6.59)
Annual income 2.89 0.09
Less than $25,000 2051 (47.05) 1548 (45.08) 503 (54.38)
$25,000 to $45,000 963 (22.09) 766 (22.31) 197 (21.30)
Greater than $45,000 1345 (30.86) 1120 (32.62) 225 (24.32)
Poverty income ratio 6.47 0.01
PIR<1 1339 (30.72) 1028 (29.94) 311 (33.62)
PIR 1–3 1799 (41.27) 1392 (40.54) 407 (44.00)
PIR 3+ 1221 (28.01) 1014 (29.53) 207 (22.38)
Age (years) 188.96 <0.001
Mean (SD) 22.17 (11.95) 20.64 (11.39) 27.86 (12.26)
Race & ethnicity 81.29 <0.001
White 1334 (30.60) 1147 (33.40) 187 (20.22)
Black 1060 (24.32) 849 (24.72) 211 (22.81)
Hispanic 1860 (42.67) 1357 (39.52) 503 (54.38)
Other 105 (2.41) 81 (2.36) 24 (2.59)
Country of birth 68.29 <0.001
United States 3470 (79.61) 2903 (84.54) 567 (61.30)
Mexico 581 (13.33) 336 (9.78) 245 (26.49)
Other 308 (7.07) 195 (5.68) 113 (12.22)
Water treatment 4.91 0.04
Yes 855 (19.61) 700 (20.38) 155 (16.76)
No 3504 (80.39) 2734 (79.62) 770 (83.24)
Education 4.48 0.05
Less than high school 2852 (65.43) 2302 (67.04) 550 (59.46)
High school or greater 1507 (34.57) 1132 (32.96) 375 (40.54)
House size (rooms) 2.58 0.13
Mean (SD) 5.76 (1.94) 5.85 (1.96) 5.44 (1.83)
Gender 2.20 0.16
Male 2123 (48.70) 1716 (49.97) 407 (44.00)
Female 2236 (51.30) 1718 (50.03) 518 (56.00)
Water source 1.42 0.28
Company 3917 (89.86) 3098 (90.22) 819 (88.54)
Well 413 (9.47) 313 (9.11) 100 (10.81)
Other 29 (0.67) 23 (0.67) 6 (0.65)
Lymphocyte number 0.86 0.37
Mean (SD) 2.26 (0.68) 2.26 (0.69) 2.24 (0.65)
a
Percentages in each row give the proportion of each variable group with a negative or positive IgG response to the 17kDA and 27kDA antigens relative to the column total. Statistics in bold show covariates wherep<0.15 from a Satterthwaite-adjustedFstatistic via a Wald test with survey-adjusted degrees of freedom.
Cryptosporidiumseropositivity, we also included the total lymphocyte count in our multivari-able models to adjust for immunosuppressed individuals being more susceptible to the parasite [31,44]. Additionally, although the effect of household socioeconomic status on Cryptosporid-iumseropositivity could depend on individual age and warrant age-stratified analyses, we found no support for an interaction between age and all three socioeconomic conditions (S2 Table,S1 Fig) and thus retained age as a separate fixed effect in all models.
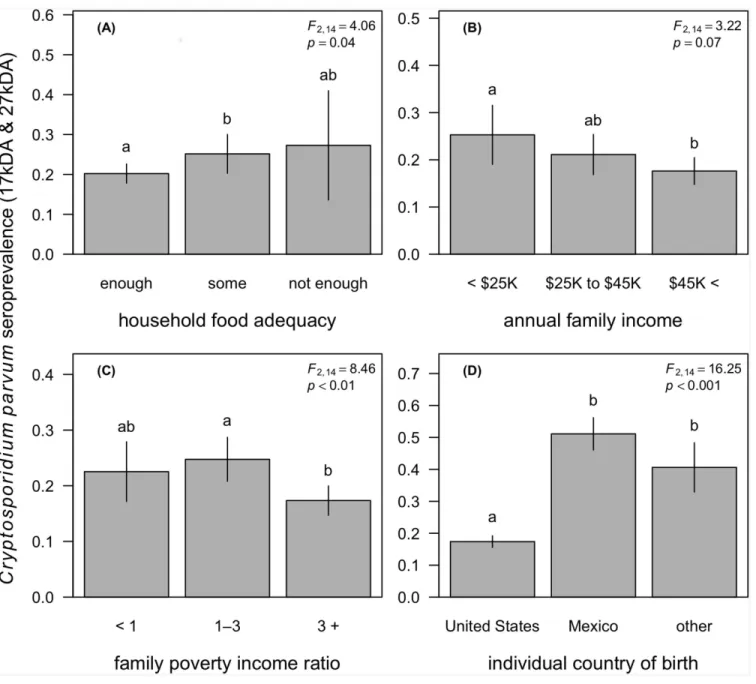
Our survey-weighted models showed that household socioeconomic conditions were signif-icant correlates ofCryptosporidiumseropositivity after adjusting for individual age, race and ethnicity, country of birth, education, gender, immunocompetence, and household size and water treatment status (Table 2). We first found that household food inadequacy was associ-ated with elevassoci-ated odds ofCryptosporidiumseropositivity (F2,14= 4.06,p= 0.04;Fig 1A). After
adjustment, the odds ofCryptosporidiumseropositivity were 1.4 times higher for persons in households with some food inadequacy (OR = 1.4,p= 0.04) compared to those in food-ade-quate households. This trend appeared to be as strong for persons living in households with high food inadequacy, but this elevated odds of seropositivity compared to persons living in food-adequate households was not significant (OR = 1.31,p= 0.65). Likewise, we observed a negative trend between household annual income andseropositivity, although the overall asso-ciation was not significant (F2,14= 3.22,p= 0.07;Fig 1B). Compared to individuals in homes
with an annual income of<$25,000 per annum, those in households with an income between
$25,000 and $45,000 appeared to have lower risk, although this effect was not significant (OR = 0.78,p= 0.21). Yet relative to the lowest income bracket, individuals in households earn-ing greater than $45,000 had 39% lower odds ofCryptosporidiumseropositivity (OR = 0.61, p= 0.03). After adjustment for confounders, the PIR was the strongest household socioeco-nomic correlate ofCryptosporidiumseropositivity and showed a non-linear relationship with seroprevalence (F2,14= 8.46,p<0.01). Relative to individuals in families living below the
pov-erty threshold, those in households with an income one-to-three times above the povpov-erty line had slightly elevated odds of seropositivity (OR = 1.26,p= 0.13), yet individuals in families with an income more than three times above than the poverty line had a suggested 25% reduc-tion in risk (OR = 0.75,p= 0.14); however, neither of these differences was statistically signifi-cant. When comparing individuals in families with an annual income one-to-three times above the poverty threshold to those in families earning greater than three times the poverty line, however, this increase in income was protective againstCryptosporidiumseropositivity (OR = 0.60,p<0.001;Fig 1C).
Our analyses also found individual demographics to be strong correlates ofCryptosporidium seropositivity. In our most conservative survey-weighted logistic model containing annual fam-ily income, we found that after adjustment for other covariates, risk of seropositivity increased by 6% per year increments in age (OR = 1.06,p<0.001) and was at least 1.76 times higher for
non-Hispanic blacks and Hispanics compared to non-Hispanic whites (F3,14= 11.89,
p<0.001;Table 2). The odds ofCryptosporidiumseropositivity were also at least 2.27 times
higher for persons born outside the United States (F2,14= 16.25,p<0.001;Fig 1D). After
adjusting for other covariates in this conservative model, we found no significant associations betweenCryptosporidiumseropositivity and household size, water treatment status, individual education, gender, or immunocompetence (Table 2).
Discussion
poverty and social marginalization [56,57]. However, regions of high socioeconomic status report greater risk in some high-income countries [15]. Such findings have perhaps prompted the claim that cryptosporidiosis is without significant links to social inequality in the United States and resulted in socioeconomic status being absent in discussions of risk factors for this infection [26–28]. Our results suggest that, contrary to these assertions, cryptosporidiosis risk Table 2. Risk factors forCryptosporidium parvumIgG seropositivity to the 17kDA and 27kDA antigens among persons aged 6–49 in the United
States, NHANES 1999–2000.
Crude Adjusted
Risk factors and confoundersa Odds ratio 95% CI pb Odds ratio 95% CI pb
Food adequacy 0.07 0.04
Enough Ref Ref Ref Ref Ref Ref
Some 1.32 1.04–1.69 0.04 1.40 1.08–1.83 0.04
Not enough 1.48 0.74–2.95 0.28 1.31 0.67–2.59 0.65
Annual family income 0.09 0.07
Less than $25,000 Ref Ref Ref Ref Ref Ref
$25,000 to $45,000 0.79 0.53–1.22 0.32 0.78 0.54–1.14 0.21
Greater than $45,000 0.63 0.49–0.95 0.04 0.61 0.41–0.90 0.03
Poverty income ratio 0.01 <0.01
PIR<1 Ref Ref Ref Ref Ref Ref
PIR 1–3 1.13 0.87–1.46 0.36 1.26 0.97–1.64 0.13
PIR 3+ 0.72 0.48–1.08 0.13 0.75 0.51–1.10 0.14
Age (years) 1.05 1.04–1.06 <0.001 1.06 1.05–1.07 <0.001
Race & ethnicity <0.001 <0.001
White Ref Ref Ref Ref Ref Ref
Black 2.01 1.64–2.46 <0.001 1.88 1.42–2.53 <0.001
Hispanic 2.68 2.27–3.16 <0.001 1.76 1.38–2.28 <0.001
Other 2.43 1.39–4.24 <0.01 2.13 1.10–4.07 0.04
Country of birth <0.001 <0.001
United States Ref Ref Ref Ref Ref Ref
Mexico 4.97 3.76–6.57 <0.001 2.96 1.99–4.25 <0.001
Other 3.25 2.33–4.54 <0.001 2.27 1.53–3.28 <0.001
Water treatment 0.04 0.12
Yes Ref Ref Ref Ref Ref Ref
No 1.31 1.03–1.66 0.04 1.19 0.97–1.45 0.13
Gender 0.16 0.17
Male Ref Ref Ref Ref Ref Ref
Female 1.20 0.94–1.52 0.16 1.22 0.94–1.59 0.17
Education 0.05 0.24
Less than high school Ref Ref Ref Ref Ref Ref
High school or greater 1.26 1.02–1.57 0.05 0.86 0.68–1.12 0.30
Household size 0.94 0.87–1.01 0.13 1.02 0.98–1.06 0.49
Lymphocyte count 0.94 0.82–1.07 0.37 1.01 0.91–1.17 0.85
aAdjusted odds ratios and con
fidence intervals are displayed from the multivariable survey-weighted logistic model including annual family income to have the most conservative estimates. Bold odds ratios and confidence intervals indicate significance atp0.05 after adjusting for multiple comparisons and confounding.
bThepvalues presented for each covariate were derived from a Satterthwaite-adjustedFstatistic via a Wald test and indicate an omnibus test for variable
significance.
in the United States is highest for individuals living in households with poor food adequacy; in families where income is low and close to the poverty threshold; and for older, non-white, and foreign-born persons.
First, we found food inadequacy was a strong household predictor of serological status, with persons in homes reporting some food inadequacy (enough to eat but not always of the foods desired) showing elevated odds ofCryptosporidiumseropositivity. This result was robust to adjustment for household size, water treatment, age, race and ethnicity, education, gender, country of origin, and immunocompetence, yet after adjustment there was also no greater risk Fig 1.Cryptosporidium parvumseroprevalence (IgG response to 17kDA and 27kDA antigens) as a function of household food adequacy (A), annual family income (B), the family poverty income ratio (C), and the individual country of birth (D).Segments denote 95% confidence intervals, and letters denote significant differences between groups after adjustment for confounding and multiple comparisons. Legends report the Satterthwaite-adjusted Fstatistic andp-value for the primary exposure variable after adjusting for confounding, as listed in the survey-weighted models provided inTable 2.
of seropositivity in homes with poor food adequacy compared to food-adequate households. As the direction of the food inadequacy effect suggested dose response, however, our finding of no difference in risk could be driven by the small sample size of food-inadequate households. More broadly, the significant association between food adequacy and cryptosporidiosis could suggest several pathways through which social inequality influencesCryptosporidiuminfection. Food inadequacy could first function as a proxy for household socioeconomic status, as food scarcity is typically driven by a broader lack of financial resources [41,42]. An effect of house-hold food inadequacy through this poverty pathway could suggest reduced access to educa-tional or sanitation resources that allow individuals to avoidCryptosporidiumtransmission pathways such as contaminated water or contact with livestock reservoir hosts. For example, low levels of education and access to the media were both associated with poor hand washing practices and hence greater parasite exposure risk in Kenya [58].
Our multivariable models containing either annual family income or the household PIR both are suggestive of this poverty pathway, as a high annual income and living far above the poverty threshold were both protective againstCryptosporidiumseropositivity. Yet a significant overall association between household financial resources and seroprevalence was only observed for the PIR, and for both variables we did not find a significant dose-response rela-tionship after adjustment. Specifically, our analysis showed no difference in the odds of Crypto-sporidiumseropositivity between individuals in households living below the poverty line and those in households at any degree above the poverty threshold. Instead, we only found a differ-ence in the odds of seropositivity between individuals in households close to the poverty threshold (1–3 times) and those in households with income greater than three times above the poverty line. These mixed findings for a direct effect of poverty on cryptosporidiosis could therefore suggest more immediate links between household food inadequacy and risk. Food inadequacy could first increase susceptibility to parasite infection through reductions to host nutritional status and therefore immunocompetence [59,60]. Food inadequacy could also push households towards accessing food products from avenues where food safety and sanitation may not be regulated, such as at open street markets [61].
This latter exposure-based pathway between household food inadequacy and cryptosporidi-osis risk seems particularly plausible, as small vegetable markets have been identified as a source ofCryptosporidiumin low-income regions [62]. Additionally, as the lymphocyte-based measure of immunocompetence had little effect on predicting seropositivity in univariate anal-yses and was incorporated into all multivariable models, the observed association in our multi-variable model between household food inadequacy and cryptosporidiosis could be driven more by food-borne exposure rather than health status. Because household water quality was also included in our multivariable model in the form of water treatment, this potential expo-sure-based effect of household food inadequacy onCryptosporidiumseropositivity could also be driven more by consumption of contaminated produce rather than contaminated water.
These results again highlight the potential links between social marginalization and Crypto-sporidiumseropositivity, as non-white, immigrant populations are more prone to experience unemployment, live in economically poor neighborhoods, and have reduced access to
resources [65,66]. Such groups may therefore be more likely to lack access to sanitation or edu-cational resources for avoiding parasite exposure and be prone to live in physically impaired or remote environments where access to clean food is limited or where contact with domestic ani-mals is frequent. For example, many low-income immigrants in the United States find their employment in agriculture [67,68], which likely amplifies exposure toCryptosporidiumoocysts through contact with soil and water contained with livestock excrement [69]. The recreational use of open natural water sources in such regions may also elevate the odds of parasite expo-sure. These results in turn suggest that public health interventions for cryptosporidiosis in the United States could focus on improving awareness ofCryptosporidiumexposure routes in such marginalized and resource-poor groups. Further research could also monitor the potential for water and food contamination in regions where high-risk groups reside and test if structural aspects of the physical environment amplifyCryptosporidiumseropositivity [21].
Future research on the social epidemiology of cryptosporidiosis in the United States could also utilize multilevel analyses to tease apart the relative contribution of individual and house-hold socioeconomic determinants of seropositivity while accounting for potential neighborhood effects [70,71]. Specifically, we did not find clear evidence of an overall dose–response relation-ship between individual seropositivity toCryptosporidiumand household financial resources (annual income or PIR), despite suggestive trends. Although this could be due to a small sample size for select groups of the study population, the structuring of NHANES could also have lim-ited identifying a strong income effect. Associated geographic data (e.g., zip codes, census block) for NHANES are supplied as restricted access, and thus we only included household and indi-vidual correlates in these analyses. Yet a stronger effect of income could manifest spatially at the neighborhood scale, where low income level could cluster food-inadequate households and the demographic groups found to be at risk in our multivariable models [72,73].
An additional needed area of work on the social epidemiology of cryptosporidiosis in the United States is the pursuit of longitudinal rather than cross-sectional approaches. Owing to the cross-sectional design of NHANES within the two-year study period tested forCryptosporidium seropositivity, we were unable to distinguish between IgG-positive individuals with Cryptospo-ridiuminfection and those that had only been recently infected and recovered. Longitudinal sampling across a socioeconomic gradient could help tease apart in which cases seropositivity is due to current or recent infections and how this varies by poverty and social marginalization, particularly if investigators measure IgM antibodies alongside IgG antibodies or changes in titers over time [74]. This could be particularly useful to account the positive association between age and seropositivity observed in this study and other analyses of NHANES [29], as IgG titers can increase with age owing to repeatedCryptosporidiuminfections. Together such studies would allow researchers to assess newCryptosporidiuminfections in relation to acute exposures and relate direct infection to impaired social and physical conditions.
UK found thatCryptosporidium hominiscases were more frequent in urban areas of high socioeconomic status, whereasCryptosporidium parvumcases (zoonotic genotype 2) were more common in rural areas where more oocysts were detected in agricultural soil, presumably from cattle [15].
Within the United States, genotyping methods could be particularly useful to elucidate how the individual- and household-scale correlates of poverty and social marginalization identified in our analyses interact with the abundance of livestock reservoir hosts and hence human infec-tion with zoonoticCryptosporidium parvum. Specifically, the density of livestock reservoir hosts such as cattle could be related to regional socioeconomic status [76,77], in turn driving greater exposure of marginalized groups toCryptosporidium parvumgenotype 2 in the United States. One analysis of sporadic cryptosporidiosis cases in Scotland accordingly found Crypto-sporidiumprevalence to be highest in rural regions with high livestock density [78], suggesting a neighborhood poverty influence on seropositivity. Hence ecological and multilevel analyses could test for an interactive influence of livestock density and social marginalization variables identified here (e.g., food adequacy, immigration status, race and ethnicity) on cryptosporidio-sis while accounting for neighborhood income.
Our analyses here demonstrate clear associations between social marginalization, poverty, and cryptosporidiosis in the United States, thereby carrying important implications for tar-geted public health interventions for this infection in resource-poor groups. Alongside direct effects ofCryptosporidiuminfection on mortality in immunocompromised individuals, mor-bidity from cryptosporidiosis can range from subtle to severe effects quality of life that can impose serious restrictions on economic wellbeing [3,4]. As cryptosporidiosis is estimated to occur in 750000 persons across the United States annually, these effects can scale up to over $100 million per year in healthcare costs and losses to productivity [2,5]. Therefore, under-standing interactions between socioeconomic and environmental conditions in combination with longitudinal and genotyping approaches will be key to guiding prevention and interven-tion strategies to cryptosporidiosis within the United States. Analyses in this spirit will more broadly help address the complex relationships between ecological factors, social inequality, and infectious disease risk [79,80].
Supporting Information
S1 Checklist. STROBE Checklist. (DOC)S1 Table. Association between household socioeconomic variables. (DOCX)
S2 Table. Interactions between age and household socioeconomic status. (DOCX)
S1 Fig. Visualization of age-stratifying the relationship between household socioeconomic variables and age definitions.
(DOCX)
Acknowledgments
Author Contributions
Conceived and designed the experiments: DJB JO AEE. Performed the experiments: DJB. Ana-lyzed the data: DJB. Contributed reagents/materials/analysis tools: DJB JO AEE. Wrote the paper: DJB JO AEE.
References
1. Dillingham RA, Lima AA, Guerrant RL. Cryptosporidiosis: epidemiology and impact. Microbes Infect. 2002; 4: 1059–1066. doi:10.1016/S1286-4579(02)01630-1PMID:12191656
2. Scallan E, Hoekstra RM, Angulo FJ, Tauxe RV, Widdowson M-A, Roy SL, et al. Foodborne Illness Acquired in the United States—Major Pathogens. Emerg Infect Dis. 2011; 17: 7–15. doi:10.3201/ eid1701.091101p1PMID:21192848
3. Corso PS, Kramer MH, Blair KA, Addiss DG, Davis JP, Haddix AC. Costs of Illness in the 1993 Water-borne Cryptosporidium Outbreak, Milwaukee, Wisconsin. Emerg Infect Dis. 2003; 9: 426–431. doi:10. 3201/eid0904.020417PMID:12702221
4. Mac Kenzie WR, Hoxie NJ, Proctor ME, Gradus MS, Blair KA, Peterson DE, et al. A massive outbreak in Milwaukee of cryptosporidium infection transmitted through the public water supply. N Engl J Med. 1994; 331: 161–167. doi:10.1056/NEJM199407213310304PMID:7818640
5. Scharff RL. Economic Burden from Health Losses Due to Foodborne Illness in the United States. J Food Prot. 2012; 75: 123–131. doi:10.4315/0362-028X.JFP-11-058PMID:22221364
6. Leav BA, Mackay M, Ward HD, Acheson D. Cryptosporidium Species: New Insights and Old Chal-lenges. Clin Infect Dis. 2003; 36: 903–908. doi:10.1086/368194PMID:12652391
7. Widmer G, Lin L, Kapur V, Feng X, Abrahamsen MS. Genomics and genetics of Cryptosporidium par-vum: the key to understanding cryptosporidiosis. Microbes Infect Inst Pasteur. 2002; 4: 1081–1090. 8. Ramirez NE, Ward LA, Sreevatsan S. A review of the biology and epidemiology of cryptosporidiosis in
humans and animals. Microbes Infect. 2004; 6: 773–785. doi:10.1016/j.micinf.2004.02.021PMID: 15207825
9. Slifko TR, Smith HV, Rose JB. Emerging parasite zoonoses associated with water and food. Int J Para-sitol. 2000; 30: 1379–1393. doi:10.1016/S0020-7519(00)00128-4PMID:11113263
10. Morgan-Ryan UM, Fall A, Ward LA, Hijjawi N, Sulaiman I, Fayer R, et al. Cryptosporidium hominis n. sp.(Apicomplexa: Cryptosporidiidae) from Homo sapiens. J Eukaryot Microbiol. 2001; 49: 433–440. 11. Graczyk TK, Fayer R, Cranfield MR. Zoonotic transmission of Cryptosporidium parvum: Implications for
water-borne cryptosporidiosis. Parasitol Today. 1997; 13: 348–351. doi:10.1016/S0169-4758(97) 01076-4PMID:15275048
12. McLauchlin J, Amar C, Pedraza-Diaz S, Nichols GL. Molecular Epidemiological Analysis of Cryptospor-idiumspp. in the United Kingdom: Results of GenotypingCryptosporidium spp. in 1,705 Fecal Samples from Humans and 105 Fecal Samples from Livestock Animals. J Clin Microbiol. 2000; 38: 3984–3990. PMID:11060056
13. Peng MM, Xiao L, Freeman AR, Arrowood MJ, Escalante AA, Weltman AC, et al. Genetic polymor-phism among Cryptosporidium parvum isolates: evidence of two distinct human transmission cycles. Emerg Infect Dis. 1997; 3: 567–573. PMID:9366611
14. Thompson RCA, Palmer CS, O’Handley R. The public health and clinical significance of Giardia and Cryptosporidium in domestic animals. Vet J. 2008; 177: 18–25. doi:10.1016/j.tvjl.2007.09.022PMID: 18032076
15. Lake IR, Harrison FCD, Chalmers RM, Bentham G, Nichols G, Hunter PR, et al. Case-control study of environmental and social factors influencing cryptosporidiosis. Eur J Epidemiol. 2007; 22: 805–811. doi:10.1007/s10654-007-9179-1PMID:17891460
16. Blackburn BG, Mazurek JM, Hlavsa M, Park J, Tillapaw M, Parrish M, et al. Cryptosporidiosis Associ-ated with OzonAssoci-ated Apple Cider. Emerg Infect Dis. 2006; 12: 684–686. doi:10.3201/eid1204.050796 PMID:16704822
17. Glaberman S, Moore JE, Lowery CJ, Chalmers RM, Sulaiman I, Elwin K, et al. Three Drinking-Water–
Associated Cryptosporidiosis Outbreaks, Northern Ireland. Emerg Infect Dis. 2002; 8: 631–633. doi: 10.3201/eid0806.010368PMID:12023922
18. Hunter PR, Hughes S, Woodhouse S, Syed Q, Verlander NQ, Chalmers RM, et al. Sporadic Cryptospo-ridiosis Case-Control Study with Genotyping. Emerg Infect Dis. 2004; 10: 1241–1249. doi:10.3201/ eid1007.030582PMID:15324544
Minnesota, 2003. Epidemiol Infect. 2006; 134: 878–886. doi:10.1017/S0950268805005649PMID: 16672084
20. Savioli L, Smith H, Thompson A. Giardia and Cryptosporidium join the“Neglected Diseases Initiative.”
Trends Parasitol. 2006; 22: 203–208. doi:10.1016/j.pt.2006.02.015PMID:16545611
21. Chacín-Bonilla L, Barrios F, Sanchez Y. Environmental risk factors for Cryptosporidium infection in an island from Western Venezuela. Mem Inst Oswaldo Cruz. 2008; 103: 45–49. doi: 10.1590/S0074-02762008005000007PMID:18345459
22. Newman RD, Wuhib T, Lima AA, Guerrant RL, Sears CL. Environmental sources of Cryptosporidium in an urban slum in northeastern Brazil. Am J Trop Med Hyg. 1993; 49: 270–275. PMID:8357090 23. Tarlov A. Social determinants of health: the sociobiological translation. Health Soc Organ Lond
Rout-ledge. 1996; 71–93.
24. Kimani VN, Mitoko G, McDermott B, Grace D, Ambia J, Kiragu MW, et al. Social and gender determi-nants of risk of cryptosporidiosis, an emerging zoonosis, in Dagoretti, Nairobi, Kenya. Trop Anim Health Prod. 2012; 44: 17–23. doi:10.1007/s11250-012-0203-4PMID:22865349
25. Kawachi I, Kennedy BP. Income inequality and health: pathways and mechanisms. Health Serv Res. 1999; 34: 215. PMID:10199670
26. Hotez PJ. Neglected Infections of Poverty in the United States of America. PLoS Negl Trop Dis. 2008; 2: e256. doi:10.1371/journal.pntd.0000256PMID:18575621
27. Hotez PJ. Neglected Parasitic Infections and Poverty in the United States. PLoS Negl Trop Dis. 2014; 8: e3012. doi:10.1371/journal.pntd.0003012PMID:25188455
28. Yoder JS, Beach MJ. Cryptosporidium surveillance and risk factors in the United States. Exp Parasitol. 2010; 124: 31–39. doi:10.1016/j.exppara.2009.09.020PMID:19786022
29. Frost FJ, Muller TB, Calderon RL, Craun GF. Analysis of serological responses to cryptosporidium anti-gen among NHANES III participants. Ann Epidemiol. 2004; 14: 473–478. doi:10.1016/j.annepidem. 2003.06.002PMID:15310525
30. Peeters JE, Villacorta I, Vanopdenbosch E, Vandergheynst D, Naciri M, Ares-Mazás E, et al. Crypto-sporidium parvum in calves: kinetics and immunoblot analysis of specific serum and local antibody responses (immunoglobulin A [IgA], IgG, and IgM) after natural and experimental infections. Infect Immun. 1992; 60: 2309–2316. PMID:1587597
31. Petry F, Jakobi V, Tessema TS. Host immune response to Cryptosporidium parvum infection. Exp Parasitol. 2010; 126: 304–309. doi:10.1016/j.exppara.2010.05.022PMID:20685209
32. Priest JW, Kwon JP, Moss DM, Roberts JM, Arrowood MJ, Dworkin MS, et al. Detection by Enzyme Immunoassay of Serum Immunoglobulin G Antibodies That Recognize SpecificCryptosporidium par-vum Antigens. J Clin Microbiol. 1999; 37: 1385–1392. PMID:10203492
33. Priest JW, Kwon JP, Arrowood MJ, Lammie PJ. Cloning of the immunodominant 17-kDa antigen from Cryptosporidium parvum. Mol Biochem Parasitol. 2000; 106: 261–271. PMID:10699255
34. Moss DM, Chappell CL, Okhuysen PC, DuPont HL, Arrowood MJ, Hightower AW, et al. The antibody response to 27-, 17-, and 15-kDa Cryptosporidium antigens following experimental infection in humans. J Infect Dis. 1998; 178: 827–833. PMID:9728553
35. Muller TB, Frost FJ, Craun GF, Calderon RL. Serological responses to Cryptosporidium infection. Infect Immun. 2001; 69: 1974–1975. PMID:11253773
36. Priest JW, Li A, Khan M, Arrowood MJ, Lammie PJ, Ong CS, et al. Enzyme immunoassay detection of antigen-specific immunoglobulin G antibodies in longitudinal serum samples from patients with crypto-sporidiosis. Clin Diagn Lab Immunol. 2001; 8: 415–423. PMID:11238231
37. Reperant J-M, Naciri M, Chardes T, Bout DT. Immunological characterization of a 17-kDa antigen from Cryptosporidium parvum recognized early by mucosal IgA antibodies. FEMS Microbiol Lett. 1992; 99: 7–14.
38. McDonald AC, Kenzie WRM, Addiss DG, Gradus MS, Linke G, Zembrowski E, et al. Cryptosporidium parvum–Specific Antibody Responses among Children Residing in Milwaukee during the 1993 Water-borne Outbreak. J Infect Dis. 2001; 183: 1373–1379. doi:10.1086/319862PMID:11294669
39. Frost FJ, Muller T, Craun GF, Fraser D, Thompson D, Notenboom R, et al. Serological analysis of a cryptosporidiosis epidemic. Int J Epidemiol. 2000; 29: 376–379. doi:10.1093/ije/29.2.376PMID: 10817139
41. Hatløy A, Hallund J, Diarra MM, Oshaug A. Food variety, socioeconomic status and nutritional status in
urban and rural areas in Koutiala (Mali). Public Health Nutr. 2000; 3: 57–65. doi:10.1017/ S1368980000000628PMID:10786724
42. Seligman HK, Bindman AB, Vittinghoff E, Kanaya AM, Kushel MB. Food Insecurity is Associated with Diabetes Mellitus: Results from the National Health Examination and Nutrition Examination Survey (NHANES) 1999–2002. J Gen Intern Med. 2007; 22: 1018–1023. doi:10.1007/s11606-007-0192-6 PMID:17436030
43. Hunter PR, Nichols G. Epidemiology and Clinical Features of Cryptosporidium Infection in Immunocom-promised Patients. Clin Microbiol Rev. 2002; 15: 145–154. doi:10.1128/CMR.15.1.145-154.2002 PMID:11781272
44. Chen W, Harp JA, Harmsen AG. Requirements for CD4+ cells and gamma interferon in resolution of established Cryptosporidium parvum infection in mice. Infect Immun. 1993; 61: 3928–3932. PMID: 8103040
45. Lumley T. Analysis of complex survey samples. J Stat Softw. 2004; 9: 1–19.
46. R Core Team. R: A language and environment for statistical computing [Internet]. R Foundation for Sta-tistical Computing. Vienna, Austria.; 2013. Available:http://www.R-project.org
47. Johnson CL, Paulose-Ram R, Ogden CL, Carroll MD, Kruszon-Moran D, Dohrmann SM, et al. National health and nutrition examination survey: analytic guidelines, 1999–2010. Vital Health Stat 2. 2013; 1–
24.
48. Horvitz DG, Thompson DJ. A generalization of sampling without replacement from a finite universe. J Am Stat Assoc. 1952; 47: 663–685.
49. Lumley T. Complex surveys: a guide to analysis using R. John Wiley & Sons; 2011.
50. Korn EL, Graubard BI. Analysis of Large Health Surveys: Accounting for the Sampling Design. J R Stat Soc Ser A Stat Soc. 1995; 158: 263–295.
51. Koch GG, Freeman DH Jr, Freeman JL. Strategies in the multivariate analysis of data from complex surveys. Int Stat Rev Int Stat. 1975; 59–78.
52. Thomas DR, Rao JNK. Small-sample comparisons of level and power for simple goodness-of-fit statis-tics under cluster sampling. J Am Stat Assoc. 1987; 82: 630–636.
53. Korn EL, Graubard BI. Analysis of health surveys. John Wiley & Sons; 2011.
54. Benjamini Y, Hochberg Y. Controlling the false discovery rate: a practical and powerful approach to multiple testing. J R Stat Soc Ser B Methodol. 1995; 289–300.
55. Bretz F, Hothorn T, Westfall P. Multiple comparisons using R. CRC Press; 2010.
56. Guerrant DI, Moore SR, Lima AA, Patrick PD, Schorling JB, Guerrant RL. Association of early child-hood diarrhea and cryptosporidiosis with impaired physical fitness and cognitive function four-seven years later in a poor urban community in northeast Brazil. Am J Trop Med Hyg. 1999; 61: 707–713. PMID:10586898
57. Kaler SG. Diseases of Poverty with High Mortality in Infants and Children. Ann N Y Acad Sci. 2008; 1136: 28–31. doi:10.1196/annals.1425.035PMID:18579873
58. Schmidt W-P, Aunger R, Coombes Y, Maina PM, Matiko CN, Biran A, et al. Determinants of handwash-ing practices in Kenya: the role of media exposure, poverty and infrastructure. Trop Med Int Health. 2009; 14: 1534–1541. doi:10.1111/j.1365-3156.2009.02404.xPMID:19793069
59. Katona P, Katona-Apte J. The Interaction between Nutrition and Infection. Clin Infect Dis. 2008; 46: 1582–1588. doi:10.1086/587658PMID:18419494
60. Weigel MM, Armijos RX, Hall YP, Ramirez Y, Orozco R. The Household Food Insecurity and Health Outcomes of U.S.–Mexico Border Migrant and Seasonal Farmworkers. J Immigr Minor Health. 2007; 9: 157–169. doi:10.1007/s10903-006-9026-6PMID:17245658
61. Quandt SA, Arcury TA, Early J, Tapia J, Davis JD. Household food security among migrant and sea-sonal latino farmworkers in North Carolina. Public Health Rep. 2004; 119: 568–576. doi:10.1016/j.phr. 2004.09.006PMID:15504448
62. Yr O, Cr R, Rh G, Nj M, L C, C T, et al. Isolation of Cryptosporidium parvum and Cyclospora cayetanen-sis from vegetables collected in markets of an endemic region in Peru. Am J Trop Med Hyg. 1997; 57: 683–686. PMID:9430527
63. Leach CT, Koo FC, Kuhls TL, Hilsenbeck SG, Jenson HB. Prevalence of Cryptosporidium parvum infection in children along the Texas-Mexico border and associated risk factors. Am J Trop Med Hyg. 2000; 62: 656–661. PMID:11289680
64. Sorvillo FJ, Lieb LE, Kerndt PR, Ash LR. Epidemiology of cryptosporidiosis among persons with acquired immunodeficiency syndrome in Los Angeles County. Am J Trop Med Hyg. 1994; 51: 326–
65. De Jong GF, Madamba AB. A Double Disadvantage? Minority Group, Immigrant Status, and Underem-ployment in the United States. Soc Sci Q. 2001; 82: 117–130. doi:10.1111/0038-4941.00011
66. Williams DR, Collins C. Racial residential segregation: a fundamental cause of racial disparities in health. Public Health Rep. 2001; 116: 404–416. PMID:12042604
67. Farmer FL, Slesinger DP. Health status and needs of migrant farm workers in the United States: a litera-ture review. J Rural Health. 1992; 8: 227–234. PMID:10121552
68. Villarejo D. The Health of U.S. Hired Farm Workers. Annu Rev Public Health. 2003; 24: 175–193. doi: 10.1146/annurev.publhealth.24.100901.140901PMID:12359914
69. Olson ME, Goh J, Phillips M, Guselle N, McAllister TA. Giardia Cyst and Cryptosporidium Oocyst Sur-vival in Water, Soil, and Cattle Feces. J Environ Qual. 1999; 28: 1991. doi:10.2134/jeq1999. 00472425002800060040x
70. Diez-Roux AV. Bringing context back into epidemiology: variables and fallacies in multilevel analysis. Am J Public Health. 1998; 88: 216–222. doi:10.2105/AJPH.88.2.216PMID:9491010
71. Merlo J, Chaix B, Yang M, Lynch J, Råstam L. A brief conceptual tutorial of multilevel analysis in social epidemiology: linking the statistical concept of clustering to the idea of contextual phenomenon. J Epi-demiol Community Health. 2005; 59: 443–449. doi:10.1136/jech.2004.023473PMID:15911637 72. Lochner KA, Kawachi I, Brennan RT, Buka SL. Social capital and neighborhood mortality rates in
Chi-cago. Soc Sci Med. 2003; 56: 1797–1805. doi:10.1016/S0277-9536(02)00177-6PMID:12639596 73. O’Campo P. Invited Commentary: Advancing Theory and Methods for Multilevel Models of Residential
Neighborhoods and Health. Am J Epidemiol. 2003; 157: 9–13. doi:10.1093/aje/kwf171PMID: 12505885
74. Priest JW, Bern C, Roberts JM, Kwon JP, Lescano AG, Checkley W, et al. Changes in Serum Immuno-globulin G Levels as a Marker for Cryptosporidium sp. Infection in Peruvian Children. J Clin Microbiol. 2005; 43: 5298–5300. doi:10.1128/JCM.43.10.5298-5300.2005PMID:16208002
75. Xiao L, Bern C, Limor J, Sulaiman I, Roberts J, Checkley W, et al. Identification of 5 Types of Crypto-sporidium Parasites in Children in Lima, Peru. J Infect Dis. 2001; 183: 492–497. doi:10.1086/318090 PMID:11133382
76. Kristjanson P, Krishna A, Radeny M, Kuan J, Quilca G, Sanchez-Urrelo A, et al. Poverty dynamics and the role of livestock in the Peruvian Andes. Agric Syst. 2007; 94: 294–308. doi:10.1016/j.agsy.2006. 09.009
77. Robinson TP, Wint GRW, Conchedda G, Van Boeckel TP, Ercoli V, Palamara E, et al. Mapping the Global Distribution of Livestock. PLoS ONE. 2014; 9: e96084. doi:10.1371/journal.pone.0096084 PMID:24875496
78. Pollock KGJ, Ternent HE, Mellor DJ, Chalmers RM, Smith HV, Ramsay CN, et al. Spatial and Temporal Epidemiology of Sporadic Human Cryptosporidiosis in Scotland. Zoonoses Public Health. 2010; 57: 487–492. doi:10.1111/j.1863-2378.2009.01247.xPMID:19638164
79. Farmer P. Social inequalities and emerging infectious diseases. Emerg Infect Dis. 1996; 2: 259. PMID: 8969243