1
Direct Research Work Project, presented as part of the requirements for the Award of a Masters Degree in Management from NOVA – School of Business and Economics.
The development of entrepreneurial ecosystems: The case of the Portuguese Regulatory Framework
Henrique Guimarães Romão | 3514
A Project carried out on the Master in Management program, under the supervision of:
Professor Ilya Okhmatovskiy
2
The development of entrepreneurial ecosystems: The case of the Portuguese Regulatory Framework
Abstract
In line with global political trends aimed at fostering job creation and economic growth through increased entrepreneurship, Portugal has committed to invest in ‘embellishing’ its entrepreneurial ecosystem. During the period of 2006-2016, policy reforms were implemented, with the objective of alleviating the regulatory rigidity entrepreneurs are subject to. Following the OECD-Eurostat methodology, together with a cross-comparison with the Netherlands, this paper estimates the effectiveness and impact of these reforms in easing such rigidity. This estimation found that Portuguese investment paid-off in some areas such as Administrative Burdens (entry and growth) while in others (e.g. Labour Market Regulations), it did not.
3
“Entrepreneurs are simply those who understand that there is little difference between obstacle and opportunity and are able to turn both to their advantage”
Niccolo Machiavelli, 1469-1527
1. Motivation and Introduction
In the aftermath of the 2008/09 economic crisis, many of the world countries suffered an economic contraction, with decreasing levels of firm creation and increasing ones of youth unemployment. During this period, the rationale that entrepreneurial ventures (high-growth firms) drive productivity growth, employment, innovation and internationalization1 developed and became the subject of policy makers focus, who sought to improve their countries’ economic outlook by reforming their entrepreneurial ecosystems. The overall objective of these reforms was to embellish the ecosystem’s environment to motivate and attract venture creation, of both national and foreign origins. Portugal, among the most crisis-affected European countries, was no exception to these global trends and in 2011 publicly requested external financial help and in turn agreed to implement specific policies to achieve certain economic goals. Among its objectives, structural reforms targeted areas such as Labour Market and Framework Conditions. Overall, the regulatory ease in 2015/16 versus that of 2006 was found to have been achieved through the successful reforms in Administrative Burdens (entry and growth) and Capital/Business Taxes and injured by some unsuccessful ones in Court and Legal Framework and Labour Market.
Although, Portugal has started to demonstrate its ability and further potential to harbour and nurture start-ups, on the European entrepreneurial landscape, with Lisbon as the nation’s poster-child for start-up hub cities, Europe, and thus Portugal by comparison, still fall short to its major competitors (North America and Asia) regarding their current level of entrepreneurship and innovation. For their ecosystems to further develop and grow, there is a need to identify and
1 OECD, 2013; Brown et al. 2014, in Mason and Brown, 2014. Entrepreneurial Ecosystems and Gowth Oriented
4
understand the factors that have thus far attracted and/or deterred national and foreign entrepreneurs in choosing Portugal. This is the first step to strategizing the fostering of entrepreneurial activities, allowing the country to “successfully communicate the value of the Portuguese start up ecosystem and define a truly competitive strategy to support its growth” (Portuguese Startup Manifesto) by targeting areas in need of interference. It is not only the partial identification of these factors, but also the impact and effectiveness of implemented policy reforms (throughout 2006 and 2016) in improving them, that this paper aims to estimate. Was Portugal successful in reforming its Regulatory Framework? Where did this success/failure come from? Why? Which policy areas need more focus and investment? These are examples of questions we aim to answer.
Furthermore, this work intends to contribute to the assessment and /or monitoring of the policy impact in other areas, as the methodology may be further used, with the necessary adaption for the area of analysis. Also, the lack of studies, practically using the OECD methodology for country analysis, also motivated its choice for implementation in this paper.
The body of the paper consists in the Literature Review present in Section 2. Section 3 shows a description of the recent European and Portuguese entrepreneurial contexts and efforts in driving up entrepreneurship. The methodology and variables used are presented in Section 4 and 5, respectively. Finally, from Section 6 onwards the results are presented and discussed.
2. Literature Review
The degree of easiness with which companies must deal with a country’s regulation, is among the most relevant aspects of an entrepreneurial ecosystem2. According to the literature on the subject, the lighter the burden of regulatory requirements of an ecosystem is, the more attractive
2interconnected entrepreneurial actors, organisations, institutions and processes, which (in)formally coalesce to
5
it will be for potential entrepreneurs (national or foreign), to found their ventures in such ecosystem – other dimensions held constant. On the other hand, harder regulatory burdens, represent higher entry barriers for newcomers (through increased fixed costs), which translates to less competition (since incumbents are protected by burdensome entry requirements), restrictions on innovation, lower rates of enterprise births and ultimately less job prospects. A especially important implication for regions where small and medium enterprises (SME) account for an average of 2 out of 3 jobs, such as in the EU, or 4 out 5 jobs, as in Portugal.3
Nonetheless, the regulatory framework alone does not dictate whether entrepreneurs choose a location over another. There are other factors that impact entrepreneur’s preference, such as an entrepreneurial ecosystem’s access to capital and/or technology, local market conditions or its society’s entrepreneurial culture and capabilities. For example, even in an ecosystem with above average regulatory rigidity, entrepreneurs may still prefer to operate there, due to its high-quality-low-cost labour, easy capital access and pro-entrepreneurial culture and institutions.
Regardless, recent empirical literature has suggested validation of these theoretical implications, connecting the reduction of regulatory burdens with firm entry and job creation4.
According to Branstetter (2010), artificial entry costs deter entrepreneurship and a substantial relaxation of entry regulation burdens or costs drives firm entry and job creation.
Despite this, measuring policy impact or effectiveness presents formidable challenges and every endeavour comes with its ‘red flags’. In principle, the go-to method for measuring such impact is to evaluate the state of the economy before and after the implementation of policy reforms. However, the likely assumption that hidden factors also drive the value changes in the indicators reflecting economic outcomes, difficults causal inference. For instances, a decrease in youth unemployment may be due to an increase in job creation, ageing of the population or
3 SBA Fact Sheet Portugal, European Commission, 2016 4 Ciccone et al. 2007 and Klapper et al. 2006
6
even emigration of the young demographic segment. An alternative is to track and assess, the indicator values upon which the policy’s objective intends to impact, before and after its implementation. Yet, some indicators are not totally accurate due to their method of collection and others are to some extent mere proxies of what they measure. The business ownership rate of the population measuring the number of entrepreneurs in a country, is also accounting for self-proprietors of small scale operations with reduced growth potential and economic significance, which do not fit the concept of entrepreneurship (innovative and high-growth).
In this paper, the estimation of regulatory policy reform impact rests on high-quality, fact-based, reliable indicators. Whilst indicator values are trackable and easily observable, the challenge lies on their relevance, as seen in the aforementioned caveat. Regardless, efforts have been made to overcome such measurement challenge.
One of the most common empirical approaches to the estimation of regulatory policy reform impact, seen throughout many research work, is to use cross-country comparison regarding regulatory rigidity and relaxation and check whether or not variations are correlated with some measures of economic performance as suggested in Djankov et al. 2002. A significant downside to this approach is the endogeneity, and collinearity issues surrounding standard statistical tools/models. Which in turn, make correlation alone insufficient to empirically evaluate the plausible consequence of regulatory policy reform.
Despite useful, these approaches do not replace empirical assessment of actual reforms’ impact, either because the policy change is too complex to examine through such simplistic methods or because the data used for assessment usually captures more than what it is intended to measure. Acknowledging these challenges, the research and meetings carried out by the OECD’s Entrepreneurship Indicator Programme, EUROSTAT and the US Key Indicator Project5 during
5 OECD, 2003; Wallman et al., 2004; Munoz, 2004 in: Hoffman, A. et al., 2007, “A Framework for Addressing and
7
2005/06, resulted in the establishment of an indicator quality assessment framework. This framework allows analysts to filter high quality indicators by evaluating them across three dimensions (i) relevance, assesses whether the indicator closely measures what the framework condition is supposed to measure and if policy initiatives have a direct or indirect impact on the indicator; (ii) accuracy, tests for the data collection method of indicator values, whether it is based on observable/quantifiable facts (fact-based, e.g. tax rate), based on observable and quantifiable actions (action-based, e.g. implementation of processes) or based on subjective evaluation (opinion-based, e.g. surveys). Accuracy is also tested on consistency of countries’ collection method and indicators’ (iii) availability, assessed, across countries and over time. Afterwards, an overall grade is given to each indicator, A for the top-tier good quality, B for the middle acceptable quality and C for the lower one of more questionable quality.
Overcoming such barriers, the methodology used in this paper is based on that of OECD-Eurostat Entrepreneurship Indicators Programme (2007) and uses their yearly updated suggestions for databases. The time period considered in this paper required data to be collected from 2006 to 2016. It is crucial to mention that, only indicators of the highest-quality were used to measure the impact of regulatory policy reform, only policy reforms with direct impact on indicator values were analysed and policy shift (in)effectiveness is measured by the (un)successful relaxation of regulatory burdens reflected in the indicator value changes.
3. Current European and Portuguese Entrepreneurial Situation 3.1 The European Entrepreneurship Situation/Context/Stance
With scattered levels of entrepreneurial activity, innovation capabilities, regulatory rigidity, network access, high quality talent and overall competitiveness, Europe still presents barriers to entrepreneurship in need of reform. Lagging behind the global pace of new venture creation, Europe presents an average rate of Total early-stage entrepreneurial activity (TEA) of only 8.4% of the adult population, the lowest among the five world regions. With high divergence
8
in TEA levels among member-countries and discrepancies in the level of innovation capabilities between Northern and the remaining Europe supporting the evidence of the ‘European divide’.6
Nonetheless progress is being made through both top-down (i.e. Public actors) and bottom-up (i.e. Private actors) initiatives and practices, aimed at fostering entrepreneurial culture and improving the ecosystem for such culture to thrive in. Since the Lisbon European Council in 2000 greater efforts have been made by European policy makers and private agents to promote entrepreneurial activity throughout the continent, with government and private sponsored programs and policies aimed at guiding and facilitating entrepreneurs through the startup development and growth processes. Some prime examples would be the European Commission’s Digital Market Strategy or the Competitiveness and Innovation Framework Programme (CIP) aimed at easing start-up, growth and scale-up processes of entrepreneurial ventures across borders, by supporting innovation and technological development, offering business support services, providing better access to capital, facilitating connection between start-ups, networks, ecosystems and their investors and partners.
Regarding policy intervention we can witness efforts to integrate entrepreneurship in the education system or to reduce tax burdens for new ventures, reducing the cost for entrepreneurs. For instances, the European Commission’s Entrepreneurship 2020 Action Plan or the Small Business Act comes to mind, which aim to “improve the approach to entrepreneurship in Europe, simplify the regulatory and policy environment for SMEs, and remove the remaining barriers to their development.” (European Commission, 2012).
As for private actors, bottom-up networks (e.g. international conferences and summits) have been established to gather entrepreneurs and talent, where some go on to engage in policy making, (e.g. Pioneers Annual Conference). Platforms for capital access have also been
9
developed (e.g. European Business Angel Week), co-investment funds set up between Business Angels and public actors (e.g. European Angels Fund) and a growing number of crowd-funding platforms are emerging (WEF, 2014). Furthermore, a mix of public and private actors have also come together in contributing to the fostering of entrepreneurship through activities such as the Global Entrepreneurship Week, European Young Innovator Forum or Start-up Europe aimed at developing, accelerating and connecting local entrepreneurship ecosystems, their networks and entrepreneurial cultures. Lastly, the increase in the number of European incubators and accelerators, of around 400% between 2007 and 2013 (Salido, E. et al., 2013)7, is also evidence that the efforts to drive up the entrepreneurial culture in Europe are paying off.
3.2 The Portuguese Entrepreneurship Situation/Context/Stance
According to a European Commission report8 (2012) in Portugal, 51% of the population would
rather be self-employed (decreasing 20% since 2002), which is most likely reflecting the economic recession Portugal was in at the time. The stability of income and employment were pointed as the main reasons for such decrease in numbers, reflecting a more risk-averse population. Nonetheless, with a slightly lower rate of TEA than the European average (8.4%)9, the Portuguese (8.2%), over the years, have become more involved in entrepreneurial activity (Table 1), mainly as a population’s response to high unemployment rates, seeing entrepreneurship as the go to solution, with 68.8%3 of the population perceiving it as a good carrier choice. Nonetheless, only 20.8% of TEA of the Portuguese adult population has started the business out of necessity, compared to 77.7% that have started it out of an opportunity.
Table 1 – Employer Enterprise Birth Rate and TEA, Portugal
7 Salido, E., Sabás, M. and Freixas, P. (2013) “The Accelerator and incubator Ecosystem in Europe”, Telefonica 8 Flash Eurobarometer 354: Entrepreneurship in the Eu and beyond (2012), European Commission, Report 9 Global entrepreneurship Monitor, Global Report 2016
Indicators/ Year 2010 2011 2012 2013 2014 2015 2016
Employer enterprise birth rate (%) 11,87 12,57 12,48 14,52 14,75 15,91 NA
Total Early-Stage Entrepreneurial
Activity (TEA) - percentage (%) 4,50 7,60 7,70 8,30 10,00 9,50 8,20
10
Meanwhile, the 2008 recession period is still being felt in the economy, with small-and-medium enterprises’ employment and value-added still below pre-crisis levels. During the recession period, the number of active Portuguese firms and enterprise births decreased dramatically and as of 2015 values haven’t recovered to pre-crisis levels (FIG. 1). Still, the improvement is noticeable, with contributions from actors across the country’s different sectors. In this context, regulatory rigidity at firm entry can be of paramount importance, if we consider the relaxation of such rigidity as a positive driver of new firm creation.
Accordingly, the government and private actors have become focused on entrepreneurship and creating a more attractive ecosystem. Following the European 2020 Action Plan, the Portuguese government has put forth some measures to facilitate and drive up entrepreneurial activity in the national territory under the Portugal 2020 program. Some of these measures include providing financial and knowledgeable support in entrepreneurial projects and even fiscal incentives such as SIFIDE II, which supports R&D aimed at product, process, program or equipment innovation, by relieving tax burdens of R&D costs. Furthermore, a government-sponsored initiative was launched in 2016, StartUp Portugal, the administration’s strategy for fostering the Portuguese entrepreneurial ecosystem. Some of its measures are the Startup Momentum and the Startup Voucher, which are basically subsidies provided to recent graduate students, for the development of their business ideas. The most recent one, is the Startup Visa launched at this year’s Web Summit, aimed at attracting (by facilitating) foreign venture creation or relocation to Portuguese territory, with a quick access to a visa for entrepreneurs
11
with innovative ventures. Other measures, include promoting equity crowd-funding and “peer-to-peer” lending, supporting co-investment funds with business angels (rounding the €60 Million) and with Venture Capitalists (rounding the €400 Million)10 and fiscal benefits for investors in early-stage start-ups. Additionally, the rising Portuguese community of incubators, accelerators, business angels and venture capitalist investors, points again to the investment in entrepreneurship in Portugal by private actors of its ecosystem. As of 2016, there is a national network of 121 incubators, which combined with accelerators go beyond 150, with around 2 300 start-ups being incubated as of September 2016.11
As a result, the Portuguese entrepreneurial ecosystem has been under the spotlight by entrepreneurship experts, institutions, the media and entrepreneurs themselves. Since 2004, Global Entrepreneurship Monitor experts have reported a yearly consistent improvement in ‘entrepreneurship framework conditions’ and regarding taxes and bureaucracy, the same experts ranked Portugal second only to Switzerland in 2015, whilst first in entrepreneurial education and third for R&D transfer. The Small Business Act Review of 2016 places Portugal among the best entrepreneurship scores in the EU. However, it also highlights that corporate taxation, political, legal and regulatory stability, transparency and flexibility in labour legislation are the Portuguese ecosystem’s three factors considered less attractive by investors. Moreover, the country’s capital, Lisbon, was elected the 2015 European Entrepreneurial Region of the Year, awarded by the European Committee of the EU Regions, chosen as the host for the 2016/17/18 Web Summits, and Beta-I, a Portuguese incubator, was elected 2014 biggest start-up and entrepreneurship promoter by the European Commission’s European Enterprise Promotion Awards (EEPA). As expected, international media (e.g. The Guardian, The Financial Times, Reuters) has followed the buzz and has been consistently reporting on Portugal
10 Laranjeiro, Ana. (2016) “Startup Portugal: Conheça as 15 medidas para apoiar o empreendorismo”, Jornal de Negócios
12
as an attractive destination for entrepreneurs to test and develop their ideas. Even comparing Lisbon, to the Californian Silicon Valley or Berlin, one of Europe’s top hubs for startups. Nevertheless, Lisbon is the most media undermined European hub, performing better as a start-up hub than the media would suggest, as perceived by founders.12
Finally, according to the World Bank’s Doing Business Reports, Portugal has been among the top reformers in Europe, especially in regulatory reform, not only due to the constant number of yearly-reforms since 2005, but also due to the improvement in its ranking position of the World Bank’s Ease of Doing Business Index, going from 113th out of 155 countries, to 33rd
from 2005 to 2006 and entering the top 30 in 2015, surpassing its pre-crisis rank. But the question of how such an improvement was achieved still remains.
4. Methodology
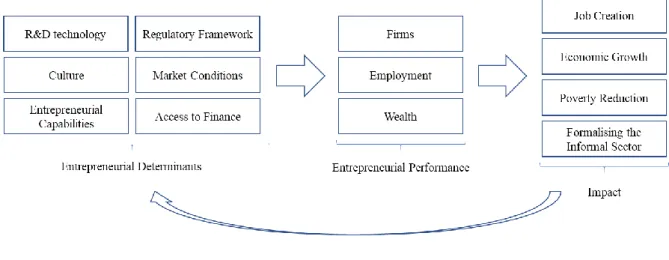
In essence, this paper uses the methodology put forth by the OECD-Eurostat (FIG. 2) to perform the detailed descriptive analysis of reforms impact, discussed later in this paper, which covers regulatory domains such as Administrative Burdens (entry and growth), Court and Legal Framework, Labour Market Regulations and Capital/Business Taxes.
Figure 2 - OECD Entrepreneurship Measurement Framework. Source: Adapted from OECD
12 Startup European Heatmap – Europe Report, 2016 found this to be true via European founders’ survey and
13
4.2 Policy Reform impact and effectiveness estimation, using OECD-Eurostat framework approach – Limitations and Assumptions
Although the framework’s authors recognize entrepreneurship as a “phenomenon that manifests itself through the economy in many different forms with many different outcomes [...]that are not additive”, they believe that establishing a framework with relevant, consistent and comparable data collection, will support analysts in understanding the dynamic interactions that may exist and target policies more accurately (Hoffman, A. et al., 2007).
The framework identifies three ‘separate, but inter-connected flows’ (FIG.2): (i) determinants, which represent the key factors affecting the (ii) entrepreneurial performance, of an ecosystem, in turn reflected by the target indicators policy makers believe have an (iii) impact on their ultimate policy objectives. This impact is the value generated by the ecosystem and entrepreneurship, while performance comprises indicators thought to reflect entrepreneurship. Furthermore, it is worth mentioning that other ‘flows’ are identified. For instances, although determinants affect the amount of entrepreneurial performance, which in turn influences impacts, such as economic growth, it is also true, impacts (economic growth) will affect determinants, by for example easing access to capital, through higher availability of capital.
Nonetheless, the impact on such policy objectives is not always clear and exclusively affected by performance indicators. Thus, including impact indicators in the framework serves only to demonstrate the theory behind it. Moreover, it is important to highlight that indicators are to some extent mere proxies of entrepreneurship and that in some cases growth may not reflect entrepreneurship at all, but may occur due to hidden variables driving growth. No combination of measures is yet able to exactly capture the number and value of entrepreneurship levels. Yet, the usage of such indicators is part of a much-needed pragmatic approach to such a framework.
Furthermore, there is no guarantee that government policy can address each market, systemic or institutional failure in a way that effectively improves the outcome. Besides, policy failure
14
Administrative Burdens
(entry and growth) Bankruptcy Regulations
Court and Legal Framework Labour Market Regulations Income Taxes, wealth/bequest taxes Business and Capital Taxes Patent System; Standards Burden of Government Regulation Average cost of bankruptcy proceedings Enforcing Contracts - Cost in % of claim Difficulty of Hiring Index Average Income Tax plus Social
Contributions
SME Tax Rates Property Rigths Costs required for Starting a
Business Average duration of bankruptcy proceedings Enforcing Contracts - Time Difficulty of Firing Index Highest Marginal Income Tax plus Social Security Contributions Taxation of Corporate Income Revenue (% of GDP) Intellectual Property Protection Minimum Capital Required
for Starting a Business
Insolvency Recovery Rate (cents on the dollar)
Enforcing Contracts - Nº procedures Ease of Hiring Foreign Labour Revenue from Bequest Tax Nº of Days for Starting a
Business
Quality of judicial process
Rigidity of Hours Index
Revenue from Net Wealth Tax Nº of Procedures for Starting
a Business Job Quality Index
Dealing w/ Construction Permits Registering Property Time for paying taxes
Regulatory Framework Determinants Administrative Burdens
(entry and growth)
Burden of Government Regulation Costs required for Starting a
Business Minimum Capital Required
for Starting a Business Nº of Days for Starting a
Business Nº of Procedures for Starting
a Business Dealing w/ Construction
Permits Registering Property Time for paying taxes
may arise from a variety of factors, such as inadequate policy design, implementation or governance failure. However, finding out why policies may be ineffective is not part of this paper’s goal, but rather trying to ascertain whether policies were effective (Table 2).
Although, the effects generated by policy reforms take time to accrue, they are expected to positively impact the regulatory environment. Nonetheless, some reforms have a direct short-term impact on indicators reflecting the ecosystem’s regulatory rigidity, for instances, a reduced corporate income tax rate, it is “immediately felt”, as entrepreneurs will pay less taxes. However, its impact, for instances, on increasing the number of high growth companies, is not. Therefore, throughout the policy reform research, attention was placed on tracking reforms (Table 3) that would suggest a short-term impact on regulatory framework (fact-based) determinants (Table 2) and assure a long-term accrued impact on broader performance variables (e.g. Business population growth). This selection process was adopted, as an attempt to correct for the assumption that hidden factors may have also contributed to altering the values. Seeing that indicators’ values are collected based on observable facts, impact can be measured by the change in those factual values. For instances, the Cost of Starting a Business, which reflects official average costs of each procedure officially required, based on formal legislation, for an entrepreneur to start a business. Here, the cost of each procedure is official and changes in its value only occur if reforms are implemented directly to lower the cost of procedures X or Y, which in turn affects the average cost (of procedures) to start a business.
Table 2 – OECD-Eurostat Regulatory Framework Determinants
15
Table 3 – Regulatory reforms per policy area, Netherlands and Portugal, 2006-2015
After analysis, individual and cross-comparative results and conclusions are taken, to track differences and/or commonalities in their approaches to policy reforms and their outcomes, helping to assess the effectiveness of each country’s reforms. Lastly, policy reform effectiveness is estimated by its, (un)successful impact on short-term fact-based determinants (e.g. Nº of days required for starting a business) a year after the reform’s implementation.
5. Database and Variables
The information and data value sources used were extracted from the annual reports and online databases of the World Economic Forum, OECD, Eurostat and Global Entrepreneurship Monitor for the period 2006-2016, for Portugal and the Netherlands. Moreover, they were obtained following the guidelines provided by the yearly OECD reports of “Entrepreneurship at a Glance”. To analyse their impact and effectiveness on the indicator values that measure regulatory frameworks’ rigidity, policy reforms were retrieved through the World Bank’s yearly Doing Business Reports, which collects hard data to compare economies’ business regulation for domestic firms, since 2003. These reports are formulated with the contribution of 13 000 specialists and leading scholars, to measure aspects of regulation affecting eleven areas of a business’s life, across 190 economies (in 2017). This measurement takes place by
Reforms 2006 2007 2008 2009 2010 2011 2012 2013 2014 2015 Paying Taxes
Dealing w/ Construction
Permits
Paying Taxes Starting a Business
Starting a Business
Paying
Taxes* Paying Taxes Dealing w/ Construction Permits Registering Property Labour Market Regulation Starting a Business Dealing with Construction Permits Dealing with Construction Permits Dealing with Construction Permits Starting a Business Dealing with Construction Permits Starting a
Business Paying Taxes Paying Taxes Paying Taxes Registering Property Enforcing Contracts Registering Property Registering Property Dealing with Construction Permits Resolving Insolvency Labour Market Regulation Enforcing Contracts Labour Market Regulation Labour Market Regulation Paying Taxes Resolving
Insolvency
Enforcing
Contracts Paying Taxes
Labour Market Regulation Labour Market Regulation Enforcing Contracts Labour Market Regulation Labour Market Regulation Resolving Insolvency PRT NLD
16
cross-comparing, ranking and publishing indicator values reflecting the state of economies’ regulatory frameworks and by tracking policy reforms and regulatory procedures.
Following the Framework’s Quality Assessment of indicators, no indicator with an overall quality grade below A (top-tier) was considered in policy reform impact, to use the most reliable and robust indicators available in the framework. This line of reasoning led to the dismissals of any domains with a low number of quality indicators, to attain the domain with the highest quality and facilitate data gathering, strength and availability across countries and time. As did the fact that by removing obstacles to establishment and growth of new ventures, the government helps and motivates potential entrepreneurs and ventures to take risks and succeed. Especially since for countries in crisis, fiscal distress makes economies more likely to implement regulatory reforms in the areas measured by Doing Business (Doing Business Report 2018, World Bank). As a result, the regulatory framework domain was chosen.
Moreover, the past decades, the focus on entrepreneurial policy has grown. As Storey and Greene (2010, p.208) put it “Ultimately, the ability of a country to nurture the growth of such businesses [high-growth ventures] is probably the most important element in enterprise development”. This is especially true since, a country’s regulations will impact businesses throughout the entirety of their lifecycle. For instances at start-up stage, entry and growth or labour market regulations may enhance or deter entrepreneur’s willingness to start a business and employ workers, as will tax policy affect ventures in their everyday operations.
Finally, regarding the choosing of a comparative country, for benchmarking purposes and measuring common or different policy reform impact and effectiveness, the Netherlands were chosen due to both countries being member-states of the EU and the Organization for Economic Co-operation and Development (OECD), per data availability and similarity to Portugal’s
17
performance on entrepreneurship-tracking rankings by renowned international institutions and because it’s considered to have somewhat better economic prospects than Portugal.
6. Results
Overall, Portugal has notoriously committed to reforming aspects of its regulation to simplify the requirements for creating and operating new ventures, to motivate national and foreign entrepreneurship and venture creation in its society. Although not all policies were effective in easing regulatory burdens, such as the majority of Court and Legal Framework, Labour Market and Bankruptcy Regulations reforms, most of Portuguese reforms were successful in their objectives. Accounting for 16 of the 30, the reforms targeted at easing Administrative Burdens (entry and growth) and Business/Capital Taxes, were the most effective and major drivers of the notorious improvement of the Portuguese entrepreneurial ecosystem’s regulatory framework. Moreover, Portugal was among the top-reformers throughout the period analysed, according to the OECD’s measuring method. The same, however, cannot be said for the Netherlands, which not only has not been a top reformer between 2006-2015, failing to invest in reforming several regulatory aspects of businesses’ life (e.g. Court and Legal Framework; Bankruptcy Regulations), but has also proven that around half of its reforms were ineffective in easing regulatory barriers. This discrepancy between country’s size of investments and commitment in reforming regulatory framework can be seen in the previously shown Table 3.
Throughout 2006 to 2013, Portuguese reforms targeted at reducing ventures Administrative Burdens of entry (Starting a Business), were found to be amongst the most effective. While in 2006 starting a business required at least 7,5 days, during which 8 procedures had to be performed and approved, each costing on average 7,9% (of GNI per capita) and a paid-in minimum capital requirement of 38,7% to be deposited in a bank before company registration. By 2013, the reforms implemented allowed companies to start up in 2,5 days, taking up to 3
18
procedures with an average cost of 2,5% each, with no paid-in minimum capital requirement. In the meantime, in the Netherlands, businesses starting in 2013 had to wait at least 3,5 days for 4 procedures to be processed, also without paid-in minimum capital requirements. In this domain, the Dutch only implemented two reforms, both effective and similar to Portuguese ones (Table 4).
Table 4 – Comparison of similar reform impact on regulatory framework determinants
Clearly, this easing of regulatory procedures’ complexity and costs at the initial stage of ventures lifecycle, reduces the burden it imposes on entrepreneurs in their consideration of whether to start-up. Here, both countries’ reforms were effective. However, with the nature of the ministry and its implied differences in procedural complexity per country, no inference seemed reasonable as to which of the countries was more effective in reforming.
After registering the business, a founder’s next step will be dealing with construction permits. The procedures, time and cost spent when engaging in the construction of your business facilities are a direct measure of administrative burdens that can arise during a business operation. For 5 consecutive years, Portugal invested in the use of technology and streamlining of inspection systems to simplify and speed up procedures. In 2006, dealing with facility construction took 350 days, 16 procedures and it cost 1,9% of the facility value. With the yearly reforms, until 2012, only 14 procedures were required with a cost of 1,4% and 118 days. The reduction in the days entrepreneurs would take to meet these requirements, alone is a major relief of administrative burdens at entry level of great relevance.
Data Source: OECD t=year of reform implementation
Country Reform Objective
Reform Outcome Before (t) After (t+1)
PRT Abolishing paid-in minimum capital requirement (mcp) to be deposited in the bank prior to venture registration
Mcp2010=34,1% Mcp2011=0
NLD Mcp2012= 49,4% Mcp2013=0
PRT Eliminating requirement to report to the Ministry of Labour
#days2012 = 5;
#procedures2012 = 5
#days2013 = 2,5;
#procedures2013 = 3
NLD
Eliminating requirement of Ministry of Justice approval before
incorporation
#days2011 = 8;
#procedures2011 = 6
#days2012 = 5;
19
However, one year of reforms is worth highlighting. Whilst in 2007, Portugal allowed online applications for building permits, assigned officers to each application and simplified approvals (Table 5), the country also tried to increase quality-controlling mechanisms of labour market regulation by adding a new procedure for inspection during construction. These reforms were found ineffective due to contradictory goals of two policies, one simplifying the other increasing procedures. As a result, not only was no improvement noticed, but both the number of days and procedures went up by one, with the harmful outweighing the beneficial.
Meanwhile, in the Netherlands, again only two reforms took place regarding construction permits, however one had no impact felt in the indicators reflecting this type of burden (Table 5). Thus, the reform was deemed ineffective, as was the Portuguese one in this area.
In this case it is easy to understand, from simple comparison, that the Dutch reform was more effective in easing regulatory burden, without aiming at two conflicting policy outcomes.
Table 5 – Reform impact on Dealing with Construction Permits determinants
Nonetheless, Portugal more than doubled the Dutch reforms, representing a higher investment on the country’s side. Moreover, aside from the first reform, all the subsequent were effective in easing dealing with construction permits. So effective that it became quicker to complete the process in Portugal than in the Netherlands during the 2006-2015 period, although Portugal still requires 1 procedure more, the number of days favours Portugal around 50.
Country Reform Objective
Reform Outcome
Before (t) After (t+1)
PRT
Simplifying approvals and implementing an online application system for building
permits #days2007 = 350; #procedures2007 = 16 #days2008 = 351; #procedures2008 = 17 NLD #days2011 = 179,5; #procedures2011 = 14 #days2012 = 161; #procedures2012 = 13 NLD
Improving construction regulation process by implementing a new
spatial planning law
#days2008 = 179,5;
#procedures2008 = 14
#days2009 = 179,5;
#procedures2009 = 14
20
Similarly, Portugal committed more to easing the property registry process than the Dutch. The latter reformed once by increasing process efficiency, which accounts for the only value change in the analysed period, reducing the minimum waiting period to finish registry from 5,5 days to 2,5. Comparatively, in 2006, it was more complex to register property in Portugal. Although the same number of 5 procedures were required, the Dutch dealt with them in 5,5 days while the Portuguese did it in 81. With a focus on technology and digitalization, and despite earlier reforms reducing the days to 12, it is the 2009 implementation of ‘one-stop-shops’ for property registry that allows Portugal to outperform the Netherlands in this area. By 2010, property could be registered in one day through one procedure in Portugal.
Although no inference on comparative policy reform effectiveness can be performed, due to differences in investment, we can ascertain the effectiveness of the Portuguese reforms in this domain. The easing of the property registration process has previously been demonstrated to drive business start-up and job creation.13 Moreover, such a significant reduction in administrative fees and simplification of incorporation procedures, is of a major contribution to the entrepreneurial ecosystem’s attractiveness.
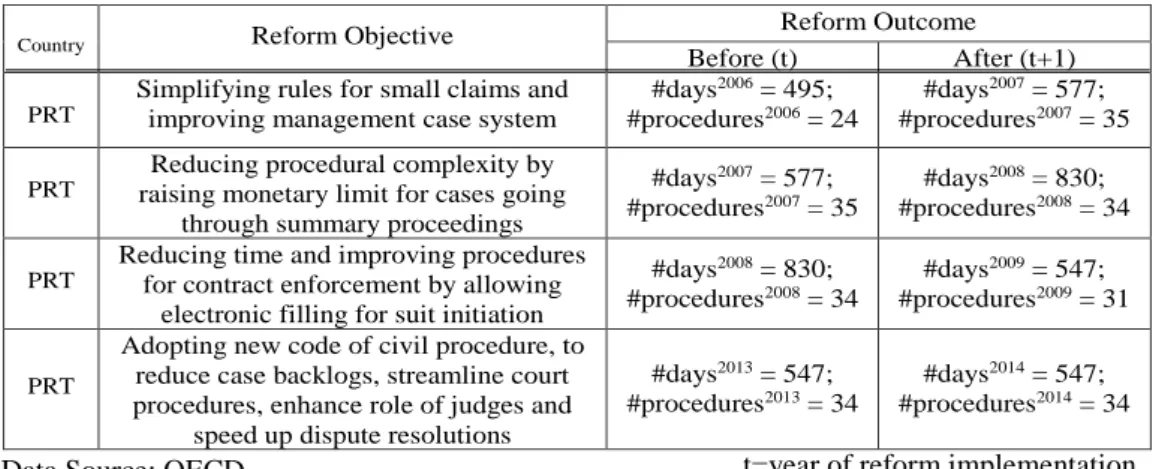
Entrepreneurship development is based on a trial-and-error basis, thus the matching of employees with the entrepreneur’s values, skills and other criteria might take a few trials to get right. Therefore, the legal framework and particularly the easing of legal contract enforcement should also be a focus of policy makers. As such, the Portuguese policy makers are no exception, whilst the Dutch are, failing to reform contract enforcement (2006-2016). Nevertheless, aside from 2008, the Portuguese failed to improve contract enforcement through policy reform, with some indicator values stagnating others deteriorating. (Table 6)
13 Brasntetter et al., 2010 show that a previous Portuguese reform setting up one-stop-shops, increased the number of business start-ups by 17% and created 7 new jobs per 100 000 county inhabitants per month, in the short-term.
21
Whilst in 2006, the Portuguese courts could legally resolve contract enforcements in at least 495 days through 24 procedures, by 2013 the same process took 547 days and 34 procedures. These are clear signs of ineffective policy reforms and increased rigidity of these regulatory burdens, which may deter or restrict entrepreneurial employment. Similarly, the Labour Market reforms implemented throughout the analysed decade, were also of significant ineffectiveness, despite being the largest number (6) of reforms per policy area (Table 7).
The Dutch implemented only one reform in 2015, similar to the Portuguese one of the same year (Table 7), which translated into a deterioration of the DHI14 by 17 points in 2016.
14 Difficulty (or Flexibility) of Hiring/Firing Indexes measure whether laws and regulations imply barriers or
difficulties of hiring/firing a standard worker in a standard company. The Rigidity of hours index measures the rigidity of working overtime (OECD-Eurostat, 2016)
Country Reform Objective
Reform Outcome
Before (t) After (t+1)
PRT
Simplifying rules for small claims and improving management case system
#days2006 = 495; #procedures2006 = 24 #days2007 = 577; #procedures2007 = 35 PRT
Reducing procedural complexity by raising monetary limit for cases going
through summary proceedings
#days2007 = 577;
#procedures2007 = 35
#days2008 = 830;
#procedures2008 = 34
PRT
Reducing time and improving procedures for contract enforcement by allowing
electronic filling for suit initiation
#days2008 = 830; #procedures2008 = 34 #days2009 = 547; #procedures2009 = 31 PRT
Adopting new code of civil procedure, to reduce case backlogs, streamline court procedures, enhance role of judges and
speed up dispute resolutions
#days2013 = 547;
#procedures2013 = 34
#days2014 = 547;
#procedures2014 = 34
Data Source: OECD t=year of reform implementation
Table 6 – Impact of Portuguese Policy Reforms in Contract Enforcement
DHI/DFI -Difficulty of Hiring/Firing Index; RHI – Rigidity of Hours Index Data Source: OECD
t=year of reform implementation
Country Reform Objective Reform Outcome
Before (t) After (t+1)
PRT
Increasing notice period for redundancy dismissals and the max. cumulative duration of fixed-term contracts
(t=2008)
No indicator value change was noticed
Implementing the approved new Labour Code DHI
2009=33
DFI2009=50
DHI2010=44,3 DFI2010=62,5
Increasing max. duration of fixed-term contracts and reducing the severance pay in redundancy dismissals
(t=2011)
No indicator value change was noticed Reducing wage premium for weekly holiday work and
abolishing priority rules for redundancy dismissals
DFI2012
=62,5 RHI2012=40,4
DFI2013=50
RHI2013=35,7
Reducing the severance pay per year of service and
increasing maximum duration of fixed-term contracts DHI
2013
=61 DHI2014=44,3
Introducing priority rules for redundancy dismissals
and regulations for collective bargaining agreements RHI
2014
=35,7 RHI2015=42,6
Reducing the max. duration of fixed-term contracts No indicator value change was noticed (t=2015)
*(higher values imply a more rigid regulation in Labour market)
22
Overall, labour market policy reform ineffectiveness is seen in both countries, which should be a major concern for policy makers, since the indicators measured, directly or indirectly, impact venture creation and development. For instances, if minimum wage increases and wage employment becomes more attractive, not only does labour become more expensive but so does the opportunity cost of becoming an entrepreneur.
Moreover, the importance of a country’s tax regime is obvious for entrepreneurs, since they have a direct impact on the supply of capital. High taxation discourages entrepreneurs, who see their potential benefits reduced and investors who see their returns decrease by high levels of taxation. Therefore, policy initiatives targeted at declining capital taxation or increasing investment incentives contribute to a more attractive entrepreneurial environment/ecosystem. Both Portugal (Table 8) and the Netherlands (Table 9), have focused on improving their tax environments to motivate entrepreneurs, self-employment and investment in venture funding.
Country Reform Objective Reform Outcome
Before (t) After (t+1)
NLD
Reducing taxes, mainly CIT and social security contribution rates
CIT2006 = 29,6%;
Rev. of CIT Taxation2006 = 3,45%;
SME Tax Rate2006 = 25,5%;
Nº of days for paying Taxes2006 = 250
CIT2007 = 25,5%;
Rev. of CIT Taxation2007 = 3,43%;
SME Tax Rate2007 = 20%;
Nº of days for paying Taxes2007 = 180
Reducing frequency of filling and
paying VAT Nº of days for paying taxes
2009 = 164 Nº of days for paying taxes2010 = 131
Increasing employer paid labour contributions, road and polder board
taxes
(t=2014)
No direct impact on Capital and Business Taxes Determinants Lowering rates for employer health
insurance contributions and improving online system for paying
CIT
Nº of days for paying taxes2015 = 120 Nº of days for paying taxes2016 = 119
Data Source: OECD t=year of reform implementation
Table 9 – Impact of Policy Reforms on Capital/Business Taxes Determinants
Country Reform Objective Reform Outcome
Before (t) After (t+1)
PRT
Reducing Corporate Income Tax Rate (CIT)
CIT2006 = 27,5%;
Revenue of CIT Taxation 2006
= 2,83%
CIT2007 = 25%;
Rev. of CIT Taxation 2007
=3,46% Introducing new social security code and
amending tax brackets. Taxable income up to €12 500 became subject to half the rate
(12,5%)
Nº of days required for paying taxes2009 = 328
Nº of days required for paying taxes2010 = 298
Reducing CIT and tax rate for a portion of the taxable profits of qualifying SMEs
CIT2013 = 25%;
Rev. of CIT Taxation 2013
=3,26%
CIT2014 = 23%;
Rev. of CIT Taxation 2014
=2,84% Reducing CIT and increasing the allowable
amount of the loss carried forward
CIT2014 = 23%;
Rev. of CIT Taxation 2014
=2,84%
CIT2015 = 21%;
Rev. of CIT Taxation 2015
=3,16% Reducing CIT, implementing better
accounting software and enhancing online filling system of taxes
Nº of days required for paying taxes2015 = 275
Nº of days required for paying taxes2016 = 243
Data Source: OECD t=year of reform implementation
23
Regarding taxation burdens, we can see that Portugal has consistently focused on reducing the Corporate Income Tax rates and creating special taxation classes for small-and-medium enterprises. Plus, efforts have also been made reducing the number of days required to pay taxes, from 328 (2006) to 243 (2016) (Table 9). Here, the reduction of venture operation costs, specially income taxes, is a clear improvement of the entrepreneurial ecosystem, by incentivizing entrepreneurs through the relief of tax burdens. This coupled with the reduced time to pay taxes, translates into a lower opportunity cost of becoming an entrepreneur.
On the Dutch side, this policy area was the most invested one in the period analysed and its reforms the most effective. Although not much focus was given to reducing CIT, the country greatly reduced the time required to pay taxes, similarly to the Portuguese use of online technology, from 250 days to 119 in a decade. Here, the implementation of online systems was more effective in Portugal reducing time in 32 days, while the Dutch only achieved 1 less day.
Across countries, the reforms diverged in their targets but most were effective in alleviating taxation burdens, although its faster to pay taxes in the Netherlands, the tax paid is also higher.
7. Concluding Remarks
Concluding, the easing of regulatory rigidity affecting regular business operations throughout their lifecycle was achieved, in Portugal, during 2006-2016, by successful reforms in easing the regulatory requirements of starting a business, dealing with building permits, registering property and tax regulation. These gave more appeal to the Portuguese regulatory framework by making it easier and less costly for entrepreneurs to set up shop and operate in Portugal. Whilst in 2006, overall (i.e. ease of doing business index, OECD) Portugal underperformed the Netherlands, by 2016 the tables had turned. Thanks, to its commitment to reforming regulatory framework, Portugal was also able to outperform the Netherlands in the rigidity of dealing with construction permits and registering property, where the most notorious improvements took place. The Dutch were also surpassed in easiness of legal contract enforcement, although here
24
the merit does not seem to come for Portuguese efforts, as reforms in this area were highly ineffective, but from the fault of the Dutch, failing to reform this area during the analysed decade, seeing its rank deteriorate. On the other hand, the Netherlands, surpassed Portugal in easiness to start a business and deal with capital and business taxes, despite Portugal’s improvement, the Dutch was higher.
Overall, we can derive that quality-before-quantity of policy reforms gives greater contribution to the ecosystem’s attractiveness. Although, Portugal had much higher levels of investment in reforming its regulatory environment, a few quality and effective reforms were enough for the Netherlands to surpass Portugal in the aforementioned areas, but where the country failed to reform Portugal outperformed. As seen from this analysis, policy makers should also not fail to reform areas of their countries’ regulatory frameworks. In today’s world where every country is investing in improving its competitive position in the global marketplace, it is crucial to take an ecosystem’s holistic approach to policy reform and not just focus on a few aspects of regulatory areas or a few actors of the ecosystem, but rather all of them.
Finally, the methodology used in this paper proves to be practical and representative of the impact of regulatory framework policy reforms, for the available data. Although the overall exact value contribution of policy reforms to countries’ economies cannot yet be given by methodologies such as this one, the contribution to the embellishment of the entrepreneurial ecosystem can be measured. Thus, following the rationale that a more attractive entrepreneurial will drive up entrepreneurship, which in turn drives economic growth, allows to infer that contributions to the improvement of a countries’ entrepreneurial ecosystem, such as the easing of its regulatory framework, will eventually lead to improvements in economic outlooks. However, to create better conditions for reform effectiveness, policymakers must address regulatory complexity by clearly defining its objectives and effectively communicating them, assuring a clear interpretation and perception on behalf of the ecosystem’s investors.
25
References
Aspen Network of Development Entrepreneurs (2013) Entrepreneurial Ecosystem Diagnostic Toolkit
Branstetter, Lee G., Francisco Lima, Lowell J. Taylor and Ana Venâncio. 2010. “Do Entry Regulations Deter Entrepreneurship and Job Creation? Evidence from Recent Reforms in Portugal.” Working Paper 16473, National Bureau of Economic Research, Cambridge Ciccone, Antonio, and Elias Papaioannou. 2007. _Red Tape and Delayed Entry. Journal of the European Economic Association, 5(2-3): 444-458
Eurostat Database: http://ec.europa.eu/eurostat/web/structural-business-statistics/entrepreneur ship/indicators (accessed November 2017)
Herrington, M. et al. Global Entrepreneurship Research Association (GERA) - Global Entrepreneurship Monitor, Global Reports 2006-2017
Isenberg, D. (2011) The entrepreneurship ecosystem strategy as a new paradigm for economy policy: principles for cultivating entrepreneurship, Babson Entrepreneurship Ecosystem Project, Babson College
Kollmann et al. (2016). European Startup Monitor: European Report 2016
Laranjeiro, Ana (2016). Startup Portugal: Conheça as 15 medidas para apoiar o empreendorismo, Jornal de Negócios. http://www.jornaldenegocios.pt/empresas/pme/start-ups/detalhe/startup_portugal_conheca_as_15_medidas_para_apoiar_o_empreendedorismo Mason, C. and Brown, R. (2014). Entrepreneurial Ecosystems and Growth Oriented Entrepreneurship, OECD
OECD Database: http://www.oecd.org (accessed November 2017)
OECD (2015-2017), Entrepreneurship at a Glance 2015-2017, OECD Publishing, Paris http://dx.doi.org/10.1787/entrepreneur_aag-2017-en
Portugal Startups. 2017: http://portugalstartups.com/ (accessed November 2017)
Schumpeter, J. A. (1934). The Theory of Economic Development: An Inquiry into Profits, Capital, Credit, Interest, and the Business Cycle, Cambridge Mass.: Harvard University Schwab, K. et al. World Economic Forum. 2006-2018. The Global Competitiveness Reports and The Travel and Tourism Competitiveness Reports 2006-2018
Stam, E. (2015). Measuring Entrepreneurial Ecosystems, Discussion Paper Series 17-11, Tjalling C. Koopmans Research Institute and Utrecht School of Economics
Wenneckers, S. and Thurik, R. (1999). Linking Entrepreneurship to Economic Growth World Bank Database; http://www.worldbank.org/(accessed November 2017)
World Bank. 2005-2018. Doing Business 2005-2018: Reforming to Create Jobs.