Universidade de Aveiro Ano 2013
Departamento de Biologia
Marco André
Ferreira Fernandes
Assessment of silver nanoparticles effects: from
proteins to species
Efeitos de nanopartículas de prata: das proteínas
para a espécie
DECLARAÇÃO
Declaro que este relatório é integralmente da minha autoria, estando
devidamente referenciadas as fontes e obras consultadas, bem como
identificadas de modo claro as citações dessas obras. Não contém, por isso,
qualquer tipo de plágio quer de textos publicados, qualquer que seja o meio
dessa publicação, incluindo meios eletrónicos, quer de trabalhos académicos.
Universidade de Aveiro Ano 2013
Departamento de Biologia
Marco André
Ferreira Fernandes
Assessment of silver nanoparticles effects: from
proteins to species
Efeitos de nanopartículas de prata: das proteínas
para a espécie
Tese apresentada à Universidade de Aveiro para cumprimento dos requisitos necessários à obtenção do grau de Mestre em Biologia Aplicada, realizada sob a orientação científica do Doutor António José Arsénia Nogueira Professor associado com agregação do Departamento de Biologia da Universidade de Aveiro e co-orientação científica do Doutor Rui Miguel Pinheiro Vitorino, investigador auxiliar no Departamento de Química da Universidade de Aveiro e da Doutora Maria de Fátima Tavares de Jesus, bolseira do Departamento de Biologia da Universidade de Aveiro.
Investigação realizada no âmbito do projecto “ASSAY - Avaliação do deStino e efeitoS de nanopartículas de prata em ecossistemas Aquáticos” financiado através do Programa Operacional Factores de Competitividade (COMPETE) com o n.º FCOMP-01-0124-FEDER-013952 (Refª. FCT PTDC/AAC-AMB/113649/2009).
Apoio financeiro do POCTI no âmbito do III Quadro Comunitário de Apoio.
Apoio financeiro da FCT e do FSE no âmbito do III Quadro Comunitário de Apoio.
o júri
presidente Professora Doutora Maria Adelaide de Pinho Almeida
professora auxiliar, Universidade de Aveiro
Professora Doutora Maria Cláudia Gonçalves da Cunha Pascoal professora auxiliar, Universidade do Minho
Doutor Manuel Ramiro Dias Pastorinho Bolseiro de Pós-Doutoramento, Universidade de Aveiro
Professor Doutor António José Arsénia Nogueira professor associado c/ agregação, Universidade de Aveiro
agradecimentos Este trabalho de investigação não teria sido possível sem o apoio de várias pessoas e instituições, por isso quero agradecer:
Ao professor António Nogueira pela oportunidade e o incansável apoio.
Ao professor Francisco Amado por disponibilizar o seu laboratório e ao professor Rui Vitorino pela introdução ao domínio científico da proteómica.
À Virgínia Carvalhais pela preciosa ajuda prestada em toda a temática da análise das proteínas.
À Fátima Jesus que já desde o meu projecto de licenciatura me tem vindo a “aturar” sempre com a sua boa disposição que lhe é característica.
A toda a minha família em especial à minha mãe e irmão por estarem sempre presentes naqueles momentos distintivos.
A todo o grupo do RESET pelas reuniões produtivas e pelo sempre desejado momento gastronómico.
A todo o grupo do “Beer Friday” e das “futeboladas” semanais.
A todos os meus amigos e em especial: David M., Bruno O., Tamira Diogo C., Hugo M., Hugo V., Rui M., Fasola, Masha, Andreia R., Sara A., Gonçalo F., Luís M., Rhaul, Jessica, Carol, Janeco, Sue, Sónia, Fabiana F., Jorge H., Patrícia, Diana, Pestana e Luísa.
E por fim a todos aqueles que integraram parte da minha vida durante esta etapa.
O meu sincero agradecimento, Marco
palavras-chave Avaliação de Risco Ambiental, biomarcadores, proteómica, nanopartículas de prata
resumo A contínua expansão industrial de nanopartículas de prata manufacturadas, em conjugação com a sua capacidade para se libertarem de produtos de consumo, directamente para a água, irá certamente aumentar a sua acumulação no ambiente e em matrizes biológicas. O actual nível de conhecimento acerca da ecotoxicologia e destino das AgNPs em ambientes aquáticos, ainda apresenta algumas falhas. Assim, o principal objectivo desta tese, é desenvolver uma abordagem metodológica integrativa, de forma a avaliar os efeitos das AgNPs para os organismos dulçaquícolas pertencentes a diferentes níveis de organização biológica, desde parâmetros sub-individuais e sub-celulares, até individuais, extrapolando os efeitos ao nível da comunidade. Nos níveis sub-individuais e sub-celulares, estudámos as respostas bioquímicas e a expressão proteicas em Chlamydomonas reinhardtii expostas a AgNPs de diferentes tamanhos.
Em relação aos níveis individuais, estudámos os efeitos das AgNPs no crescimento da microalga Pseudokirchneriella subcapitata e os efeitos na sobrevivência, crescimento e reprodução do crustáceo Daphnia magna exposto a AgNPs via meio ou através da dieta. De forma a extrapolar os efeitos das AgNPs, desde os indivíduos até ao nível da comunidade utilizamos a abordagem com SSDs.
keywords Environmental Risk Assessment, biomarkers, proteomics, silver nanoparticles
abstract The continuous industrial expansion of engineered silver nanoparticles (AgNPs) in conjugation with their ability to be released from the products to the water will likely enhance their accumulation in environmental and biological matrices. The current level of understanding on the environmental fate and ecotoxicology of AgNPs in the aquatic environment still has some gaps. Thus, the main goal of this thesis is to develop an integrated methodological approach to assess the effects of AgNPs to freshwater organisms at different levels of organization, from sub-individual and sub-cellular endpoints, to individual and extrapolating to the community level effects. . At the sub-individual and sub-cellular levels we studied the biochemical and protein expression responses in
Chlamydomonas reinhardtii exposed to AgNPs with different sizes. Concerning the individual levels we studied the effects of AgNPs in the growth of the microalgae Pseudokirchneriella subcapitata and the effects on the survival, growth and reproduction of the crustacean
Daphniamagna exposed to AgNPs via the water or the diet. Finally, to extrapolate the effects of AgNPs from the individual to the community level we used the SSD approach.
i
Table of Contents
Figure list ... iii
Table list ... vi
Preamble ... 2
CHAPTER I: General Introduction ... 3
General introduction ... 4
1.1 Nanomaterials as a source of pollution ... 4
1.2 Ecotoxicological testing in freshwater ecosystems ... 7
1.3 Endpoints at the sub-individual level ... 8
1.4 Molecular endpoints at the protein level – Proteomics ... 12
1.5 The species sensitivity distributions approach (SSDs) ... 14
1.6 Quantitative structure–activity relationships (QSARs)... 16
1.7 Objectives and thesis outline ... 18
CHAPTER II: Biochemical and protein expression responses in Chlamydomonas reinhardtii to silver nanoparticles exposure ... 24
Abstract ... 25
Introduction ... 27
Material and methods... 29
2.1 Reagents ... 29 2.2 Nanoparticles characterization ... 29 2.3. Microalgae assays ... 30 2.4. Biomarkers ... 31 2.5. Protein expression ... 33 2.6. Statistical analysis ... 34
2.7. Gene network pathway analysis ... 35
Results and Discussion ... 36
Nanoparticles characterization ... 36
C. reinhardtii growth inhibition ... 37
Conclusions ... 46
Acknowledgments ... 46
Chapter III: Chronic effects of silver nanoparticles to Daphnia magna: aqueous and dietary exposure ... 55
ii
Introduction ... 57
Material and methods... 58
1.1. AgNPs preparation and characterization ... 58
1.2. Culture conditions ... 59
1.3. Bioassays ... 59
1.4. Statistical analysis ... 61
Results ... 62
AgNPs characterization ... 62
Short-term effects of AgNPs to P. subcapitata and D. magna ... 64
Effects of AgNPs to D. magna through aqueous exposure ... 65
Effects of AgNPs to D. magna through diet exposure ... 67
Discussion ... 68
Acknowledgments ... 73
References ... 73
CHAPTER IV: Silver nanoparticles toxicity: species sensitivity distributions and general trends ... 78
Abstract ... 79
Introduction ... 80
Material and methods... 81
2.1 Gathering of data ... 81
2.2. SSDs construction ... 81
2.3. Calculation of the surface-area-to-volume-ratio of AgNPs (only for quasi-spherical AgNPs) ... 82
Results and Discussion ... 82
SSDs for AgNPs concentration ... 82
1.2. SSDs for AgNPs surface-area-to-volume-ratio ... 84
General trends in AgNPs toxicity ... 86
Conclusions ... 88
Supplementary material ... 88
iii
Figure list
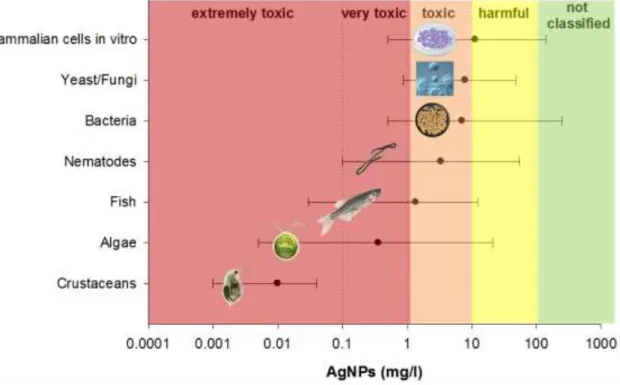
Figure 1 - Toxicity (minimum and maximum values) of AgNPs to different taxa. Presented as median L(E)C50 values for eukaryotic organisms and minimum inhibitory concentration (MIC) for bacteria. Adapted from Bondarenko et al. (2013). ... 7
Figure 2 - Levels of biological organization, as a function of the type of response and the ecological and toxicological relevance. ... 8
Figure 3 - Enzymatic pathways involved in xenobiotic biotransformation and antioxidant defenses (adapted from Howcroft et al., 2009). Superoxide dismutase (SOD), lipid peroxidation (LPO), catalase (CAT), glutathione peroxidase (GPx), glutathione reductase (GR) and glutathione S-transferase (GST). ... 10
Figure 4 - General workflow of proteomic approaches ... 13 Figure 5 - iTRAQ permits the relative quantification of peptides and proteins. Both identification and quantification of peptides occurs in the MS/MS scan. Comparing the peak intensities of the iTRAQ reporter ions leads to quantification (Meyer et al., 2010). ... 15
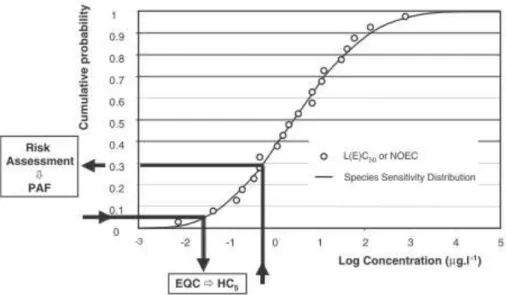
Figure 6 - A typical general SSDs, expressed as a CDF. The dots represent the input data (Posthuma et al., 2010). ... 16
Figure 7 - STEM pictures of citrate coated AgNPs in MBL medium after 24 h: 10 (A1) and 80 (A2) nm. ... 36
Figure 8 - DLS measurements of zeta potential (B1) and size (B2) of citrate coated AgNPs in MBL media: 10 (grey filled dots) and 80 (black filled triangles) nm for exposure times from 1 to 72 h. Dotted line as reference for the 100 nm size. ... 37
Figure 9 - Growth rate of C. reinhardtii exposed to AgNPs: grey bars (10 nm) and black bars (80 nm). Comparisons were made with control group (0). Data are reported as mean ± SE Dunn's method) *p < 0.05. ... 38
Figure 10 - Biochemical response of C. reinhardtii to AgNPs: grey bars (10 nm) and black bars (80 nm). Chlorophyll a and b (Chl a+b) and glutathione S-transferase (GST). Bars are mean values and the corresponding standard error bars. *= Dunnett’s test,
iv
Figure 11 – Catalase activity (CAT) of C. reinhardtii to AgNPs: grey bars (10 nm) and black bars (80 nm). Bars are mean values and the corresponding standard error bars. *= Dunnett’s test, p<0.05. ... 40 Figure 12 - Biochemical response of C. reinhardtii to AgNPs: grey bars (10 nm) and black bars (80 nm). Presented as guaiacol peroxidase (G-Pox) and lipid peroxidase (LPO). Bars are mean values and the corresponding standard error bars. *= Dunnett’s test, p<0.05. ... 41
Figure 13 - Heat map (A1) of protein expression profiles for AgNPs exposure. 10 nm: A and B (2 and 31 µg AgNPs/L respectively); 80 nm: C and D (32 and 480 µg AgNPs/L respectively); Ag+: E (2 µg/L). Tree clustering between treatments by euclidean distances (1.4 to 3.0). Proteins are identified with UniProt acession numbers. Qualitative designation of protein regulation, either as down or up-regulated (-1.8 to 1.7). Blue squares denotes no data. Fold change (A2) of protein expression for the treatments with AgNPs (10 and 80 nm) and Ag+. Down-regulated proteins α<0.05 ratio<1; Up-regulated proteins α<0.05 ratio>1. ... 44 Figure 14 - Biological function as a percentage of the 26 regulated proteins (up or down) based on the AmiGO classification system. Performed using slim down associations with Plant GO slim. ... 45
Figure 15 - Visual characterization of AgNPs: A) SEM picture of a AgNPs cluster formed after 24 h of exposure in ultrapure water; B) size distribution of AgNPs... 64
Figure 16 - Effects of AgNPs to D. magna, through aqueous exposure, after a 21 days period, on survival (A) total offspring per Daphnia (B), time to 1st brood (C) and aborted eggs per Daphnia at each instar stage (instar #5 is equivalent to the 1st brood) (D).Time to 1st brood represents the time elapsed between the start of the test and the release of neonates from the brood pouch to the external medium. Comparisons were made with control group (0) and data is reported as mean ± SD (total offspring per
Daphnia, Tukey test) and median with 5th/95th percentiles (time to 1st brood, Dunn's
method) *p <0.05. In B calculated EC50 for reproduction, 21.3 with a 95% C.L. of
17.5-25.2 µg AgNPs/L. ... 66
Figure 17 - Effects of AgNPs to D. magna, through diet exposure, after a 21 days period, on survival (A), offspring production at each instar (B), body length (BL) of adults at the start of the 1st reproduction (C), final weight of adults (D). Comparisons
v
were made with control group (0). Data are reported as mean ± SE Dunn's method) a, b, c, *p < 0.05. ... 67
Figure 18 - SSD of AgNPs toxicity, expressed as concentration (mg/L) at the species level ... 83
Figure 19 - Distribution of AgNPs toxicity, expressed as concentration (mg/L), to groups of organisms: algae, crustaceans, fish and plants ... 84
Figure 20 - SSD of AgNPs toxicity, expressed as surface-area-to-volume-ratio (nm2/L) at the species level ... 85
Figure 21 - Distribution of AgNPs toxicity, expressed as surface-area-to-volume-ratio (nm2/L), to groups of organisms: algae, crustaceans, fish and plants ... 86
Figure 22 - Relationship between the effect concentration (EC50) of AgNPs to aquatic
organisms and the size (r²=0.01)... 87
Figure 23 - Relationship between the effect concentration (EC50) of AgNPs to aquatic
organisms and the surface-area-to-volume-ratio (SAV ratio). The equation describing the data is: EC50 = 0.405*ln(SAV ratio) - 15.205; r²=0.856. ... 87
vi
Table list
Table 1 - Spearman correlation between the biomarkers tested for AgNPs 10 nm exposure. *p<0.05; ** p<0.001. ... 42
Table 2 - Protein abundance ratios determined by iTRAQ quantification compared with the several treatments. Ratios are presented as mean±SD. ... 52
Table 3 - Hydrodynamic size, zeta potential (ζ-potential), dissolution rate, theoretical ionic strength and theoretical chloride (Cl-) concentration in the matrices used for testing AgNPs toxicity - ASTM, MBL and ultrapure water as reference (UPW) for several exposure periods. ... 63
Table 4 - Summary of the short-term toxicity of AgNPs to P. subcapitata (growth inhibition) and D. magna (feeding rate and immobilization) in the absence (-) or in the presence (+) of food (algae). EC20 and EC50±CL (confidence limits at 95%) are given in
mg/l. (r2 represents the coefficient of determination. ... 65
Table 5 - Short-term toxicity data of AgNPs to both tested species P. subcapitata and
D. magna found in the literature (selected taking in account coating type and size, for a
2
Preamble
The Industrial Revolution was a booster for the chemical industry that we currently know. The fast growth of the human population at the time increased the demand on first necessity goods, which forced chemists and engineers to respond to these growing needs and, thus, promoting the emergence of the principles of mass production to create a high variety of new chemical substances at a large scale.
Currently, the world population is seven times higher than during the Industrial Revolution period and, in overall, life expectancy increased by far. Nowadays our demand for goods never was so high, and consequently emerging technologies as nanotechnology have developed and have created several niches of market. One of them is the household product sector, where we can find a high variety of products, from anti-ageing cosmetics containing fullerenes to anti-odor clothing containing silver nanoparticles. Thus, it is imperative to evaluate the environmental impacts of these nanoproducts during their life cycle, considering their effects during production, usage and end-of-life stages.
The multidisciplinary field of Ecotoxicology and Environmental Toxicology owns integrative tools – e.g. ecological and biochemical endpoints for evaluating the effects of stressors across all levels of organization from the molecular level to whole communities and ecosystems. Tools as species sensitivity distributions for ecological risk assessment can be used to predict the no-effect concentrations of stressors and evaluate the causal relationship between stressors and effects or even to predict the likelihood of future events.
Water is an essential element to all forms of life. Freshwater is the most common type of water in inland aquatic ecosystems and, thus, is of particular interest in Ecotoxicology.
3
4
General introduction
Index
1.1 Nanomaterials as a source of pollution
1.2 Ecotoxicological testing in freshwater ecosystems 1.3 Endpoints at the sub-individual level
1.4 Molecular endpoints at the protein level – Proteomics 1.5 The species sensitivity distributions approach (SSDs) 1.6 Quantitative structure–activity relationships (QSARs) 1.7 Objectives and thesis outline
Nanotechnology will soon revolutionize the technology field, bringing to light new and exotic materials and products; however as common there is a hiatus between the evaluation of the possible impacts of these nanomaterials on human health and environment and their design and commercialization. (Quik et al., 2011).
1.1 Nanomaterials as a source of pollution
The term “nanotechnology” was first applied in the beginning of the 70’s by Professor Norio Taniguchi of Tokyo Science University to illustrate “the extension of traditional silicon machining down into regions smaller than one micron” (Edwards, 2007). However, nowadays, the widely spread and accepted definition is the engineering and production of objects by controlling shape and size at the nanometer scale (Royal Society and Royal Academy of Engineering, United Kingdom (2004) quoted by Luoma, 2008). Thus, the occurrence of the “nano” prefix in terms like nanomaterials, which include nanofilms (one dimension), nanowires, nanotubes (two dimensions) and nanoparticles (three dimensions), fills out our present vocabulary (Handy et al., 2008).
The International Organization for Standardization (ISO) defines engineered nano-objects (ENO) as objects intentionally produced, which includes particles, plates or fibers with at
5
least one external dimension between 1-100 nm (ISO, 2010; Mueller et al., 2012). The modern society is dependent on nanotechnology and on the related nanoproducts, which is associated with the fast growth in the development of new nanotechnologically-enabled particles, materials and products in the last few decades (Musee, 2011). Numerous products containing ENO are already on market, ranging from textiles with antibacterial properties with silver nanoparticles (AgNPs) as key component to high performance batteries with carbon nanotubes (CNT), self-cleaning paints and coatings with photocatalytically active titanium dioxide particles (nano-TiO2) and sunscreens with zinc
oxide nanoparticles (nano-ZnO) as active component (Mueller et al., 2012). Since the research on new applications of nanoparticles is increasing, it is expected that the amount of consumer products containing engineered nanomaterials (ENs) raise, representing a major shift over the presently proportion of municipal solid waste disposed globally (Walser et al., 2012). The presence of these products in disposed waste can render different properties relatively to conventional materials and potentially cause sanitary and environmental risks (Marcoux et al., 2013). So, it is mandatory an experimental prospection on the risks associated with these emerging products, in order to fulfill the demand of experimental evidences of the public and regulatory authorities (Bouillard et al., 2013). Facing the current need of information, regarding typology, distribution and exposure of ENOs, the Danish Environmental Protection Agency created the ENOs product (El Badawy et al., 2011) This will allow gathering enough data from the ENO commercialization in the Danish market and therefore permit a better quantification of the nanowaste volumes. In addition, global ENO inventories are available at the Woodrow Wilson International Centre for Scholars (http://www.nanotechproject.org/), where the company identified an increase of ENO from 212 (March 2006) to 1628 (October 2013) (Woodrow Wilson International Centre for Scholars, 2011). Moreover, accessing the Nanowerk Nanomaterial Database Inventory (http://www.nanowerk.com/) allows the association of the respective nanocomponent with the company responsible for their production and commercialization (Nanowerk Nanomaterial Database Inventory; Musee, 2011). The most common ENs in ENO are silver (383 products), followed by titanium (including titanium dioxide) as the second most referenced (179), carbon which includes fullerenes (87), followed by silicon/silica (52), zinc (including zinc oxide) (36) and gold (19) (Woodrow Wilson International Centre for Scholars, 2011).
6
In the present work, we focused on silver nanoparticles (AgNPs), which are particles of silver with at least one external dimension in a size range of 1–100 nm (Nowack et al., 2011). They are the most common engineered nanoparticles with a worldwide estimated production from 55 to 320 tons/year (Nowack et al., 2011; Piccinno et al., 2012). As other nanomaterials, their production and application in several areas continues to grow. AgNPs are applied in consumer products, food technology, textiles, as well as medical products and devices (Yu et al., 2013). The main applications of AgNPs are related to their antimicrobial activity, which is due to the release of ionic silver (Sotiriou and Pratsinis, 2010). The rapid growth in the commercial use of AgNPs raised concern on the increasing environmental exposure (Yu et al., 2013). In surface waters, the predicted environmental concentration (PEC) is 0.764 and 0.116 ng L-1, respectively in Europe and U.S. (Gottschalk et al., 2009). The PEC is higher for the sewage treatment plant effluents: 32.9-111 ng L-1 and 16.4-74.7 ng L-1, respectively for Europe and U.S (Gottschalk et al., 2009). In the sediment fraction is predicted an annual variation of 952 ng kg-1 and 195 ng kg-1, respectively for Europe and U.S (Gottschalk et al., 2009).
However, aquatic organisms are not only exposed to AgNPs but also to the silver ion (Ag+), which is released from the AgNPs. Ag+ is recognized as being the most toxic silver form to aquatic organisms (Hogstrand and Wood, 1998) and the second following mercury among all trace metals (Rodrigues et al., 2013). Taking this in consideration allied to the high production and release of AgNPs to the environment highlights the concern on the environmental effects of AgNPs to aquatic organisms. The toxicity of AgNPs to aquatic organisms is known to be dependent on several factors such as dissolution, particle size, presence of functional groups, coatings and surface charge. (Levard et al., 2012; Ma et al., 2012).
AgNPs are known to cause deleterious effects on bacteria, fungi, microalgae, crustaceans, fish and plants (Yu et al., 2013), being classified as ‘very toxic’ to aquatic organisms (Bondarenko et al., 2013). They are most toxic to crustaceans, followed by algae, as depicted in Figure 1. Nevertheless, there is no universal agreement on the toxicity mechanisms) of AgNPs (Fabrega et al., 2011) despite several modes of action for the antibacterial activity are proposed, involving generation of reactive oxygen species (ROS), attachment and disruption of cell membrane, changes in membrane permeability, protein interaction and interference with DNA replication (Yu et al., 2013).
7
Figure 1 - Toxicity (minimum and maximum values) of AgNPs to different taxa. Presented as median L(E)C50 values for eukaryotic organisms and minimum inhibitory concentration (MIC) for bacteria. Adapted from Bondarenko et al. (2013).
1.2 Ecotoxicological testing in freshwater ecosystems
In the last few years, the field of Ecotoxicology was marked by the development of new assays and the emergence of novel model organisms that added relevance for the study of a particular environment. This was triggered by the research on toxic effects at different levels of biological organization (Figure 2) and the use of a set of uniform methodologies, covering a significant part of the life-cycle of an organism, enclosing both short (acute exposure) and long-term (chronic exposure) responses. Traditional endpoints provide the assessment of survival (in the case of acute exposure), sub-lethal endpoints such as growth, feeding behavior, bioaccumulation profiles and reproduction which give a measurement of fitness and therefore allow the assessment of population-level effects.
8
Figure 2 - Levels of biological organization, as a function of the type of response and the ecological and toxicological relevance.
Adapted from http://www.amap.no/documents/18/assessment-reports/16.
Thus, adding new and alternative endpoints at the cellular, sub-cellular, or molecular level could enhance their sensitivity, specificity and throughput capacity. Nevertheless, a good correlation is needed between sub-cellular or molecular responses and effects at higher levels of biological organization, in order to fulfill the requisites in the perspective of the Ecological Risk Assessment (ERA) policy (Posthuma et al., 2010). Furthermore, these alternative techniques can integrate responses at different levels of organization and therefore contribute for the better understanding of the mechanism behind toxic action. Consequently, they can also help in the design of predictive tools that can be employed in early warning systems (Posthuma et al. 2010).
1.3 Endpoints at the sub-individual level
Among the wide range of endpoints at the sub-individual level, we focused on biomarkers and proteomics.
9
The definition of biomarker (or biological indicator), is surrounded by a certain ambiguity changing according to the scientific area (e.g. Health sciences to Environmental sciences) and from each author perspective (Contreras et al., 2010; Nowrouzi et al., 2010). In theory, anything that can be measured in an organism can represent a marker for some biological event or process. The current definition of biomarker for Ecological Risk Assessment (ERA) relies on any biological response to an environmental stressor at a sub-individual level, measuring within organism’s biochemical, molecular, genetic, immunologic, histopathological, physiological signals or even metabolites of occurred events or processes in biological systems (Huggett et al., 1992; Forbes et al., 2006; Howcroft et al., 2009). Biomarkers have the vantage of being sensitive and give an early warning of the toxic impacts to organisms, even before the ecological disturbances can be directly observed. Moreover, an improved correlation between toxic exposure concentrations and biological response is frequently observed.
Biomarkers can be studied at several levels of biological organization. Those at higher levels are supposed to integrate changes occurring at lower levels of organization (cellular or molecular). One of the most important challenges of biomarkers research is to understand the mechanisms of change at a given level and then, to understand whether and how those changes are integrated at the next higher level (Mittler, 2002; Forbes et al., 2006; Ferreira et al., 2010).
Regarding biomarkers classification, they are regularly assembled in three categories: (i) biomarkers of exposure – the interaction of a stressor and a target cell or molecule that is determined in certain partition of an organism, (ii) biomarkers of effect – a change in an organism, , that can be related with a health condition or disease and (iii) biomarkers of susceptibility – a specific response of an organism when exposed to a specific stressor (Huggett et al., 1992; Forbes et al., 2006).
A common consequence of most abiotic and biotic stresses is that they cause, at some stage of exposure, an increase in reactive oxygen species (ROS) (Mittler, 2002), which explains the choice for biomarkers belonging to the antioxidant defense (Figure 3).
10
Figure 3 - Enzymatic pathways involved in xenobiotic biotransformation and antioxidant defenses (adapted from Howcroft et al., 2009). Superoxide dismutase (SOD), lipid peroxidation (LPO), catalase (CAT), glutathione peroxidase (GPx), glutathione reductase (GR) and glutathione S-transferase (GST).
Reactive oxygen species (ROS) are a wide variety of molecules and free radicals formed from molecular oxygen (O2) (Turrens, 2003). During the normal metabolism activity, in
processes as food oxidation, respiration or energy generation, O2 undergoes tetravalent
reduction to water (Turrens, 2003). However, partial reduction of O2 results in the
formation of radical species such as superoxide anion radical (O2 -), which is the precursor
of most ROS (e.g. H2O2, OH-) and plays a role as mediator in oxidative chain reactions
(Turrens, 2003) as depicted in Figure 3. If cells are in their normal healthy state, they are able to eradicate ROS through antioxidant defenses. These antioxidant defenses include water and soluble lipids of low molecular weight, radical scavengers and specific antioxidant enzymes. (Mittler, 2002; Howcroft et al., 2009). Nevertheless, in a scenario with a high increase in ROS generation, antioxidant defenses can be overcome, resulting in oxidative damage to molecules and changes in critical cellular processes, state which is designated as oxidative stress (Mittler, 2002; Forbes et al., 2006; Howcroft et al., 2009; Ferreira et al., 2010). In this work, the following biomarkers belonging to the antioxidant defense were determined: CAT, LPO, and GST. Moreover, other biomarkers commonly used in microalgae were determined, G-Pox, and Ch a and b. Below, we provide an overall description of these biomarkers.
11 Catalase
Catalases (CAT) are hematin-containing enzymes that enhance the removal of H2O2 from
the organism. The main activity of CAT is associated with the peroxisomes that function on the fatty acid metabolism (Huggett et al., 1992). There are evidences that the catalase activity is linked with the activity of glutathione peroxidase (GPx) to act against oxidative stress (Deisseroth and Dounce, 1970). The catalase function can be described by the following:
Guaiacol Peroxidase
Guaiacol Peroxidase (GPOx), differently from CAT, has as reaction products, water and an activated substrate, the tetra-guaiacol (Asada, 1992), as showed by the following:
Guaiacol is a peroxidase that some plants and algae produce. It as a function as substrate in the reduction of H2O2, and is oxidized by the heme co-factor of peroxidases (Amako et al.,
1994). This type of peroxidases are involved in a great number of physiological processes, such as the biosynthesis and degradation of lignin, plant development and response to environmental stress such biotic stress (e.g. pathogen attack) and oxidative damage (Asada, 1992).
Glutathione S-Transferase
The glutathione S-transferase (GST) represents a family of enzymes acting as catalysts for the conjugation of various electrophilic compounds with the tri-peptide glutathione (Armstrong, 1987). They are responsible for the increase in availability of lipophilic toxicants of phase-I enzymes, acting as carrier proteins or by covalently binding to electrophilic compounds themselves reducing the probability of these compounds to bind to other (Armstrong, 1987).
12 Lipid Peroxidation (LPO)
Oxidative stress has a major impact on the oxidation of fatty acids (e.g. polyunsaturated) (Huggett et al., 1992). LPO can react with transition metal complexes, including the phase-I detoxification enzyme – the cytochrome P450 (Huggett et al., 1992). Several studies have verified enhancement of lipid peroxidation in several tissues due to xenobiotics or even as consequence of cellular damage (Song et al., 2010; Wang and Guan, 2010).
Photosynthetic pigments
In higher plants, light photons are captured by chlorophylls (Chl) and carotenoid pigments at the level of the thylakoid membranes in chloroplasts (Taiz and Zeiger, 2010). The photosynthetic pigments have the dual function of absorb energy to allocate for photosynthesis and to protect the photosynthetic apparatus from excess of light (Poynton et al., 2011). If excess of light occur, then a surplus of excited electrons can be produced, overcoming the capacity of the photosynthetic electron transport chain, conducting to the formation of reactive oxygen species (ROS) (Porra, 2006; Brain and Cedergreen, 2009). The use of chlorophylls as an indicator is due to their role during photosynthesis, in collecting solar energy, transforming in chemical energy (Venkatpurwar and Pokharkar, 2011) and reducing agents (NADPH or NADH). The accurate determination of Chl a and b contents and the Chl a/b ratios has been an essential tool in photosynthesis research in higher plants and green algae (Porra, 2006). The formation of ROS via exposure to trace metals is known to indirectly affect pigment synthesis (Pinto et al., 2003). Both chlorophyll and carotenoid content seems to be more sensitive as a stress indicator than the specific growth rate or even biomass (Rai et al., 2004).
1.4 Molecular endpoints at the protein level – Proteomics
The raise of interest on the mechanistic insight to the toxic effects of pollutants in organisms has evolved along with the advances of the molecular approaches (Martyniuk et al., 2012). The application of proteomics technologies for solving ecotoxicological issues resulted in the emergence of a new research field named “ecotoxicoproteomics” (Lemos et al., 2010). The main strengths of this area are the potential to identify early modifications
13
at sub-individual level in response to stressors, thus contributing to characterize their mode of action and to discover specific protein biomarkers (Lemos et al., 2010). The use of omics technologies, including quantitative proteomics methods aims to identify and quantify the dynamics of protein abundance and function, in order to gain a deeper understanding of the current biological demands.
The proteomics approach involves specific methods (Figure 4), namely the classical gel-based quantitative methods (such as two dimensional electrophoresis (2DE) and 2D differential electrophoresis (DIGE)) or the LC-based methods (such as isobaric tagging for relative and absolute quantitation (iTRAQ) (Martyniuk et al., 2012).
Figure 4 - General workflow of proteomic approaches
In the present work we used the iTRAQ methods (Figure 5). This method is based upon tagging the N-terminus of peptides generated from tryptic protein digests, where amine labeled peptides from different samples will have a unique isobaric tag consisting of a reporter and a mass balance (Wang et al., 2012). After cleavage, the relative intensity of reporter tags will yield information on the relative abundance of proteins in each sample,
14
thus retrieving the intensity of reporter ions, which will allow the relative quantification of peptides (Wang et al., 2012). This technique is advantageous because it provides reliable quantification over two orders of magnitude, allows the use of proteins of any biological system, enables the simultaneous comparison of up-to eight samples in just one experiment and increases the precursor ion intensity and reduces the sample complexity (Wang et al., 2012).
1.5 The species sensitivity distributions approach (SSDs)
Several approaches exist to extrapolate effects found at the individual level to effects at the whole community level, being the species sensitivity distributions (SSDs) approach the most applied. The SSDs approach was developed twenty years ago, when policy makers made pressure to researchers to optimize the use of toxicity data retrieved from chemical assays of single-species for derivation of the environmental quality criteria (EQC) (Posthuma et al., 2010), taking in consideration that risks cannot be completely eliminated but can be reduced to an acceptable low level (Newman et al., 2000). It is of common knowledge that organisms belonging to different species have different sensitivities to a certain stressor. This characteristic can be used to derive a distribution function that assumes a proportion of affected species against the concentration of the stressor, which together yields a SSD (Posthuma et al., 2010). The selection of the species set may be formed by species from a specific taxon, a species assemblage, or even a community (Posthuma et al. 2010). The SSD is derived from a set of toxicity data and visualized as a cumulative distribution function (CDF) (Figure 6).
15
The input data to generate the SSD, can be from acute or chronic ecotoxicity tests as E(L)C50 values. Or even values of no-observed-effect concentrations (NOECs). As convention the complementary p value of the 95% percentile is used to define the protective concentration of the stressor (Posthuma et al. 2010), which is designated as the hazard concentration that affect 5% of the species (HC5) (Rodrigues et al., 2013).
Figure 5 - iTRAQ permits the relative quantification of peptides and proteins. Both identification and quantification of peptides occurs in the MS/MS scan. Comparing the peak intensities of the iTRAQ reporter ions leads to quantification (Meyer et al., 2010).
16
Figure 6 - A typical general SSDs, expressed as a CDF. The dots represent the input data (Posthuma et al., 2010).
1.6 Quantitative structure–activity relationships (QSARs)
In order to speed up the process of chemical regulation, save resources and reduce animal testing, the EU Registration system through the Evaluation, Authorization and Restriction of Chemicals (REACH) promotes the use of in silico-derived data to assess health and environmental risks associated with chemical exposure (Sahlin, 2013). Quantitative structure–activity relationships (QSARs) are being used as an alternative method of in vivo testing, where a mathematic model (parametric or non-parametric) is used to relate a set of quantitative descriptors of a chemical stressor (i.e. its physico-chemical properties) with quantitative descriptors of biological activity (Walker et al., 2003). The main purpose of QSAR methods is to identify and rationalize the involved pathways behind the mode of action of a series of chemicals and thus extrapolate for a major chemical class that shares the same physico-chemical descriptors. Ideally the QSAR models should fulfill the requirements of the OECD guidelines: (i) use of a defined endpoint (ii) described by an explicit algorithm (iii) having a distinct domain of applicability (iv) providing an appropriate measure of goodness‐of‐fit, robustness and predictivity (v) when possible give a mechanistic interpretation (OECD, 2007). Comparatively to organic and bulk chemicals, engineered nanomaterials (ENMs) renders singular properties that impose some limitations in the application of nano-QSARs. Some are related with ENMs characterization, where several methodologies and equipment’s are employed, resulting in a poly-dispersive
17
amount of data, that needs special interpretation to make part of the physico-chemical descriptors.
The golden rule for a first approach to nano-QSARs is to limit our dataset to a highly studied nanomaterial (e.g. silver nanoparticles) and restrict to class of organisms (e.g. bacteria), and then use the gained knowledge to apply to other organism classes.
18
1.7 Objectives and thesis outline
The main goal of this thesis was to evaluate the effects of silver nanoparticles to freshwater organisms at different levels of organization, from sub-individual and sub-cellular endpoints, to individual and extrapolating to the community level effects. At the sub-individual and sub-cellular levels we studied the biochemical and protein expression responses in Chlamydomonas reinhardtii. Concerning the individual levels we studied the effects of AgNPs on the growth of the microalgae Pseudokirchneriella subcapitata and the effects on the growth and reproduction of the crustacean Daphnia magna exposed to AgNPs via water or the diet. Finally, to extrapolate the effects of AgNPs from the individual to the whole community level we used the SSD approach.
To attain the main goal, the work was divided into the following studies:
I. “General introduction”, presenting and putting in context concepts and methodologies used during the experimental work;
II. “Biochemical and protein expression responses in Chlamydomonas reinhardtii to silver nanoparticles exposure”;
III. “Chronic effects of silver nanoparticles to Daphnia magna: aqueous and dietary exposure”;
IV. “Silver nanoparticles toxicity: species sensitivity distributions and general trends”; V. “General Discussion and Final Remarks”.
Contribution to the current field of studies
This dissertation produces relevant work on the field of Ecotoxicology and Environmental Toxicology, in particular in some overlooked aspects:
the biochemical and protein expression of microalgae in the exposure to AgNPs, which can be useful in the assessment of the mode of action and mediated toxicity of AgNPs to microalgae;
the effects of AgNPs to the crustacean D. magna, concerning dietary exposure; the effects of AgNPs to aquatic organisms at the community level.
19
References
Amako, K., Chen, G.-X., Asada, K., 1994. Separate Assays Specific for Ascorbate Peroxidase and Guaiacol Peroxidase and for the Chloroplastic and Cytosolic Isozymes of Ascorbate Peroxidase in Plants. Plant and Cell Physiology 35, 497-504.
Armstrong, R.N., 1987. Enzyme-catalyzed detoxication reactions: mechanisms and stereochemistry. CRC critical reviews in biochemistry 22, 39-88.
Asada, K., 1992. Ascorbate peroxidase–a hydrogen peroxide‐scavenging enzyme in plants. Physiol. Plant. 85, 235-241.
Bondarenko, O., Juganson, K., Ivask, A., Kasemets, K., Mortimer, M., Kahru, A., 2013. Toxicity of Ag, CuO and ZnO nanoparticles to selected environmentally relevant test organisms and mammalian cells in vitro: A critical review. Archives of Toxicology 87, 1181-1200.
Bouillard, J.X., R’Mili, B., Moranviller, D., Vignes, A., Le Bihan, O., Ustache, A., Bomfim, J.A., Frejafon, E., Fleury, D., 2013. Nanosafety by design: risks from nanocomposite/nanowaste combustion. Journal of Nanoparticle Research 15, 1-11.
Brain, R., Cedergreen, N., 2009. Biomarkers in Aquatic Plants: Selection and Utility. in: Whitacre, D. (Ed.). Reviews of Environmental Contamination and Toxicology. Springer New York, pp. 49-109.
Contreras, L., Moenne, A., Gaillard, F., Potin, P., Correa, J.A., 2010. Proteomic analysis and identification of copper stress-regulated proteins in the marine alga Scytosiphon gracilis (Phaeophyceae). Aquat. Toxicol. 96, 85-89.
Deisseroth, A., Dounce, A.L., 1970. Catalase: Physical and chemical properties, mechanism of catalysis, and physiological role. Physiological Reviews 50, 319-375.
Edwards, S.A., 2007. The Promise of Nanotechnology. The Nanotech Pioneers. Wiley-VCH Verlag GmbH & Co. KGaA, pp. 1-14.
El Badawy, A.M., Silva, R.G., Morris, B., Scheckel, K.G., Suidan, M.T., Tolaymat, T.M., 2011. Surface Charge-Dependent Toxicity of Silver Nanoparticles. Environmental Science & Technology 45, 283-287.
20
Fabrega, J., Luoma, S.N., Tyler, C.R., Galloway, T.S., Lead, J.R., 2011. Silver nanoparticles: Behaviour and effects in the aquatic environment. Environment International 37, 517-531.
Ferreira, N.G.C., Santos, M.J.G., Domingues, I., Calhôa, C.F., Monteiro, M., Amorim, M.J.B., Soares, A.M.V.M., Loureiro, S., 2010. Basal levels of enzymatic biomarkers and energy reserves in Porcellionides pruinosus. Soil Biology and Biochemistry 42, 2128-2136.
Forbes, V.E., Palmqvist, A., Bach, L., 2006. The use and misuse of biomarkers in ecotoxicology. Environmental Toxicology and Chemistry 25, 272-280.
Gottschalk, F., Sonderer, T., Scholz, R.W., Nowack, B., 2009. Modeled environmental concentrations of engineered nanomaterials (TiO2, ZnO, Ag, CNT, fullerenes) for different regions. Environmental Science & Technology 43, 9216-9222.
Handy, R.D., Owen, R., Valsami-Jones, E., 2008. The ecotoxicology of nanoparticles and nanomaterials: current status, knowledge gaps, challenges, and future needs. Ecotoxicology 17, 315-325.
Hogstrand, C., Wood, C.M., 1998. Toward a better understanding of the bioavailability, physiology, and toxicity of silver in fish: implications for water quality criteria. Environmental toxicology and chemistry 17, 547-561.
Howcroft, C.F., Amorim, M.J.B., Gravato, C., Guilhermino, L., Soares, A.M.V.M., 2009. Effects of natural and chemical stressors on Enchytraeus albidus: Can oxidative stress parameters be used as fast screening tools for the assessment of different stress impacts in soils? Environment International 35, 318-324.
Huggett, R.J., Kimerle, R., Mehrle Jr, P., Bergman, H.L., 1992. Biomarkers: biochemical, physiological, and histological markers of anthropogenic stress. Lewis publishers Boca Raton, FL.
ISO, 2010. International Organisation for Standardisation: Nanotechnologies - Vocabulary. In Core terms. Geneva.
Lemos, M.F.L., Soares, A.M.V.M., Correia, A.C., Esteves, A.C., 2010. Proteins in ecotoxicology - How, why and why not? Proteomics 10, 873-887.
21
Levard, C., Hotze, E.M., Lowry, G.V., Brown, G.E., 2012. Environmental transformations of silver nanoparticles: Impact on stability and toxicity. Environmental Science and Technology 46, 6900-6914.
Luoma, S.N., 2008. Silver Nanotechnologies and the Environment: Old Problems or New Challenges?
Ma, R., Levard, C., Marinakos, S.M., Cheng, Y., Liu, J., Michel, F.M., Brown, G.E., Lowry, G.V., 2012. Size-controlled dissolution of organic-coated silver nanoparticles. Environmental Science and Technology 46, 752-759.
Marcoux, M.A., Matias, M., Olivier, F., Keck, G., 2013. Review and prospect of emerging contaminants in waste - Key issues and challenges linked to their presence in waste treatment schemes: General aspects and focus on nanoparticles. Waste Management.
Martyniuk, C.J., Alvarez, S., Denslow, N.D., 2012. DIGE and iTRAQ as biomarker discovery tools in aquatic toxicology. Ecotoxicology and Environmental Safety 76, 3-10.
Meyer, J.N., Lord, C.A., Yang, X.Y., Turner, E.A., Badireddy, A.R., Marinakos, S.M., Chilkoti, A., Wiesner, M.R., Auffan, M., 2010. Intracellular uptake and associated toxicity of silver nanoparticles in Caenorhabditis elegans. Aquat Toxicol 100, 140-150.
Mittler, R., 2002. Oxidative stress, antioxidants and stress tolerance. Trends in plant science 7, 405-410.
Mueller, N.C., Nowack, B., Wang, J., Ulrich, A., Buha, J., 2012. Nanomaterials in waste incineration and landfills. Internal Empa-report.
Musee, N., 2011. Nanowastes and the environment: Potential new waste management paradigm. Environment International 37, 112-128.
Nanowerk Nanomaterial Database Inventory.
Newman, M.C., Ownby, D.R., Mezin, L.C., Powell, D.C., Christensen, T.R., Lerberg, S.B., Anderson, B.A., 2000. Applying species‐sensitivity distributions in ecological risk assessment: Assumptions of distribution type and sufficient numbers of species. Environmental Toxicology and Chemistry 19, 508-515.
Nowack, B., Krug, H.F., Height, M., 2011. 120 Years of Nanosilver History: Implications for Policy Makers. Environmental Science & Technology 45, 1177-1183.
22
Nowrouzi, A., Meghrazi, K., Golmohammadi, T., Golestani, A., Ahmadian, S., Shafiezadeh, M., Shajary, Z., Khaghani, S., Amiri, A.N., 2010. Cytotoxicity of subtoxic AgNP in human hepatoma cell line (HepG2) after long-term exposure. Iranian biomedical journal 14, 23-32.
OECD, 2007. Guidance Document on the Validation of (Quantitative) Structure– Activity Relationships Models. Organization for Economic Co‐operation and Development
Piccinno, F., Gottschalk, F., Seeger, S., Nowack, B., 2012. Industrial production quantities and uses of ten engineered nanomaterials in Europe and the world. Journal of Nanoparticle Research 14, 1-11.
Pinto, E., Sigaud-kutner, T., Leitao, M., Okamoto, O., Morse, D., Colepicolo, P., 2003. Heavy metal-induced oxidative stress in algae. J. Phycol. 39, 1008 - 1018.
Porra, R.J., 2006. Spectrometric Assays for Plant, Algal and Bacterial Chlorophylls. in: Grimm, B., Porra, R.J., Rüdiger, W., Scheer, H. (Eds.). Chlorophylls and Bacteriochlorophylls. Springer Netherlands, pp. 95-107.
Posthuma, L., Suter II, G.W., Traas, T.P., 2010. Species sensitivity distributions in ecotoxicology. CRC Press.
Poynton, H.C., Lazorchak, J.M., Impellitteri, C.A., Smith, M.E., Rogers, K., Patra, M., Hammer, K.A., Allen, H.J., Vulpe, C.D., 2011. Differential gene expression in Daphnia
magna suggests distinct modes of action and bioavailability for ZnO nanoparticles and Zn
ions. Environ Sci Technol 45, 762-768.
Quik, J.T.K., Vonk, J.A., Hansen, S.F., Baun, A., Van De Meent, D., 2011. How to assess exposure of aquatic organisms to manufactured nanoparticles? Environment International 37, 1068-1077.
Rai, V., Vajpayee, P., Singh, S.N., Mehrotra, S., 2004. Effect of chromium accumulation on photosynthetic pigments, oxidative stress defense system, nitrate reduction, proline level and eugenol content of Ocimum tenuiflorum L. Plant Sci. 167, 1159-1169.
Rodrigues, A.C., Jesus, F.T., Fernandes, M.A., Morgado, F., Soares, A.M., Abreu, S.N., 2013. Mercury toxicity to freshwater organisms: extrapolation using species sensitivity distribution. Bull Environ Contam Toxicol 91, 191-196.
23
Sahlin, U., 2013. Uncertainty in QSAR predictions. Alternatives to laboratory animals : ATLA 41, 111-125.
Song, W., Zhang, J., Guo, J., Zhang, J., Ding, F., Li, L., Sun, Z., 2010. Role of the dissolved zinc ion and reactive oxygen species in cytotoxicity of ZnO nanoparticles. Toxicol Lett 199, 389-397.
Sotiriou, G.A., Pratsinis, S.E., 2010. Antibacterial activity of nanosilver ions and particles. Environmental science & technology 44, 5649-5654.
Taiz, L., Zeiger, E., 2010. Plant Physiology. Sinauer Associates, Incorporated.
Turrens, J.F., 2003. Mitochondrial formation of reactive oxygen species. The Journal of Physiology 552, 335-344.
Venkatpurwar, V., Pokharkar, V., 2011. Green synthesis of silver nanoparticles using marine polysaccharide: Study of in-vitro antibacterial activity. Materials Letters 65, 999-1002.
Walker, J.D., Jaworska, J., Comber, M.H.I., Schultz, T.W., Dearden, J.C., 2003. Guidelines for developing and using quantitative structure-activity relationships. Environmental Toxicology and Chemistry 22, 1653-1665.
Walser, T., Limbach, L.K., Brogioli, R., Erismann, E., Flamigni, L., Hattendorf, B., Juchli, M., Krumeich, F., Ludwig, C., Prikopsky, K., 2012. Persistence of engineered nanoparticles in a municipal solid-waste incineration plant. Nature Nanotechnology 7, 520-524.
Wang, H., Alvarez, S., Hicks, L.M., 2012. Comprehensive comparison of iTRAQ and label-free LC-based quantitative proteomics approaches using two Chlamydomonas reinhardtii strains of interest for biofuels engineering. J Proteome Res 11, 487-501.
Wang, W.X., Guan, R., 2010. Subcellular distribution of zinc in Daphnia magna and implication for toxicity. Environmental toxicology and chemistry / SETAC 29, 1841-1848.
Woodrow Wilson International Centre for Scholars, 2011. A nanotechnology consumer products inventory Project on Emerging Nanotechnologies.
Yu, S.-j., Yin, Y.-g., Liu, J.-f., 2013. Silver nanoparticles in the environment. Environmental Science: Processes & Impacts 15, 78-92.
24
CHAPTER II: Biochemical and protein expression
responses in Chlamydomonas reinhardtii to silver
25
Biochemical and protein expression responses in Chlamydomonas
reinhardtii to silver nanoparticles exposure
Marco Fernandes1, Virgínia Carvalhais2,3, Rhaul Oliveira1 Rui Vitorino2, António J.A. Nogueira1 and Francisco Amado2
1
CESAM & Department of Biology, University of Aveiro, 3810-193 Aveiro, Portugal
2
QOPNA, Department of Chemistry, University of Aveiro, Aveiro, Portugal
3
IBB - Institute for Biotechnology and Bioengineering, Centre of Biological Engineering, University of Minho, Braga, Portugal
Corresponding author: [email protected]
Abstract
Silver nanoparticles (AgNPs) are one of the most used nanomaterials in industrial products. However, little is known about the cellular and molecular effects of AgNPs to aquatic biota, in particular microalgae. The main goal of this study was to assess the toxicity of AgNPs to the microalgae Chlamydomonas reinhardtii at the phenotypic, biochemical and molecular levels. Furthermore the toxicity of two sizes (10 and 80 nm) of AgNPs was compared. C. reinhardtii was exposed to citrate coated AgNPs (10 and 80 nm) during 72 h. After this period the following endpoints were assessed: growth rate (GR), activity of oxidative stress enzymes, content of photosynthetic pigments and proteomic analysis of differential protein expression. The GR of C. reinhardtii declined after exposure to 10 and 80 nm AgNPs and followed a dose-response trend. However, the toxicity of small AgNPs was higher than that of large AgNPs: 72h-EC50: 221.2±16.3 and
2508.2±282.8 µg/L, respectively. At sub-inhibitory concentrations, oxidative stress biomarkers detected modifications at low dose levels as 5µg/L, in AgNPs of 10 nm, for the chlorophylls content and glutathione S-transferase activity.
26
Taking in consideration the proteome response of C. reinhardtii to the AgNPs exposure, we found a great number of down-regulated proteins across all treatments. There are evidences that 80 nm AgNPs are more related in terms of quantitative protein response to the silver ion (Ag+) treatment (added as positive control). We hypothesized that toxicity of AgNPs may be driven mostly by dissolution than by size-related effects.
Keywords: silver nanoparticles, toxicity, C. reinhardtii, oxidative-stress biomarkers, proteomics
27
Introduction
Nanotechnology soon delivered the promise of revolutionizes the technology field, bringing to light new and exotic materials and products; however a growing gap between the evaluation of the possible impacts to human health and environment and their continuous design and commercialization rise.
Silver nanoparticles (AgNPs) are particles with at least one external dimension in a size range of 1–100 nm (Nowack et al., 2011). Presently is the most common engineered nanoparticle with a worldwide estimated production of 320 tons/year (Nowack et al., 2011), where there is a continuous increase in their production and application in several areas including consumer products, food technology, textiles, as well as medical products and devices (Yu et al., 2013). This rapid growth in their commercial use raised concern on their increase in exposure into the environment (Yu et al., 2013).
AgNPs can cause deleterious effects on bacteria, fungi, microalgae, crustaceans, fish and plants (Yu et al., 2013). However, crustaceans, microalgae and fish are considered the taxa fraction more affected (Bondarenko et al., 2013). Presently, there is no universal agreement on the toxicity mechanisms of AgNPs, whereas several modes of action are proposed for the antibacterial activity, involving generation of reactive oxygen species (ROS), attachment and disruption of cell membrane, changes in membrane permeability, protein interaction and interference with DNA replication (Levard et al., 2012; Levard et al., 2013; Yu et al., 2013). Moreover, there is evidence in plants, that AgNPs can induce cell death, genotoxicity and cause DNA damage by the generation of ROS (Panda et al., 2011). Additionally, the known highly reactivity of AgNPs with hydrogen peroxide (H2O2) can
lead to the formation of OH radicals (Lubick, 2008). Thus, biomarkers of oxidative stress are suitable to be used to evaluate early stress responses at sub-inhibitory AgNPs concentrations and consequently give insights on its mechanism of toxicity (van der Oost et al., 2003). The glutathione-S- transferase (GST) is an enzyme involved in the detoxification of xenobiotics (Oruç and Üner, 2000). Catalase (CAT) acts against oxidative stress, enhancing the H2O2 removal from the organism. (Barata et al., 2005). Guaiacol is a
peroxidase (GPOx) that some plants and algae produce. It as a function in the reduction of H2O2, and is oxidized by the heme co-factor of peroxidases (Amako et al., 1994).
28
Lipid Peroxidases (LPO) can react with transition metal complexes, as cytochrome P450 (Huggett et al., 1992). Several studies have reported promoted of lipid peroxidation due to xenobiotics or even as consequence of cellular damage (Song et al., 2010; Wang and Guan, 2010). The ROS formation through exposure to trace metals is known to indirectly affect pigment synthesis (Pinto et al., 2003), therefore chlorophyll content can be used as a stress indicator (Rai et al., 2004).
High-throughput technologies such as mass spectrometry can provide an in-deep evaluation of the health status of an organism or even a community, and auxiliary in the elucidation of a particular mode of action of a chemical stressor (Lemos et al., 2010).
The aim of this study was to evaluate using both phenotypic, biochemical and molecular endpoints the toxicity of two sizes of citrate coated AgNPs (10 and 80 nm) to the microalgae Chlamydomonas reinhardtii.
29
Material and methods
2.1 Reagents
All reagents were supplied by Sigma-Aldrich (St. Louis, MO, USA) with the highest degree of purity available, unless otherwise stated. The iTRAQ Reagent-8Plex kit was supplied by Applied Biosystems (Foster City, CA, USA). Citrate coated silver nanoparticles with sizes of 10 and 80 nm (nominal size provided by manufacturer) were acquired from NanoComposix with a stock concentration of 20 mg L-1.
2.2 Nanoparticles characterization
STEM pictures
STEM (HR-FESEM Hitachi SU-70, Hitachi High-Tech) operating at 30.0 kV was used to visualize particle size, shape and aggregation state in samples of nanoparticles suspensions. Prepared suspensions of AgNPs in Woods Hole MBL medium (Stein and Hellebust, 1980) at 1.0 mg/L were left to settle for 24 h and then placed on a copper grid support for posterior visualization. Individual measurements of particles diameter were made in ImageJ (v1.47, NIH) for 153 (10 nm) and 294 (80 nm) particles.
Dynamic light scattering (DLS)
Particle size distribution was determined by dynamic light scattering (DLS) using a Zetasizer Nanoseries (Malvern Instruments, USA) with a 633-nm laser source and a detection angle of 173º (capable of detect particles from 1 nm to 10 mm). Measurements were conducted using a 1 ml sample deposited in a disposable polystyrene cuvette. Zeta potential was measured using a disposable electrophoretic flow-through cell with an internal volume of approximately 0.9 ml. These measurements were performed in MBL medium at 1 mg/l of AgNPs. In order to determine AgNPs changes over time we performed these measurements after 1, 24, 48 and 72 h of exposure.
30 Microalgae culture conditions
C. reinhardtii was cultured in unialgal batch cultures with sterilized Woods Hole MBL
medium (Stein and Hellebust, 1980) at 20±1 ºC, under continuous and uniform cool-white light (4000 lux) and continuous aeration.
2.3. Microalgae assays
Two independent assays were performed with C. reinhardtii: (a) exposure to both 10 and 80 nm AgNPs for the determination of the growth inhibition; (b) exposure to sub-inhibitory AgNPs concentrations (derived from a), in order to assess stress biomarkers and protein expression profiles.
(a) The algae growth inhibition tests were based on the OECD guideline 201 with an adaptation for 24 wells microplates (OECD, 2006). Tests started with 1.0×10E4 cells/ml (in log exponential growth phase) in MBL medium and carried out at 24±1 ºC for 72 with the same light cycle and luminous flux of the culture conditions. Range finding assays were indicative of a great difference of sensitivities between 10 and 80 nm AgNPs. Therefore different concentrations intervals were chosen for AgNPs exposures: 75 – 500 µg/L (10 nm) and 75 – 2500 µg/L (80 nm). Cell density was determined by optical density (OD) at 440 nm (Jenway 6505 UV/Visible spectrophotometer, UK) and converted to cell number employing the linear regression model previously developed for this specie (Cells/ml = 7.0E6×OD – 3.0E4; r2
=0.986).
(b) The same conditions were applied as in (a) but in this case assays ran in 10% pre-saturated (relatively to the exposure concentrations) 50 mL glass vials with AgNPs and were incubated in an orbital shaker at 150 rpm. C. reinhardtii with 5.0×10E4 cells/ml (in log exponential growth phase) was exposed in triplicate to 2 – 80 µg/L (10 nm) and 31 – 1200 µg/L (80 nm) AgNPs. At the end of the exposure period of 72 h, cell density was determined (as described above) and samples were harvested by centrifugation for 10 min at 3000×g and 4 ºC. Then the pellet was immediately frozen in liquid nitrogen and stored at −80 °C until biomarkers and protein analyses.
31 2.4. Biomarkers
On the day of enzymatic analyses, samples were defrosted on ice, homogenized at 4 °C in 1 ml of K-phosphate buffer 0.05 M (pH 7.8) containing 0.2% (v/v) Triton X-100 according to Olmos et al. (1994) using a sonicator (KIKA Labortechnik U2005 ControlTM) and centrifuged for 20 min at 10,000×g to separate the post-mitochondrial supernatant (PMS) (Howcroft et al., 2011). Enzymatic determinations were made spectrophotometrically (Thermo Scientific Multiskan Spectrum) using 96 wells microplates. Enzymatic activity was determined in quadruplicate and expressed as nanomoles of substrate hydrolysed per minute per mg of protein. Protein concentration was determined by the Bradford method (Bradford, 1976), at 595 nm, using γ-globulin as a standard.
Catalase (CAT)
CAT activity, using 15 μl of PMS was measured at 240 nm by monitoring (for 3 min) the decrease in absorbance due to degradation of H2O2, as described by
Claiborne (1985).
Guaiacol peroxidase (GPOx)
GPOx activity, using 25 μL of PMS was measured using a method described by Cakmak and Marschner (1992) with minor modifications. Briefly, a reaction mixture consisting of 17 mM H2O2 and 2% guaiacol was assayed for 10 min and
the activity was measured as the appearance of tetra-guaiacol at λ = 470 nm.
Lipid peroxidase (LPO)
The level of lipid peroxidation products was assayed following the method described by Heath and Packer (1968) with some modifications by measuring thiobarbituric acid-reactive substances (TBARS). The reaction included a mixture of 300 μl homogenized sample, 1 mL trichloroacetic acid sodium salt (TCA) 12% (w/v), 1 mL 2-thiobarbituric acid 0.73% (w/v) and 800 μl Tris–HCl 60 mM with diethylenetriaminepentaacetic acid (DTPA) 0.1 mM. The reaction mixture was then incubated at 100 °C in a water bath for 1 h. After, quickly cooled down in an ice
32
bath, samples were centrifuged for 10 min at 10,000×g. The absorbance of the supernatant was read at 532 nm and was applied a correction for unspecific turbidity by subtracting the absorbance measured at 600 nm. LPO was expressed as nmol TBARS hydrolysed per minute per mg of protein.
Glutathione S-Transferase (GST)
GST activity, using 100 μl of PMS was determined at 340 nm by monitoring the increase in absorbance (for 5 min) following the general methodology described by (Habig et al., 1974) with modifications introduced by Frasco and Guilhermino (2002). Activity determinations were made using sample and 200 μl of the reaction mixture (10 mM reduced glutathione and 60 mM 1-chloro- 2.4-dinitrobenzene in K-phosphate buffer (100 mM, pH 6.5).
Pigment extraction and quantification
Samples were sonicated with an ultrasonic probe at level 5 to 6 (50–60 W) for 20s (Branson Sonifier-450) in 80 % acetone in an ice bath. Then samples were centrifuged for 10 min at 3000×g and 4 ºC. After centrifugation, the supernatant was immediately used for pigment quantification (Schagerl and Kunzl, 2007). Chl a and b absorbance’s (Abs) were determined spectrophotometry (Jenway 6505 UV/Visible spectrophotometer, UK) at 663, 646 and 647 nm, and Chl a and b concentrations were derived by the following equations: [Chl a (µg/mL)] = 12.25 × Abs(663) – 2.55 × Abs(647); [Chl b (µg/mL)] = 20.31 × Abs(646) – 4.91 × Abs(663) (Porra et al., 1989).