Energy Efficiency
Natural Ventilation and Indoor Air Quality in Educational Buildings: Experimental
Assessment and Improvement Strategies
--Manuscript Draft--Manuscript Number:
Full Title: Natural Ventilation and Indoor Air Quality in Educational Buildings: Experimental
Assessment and Improvement Strategies
Article Type: Original Research
Keywords: air permeability; air change rate; classrooms; indoor air quality (IAQ); indoor
environmental quality (IEQ); natural ventilation
Corresponding Author: Ricardo Almeida, Ph.D.
Instituto Politecnico de Viseu Viseu, PORTUGAL
Corresponding Author Secondary Information:
Corresponding Author's Institution: Instituto Politecnico de Viseu Corresponding Author's Secondary
Institution:
First Author: Ricardo Almeida, Ph.D.
First Author Secondary Information:
Order of Authors: Ricardo Almeida, Ph.D.
Manuel Pinto Paulo Pinho Luís Lemos Order of Authors Secondary Information:
Funding Information:
Abstract: Indoor environmental conditions in classrooms, in particular temperature and indoor air
quality, influence students' health, attitude and performance. In recent years several studies regarding indoor environmental quality of classrooms were published and natural ventilation proved to have great potential, particularly in southern European climate. This research aimed to evaluate indoor environmental conditions in 8 schools and to assess their improvement potential by simple natural ventilation strategies. Temperature, relative humidity and carbon dioxide concentration were measured in 32 classrooms. Ventilation performance of the classrooms was deeply characterized, first by fan pressurization measurements of the air permeability and later by tracer gas measurements of the air change rate assuming different envelope conditions. A total of 110 tracer gas measurements were made and the results validated ventilation
protocols that were tested afterward. The results of the ventilation protocol
implementation were encouraging and, overall, a decrease on the CO2 concentration was observed without modifying the comfort conditions.
Suggested Reviewers: Despoina Teli
University of Southampton D.Teli@soton.ac.uk Expert in the field. Valeria De Giuli
econcei@ualg.pt Expert in the area
Natural Ventilation and Indoor Air Quality in Educational Buildings:
Experimental Assessment and Improvement Strategies
Ricardo M. S. F. Almeida (1) *, Manuel Pinto (1), Paulo G. Pinho (2), Luís T. de Lemos (2)
(1) Polytechnic Institute of Viseu, School of Technology and Management,
Department of Civil Engineering, Campus Politécnico de Repeses, 3504-510 Viseu, Portugal.
(2) Polytechnic Institute of Viseu, School of Technology and Management, Centro
de Estudos em Educação, Tecnologias e Saúde - CI&DETS, 3504-510 Viseu, Portugal.
*Corresponding author:
E-mail: ralmeida@estv.ipv.pt, Tel: +351 232480500, Fax: +351 232424651
Natural Ventilation and Indoor Air Quality in Educational Buildings:
Experimental Assessment and Improvement Strategies
ABSTRACT
Indoor environmental conditions in classrooms, in particular temperature and indoor air quality, influence students’ health, attitude and performance. In recent years several studies regarding indoor environmental quality of classrooms were published and natural ventilation proved to have great potential, particularly in southern European climate. This research aimed to evaluate indoor environmental conditions in 8 schools and to assess their improvement potential by simple natural ventilation strategies. Temperature, relative humidity and carbon dioxide concentration were measured in 32 classrooms. Ventilation performance of the classrooms was deeply characterized, first by fan pressurization measurements of the air permeability and later by tracer gas measurements of the air change rate assuming different envelope conditions. A total of 110 tracer gas measurements were made and the results validated ventilation protocols that were tested afterward. The results of the ventilation protocol implementation were encouraging and, overall, a decrease on the CO2 concentration was
observed without modifying the comfort conditions.
KEYWORDS: air permeability; air change rate; classrooms; indoor air quality (IAQ); indoor environmental quality (IEQ); natural ventilation.
Blinded Manuscript
Click here to view linked References
1 2 3 4 5 6 7 8 9 10 11 12 13 14 15 16 17 18 19 20 21 22 23 24 25 26 27 28 29 30 31 32 33 34 35 36 37 38 39 40 41 42 43 44 45 46 47 48 49 50 51 52 53 54 55 56 57 58 59
All authors contributed equally in the preparation of this manuscript.
This research received no specific grant from any funding agency in the public, commercial, or not-for-profit sectors.
Nomenclature
h height of a window, [cm]
max maximum
min minimum
n air flow exponent, [-]
n50 air change rate at 50 Pa, [h-1]
p pressure, [Pa]
r correlation, [%]
w width of a window, [cm]
wv wind velocity, [m/s]
A area, [m2]
ACH air change rate, [h-1]
CO2 carbon dioxide
HVAC heating, ventilation and air conditioning
IAQ indoor air quality
IEQ indoor environmental quality
MV mechanical ventilation
N sample size
NV natural ventilation
NVP no ventilation protocol
PMV predicted mean vote
RH relative humidity, [%] T temperature, [ºC] VP ventilation protocol Greek symbols difference standard deviation mean Subscripts av average ext exterior int interior
occ period of occupation
1 INTRODUCTION
In recent years several studies evaluating the effects of the classrooms environmental conditions on the learning process were published (Shendell et al. 2004; Mendell and Heath 2005; Wargocki and Wyon 2007; Bakó-Biró et al. 2012; De Giuli et al. 2012). It seems clear
1 2 3 4 5 6 7 8 9 10 11 12 13 14 15 16 17 18 19 20 21 22 23 24 25 26 27 28 29 30 31 32 33 34 35 36 37 38 39 40 41 42 43 44 45 46 47 48 49 50 51 52 53 54 55 56 57 58 59
influence students’ health, attitude and performance. Knowing that children spend a large amount of their time inside school buildings and that they are more susceptible than adults to the adverse effects of indoor pollutants, since their ratio of air breathed volume versus weight is greater and their tissues and organs are still growing (WHO 2005), school buildings construction and rehabilitation must be properly planned to ensure that users have the adequate conditions for carrying out their work.
1.1 Air quality and hygrothermal comfort in schools
Generally, if exterior air quality is acceptable, a good IEQ can be achieved by adequate ventilation. Buildings ventilation systems designers should identify sources and pathways of air contamination in order to guarantee their efficient removal to the exterior, preferably, actuating near the source, avoiding indoor air contamination.
In terms of classrooms IAQ, CO2 is the most important air contaminant, since it is a product
of respiration and school buildings typically maintain high levels of occupancy during large periods of the day. Hence, CO2 concentration is currently adopted by the most relevant
international regulations and standards as a key parameter for IAQ evaluation (Al-Rashidi et al. 2012). CO2 is a colourless, odourless, tasteless and non-inflammable gas. It is a natural
constituent of the atmosphere with a concentration of around 380 ppm (0.68 g/m3), in a non-polluted area. Usually, CO2 concentration in buildings is very low and, therefore, harmless.
However, in high concentrations, which can occur in classrooms due to their high occupancy and low levels of ventilation, CO2 can cause breathing problems, difficulty in concentration and
headaches (Satish et al. 2012).
Table 1 shows the IAQ limits (outdoor air, CO2 concentration and air change rate (ACH))
for classrooms from some international standards and national regulations. These values were obtained considering a typical Portuguese classroom situation with 25 occupants, a floor area
1 2 3 4 5 6 7 8 9 10 11 12 13 14 15 16 17 18 19 20 21 22 23 24 25 26 27 28 29 30 31 32 33 34 35 36 37 38 39 40 41 42 43 44 45 46 47 48 49 50 51 52 53 54 55 56 57 58 59
of 50 m2 and an internal height of 3 m, corresponding to a volume of 150 m3. However, the
concept of typical classroom varies from country to country, which may help explain the differences in Table 1.
Table 1 - IAQ requirements in classrooms. Country [Standard or regulation] Outdoor air [m3/h] CO2 concentration [ppm] ACH [h-1] Portugal [RECS (2013)] 600 1250 4.0 United Kingdom [Building Bulletin 101 (2006)] 450* 1500** 3.0 Germany [DIN1946-2 (2005)] 500 1500 3.3 Finland
[National Building Code – Part D2 (2010)] 540 1200 3.6
France
[Règlement Sanitaire Départmental Type (2004)] 375 to 450 2.5 - 3.0 USA
[ASHRAE 62.1 (2013)] 558 700*** 3.7
Europe
[EN 15251 (2007)]**** 756 500*** 5.0
*daily mean; imposes the possibility to achieve 720 m3/h; for naturally ventilated classrooms, minimum ventilation is 270 m3/h
** daily mean; imposes the possibility to achieve 1000 ppm; ***maximum concentration above outdoor air levels;
****value for class II (normal level of expectation - new buildings and renovations).
Several studies stated that, frequently, ventilation rate and CO2 concentration limits are
not complied with, regardless of the ventilation system. In Portugal, 76 classrooms of 11 naturally ventilated school buildings (primary and secondary) were monitored in order to evaluate any relationship between IAQ and teachers’ health problems. Temperature and relative humidity were measured over a one year period; indoor air spot samples were analysed and a detailed questionnaire was filled by teachers (N = 177) for health problems identification. Mean CO2 concentration was 1100 ppm with a maximum value of 1713 ppm. A statistically
significant correlation between central nervous system problems and CO2 concentration levels
was confirmed (Madureira et al. 2009). Shaughnessy et al. (Haverinen-Shaughnessy et al. 2011), with a sample of 104 US schools (fifth-grade classrooms), verified that 87 of them had
1 2 3 4 5 6 7 8 9 10 11 12 13 14 15 16 17 18 19 20 21 22 23 24 25 26 27 28 29 30 31 32 33 34 35 36 37 38 39 40 41 42 43 44 45 46 47 48 49 50 51 52 53 54 55 56 57 58 59
ventilation rates below recommended guidelines based on ASHRAE Standard 62.1 (ASHRAE 2013). All the schools had heating, ventilation and air conditioning (HVAC) systems operating with fans in the ‘on’ position during the monitoring period. The experimental period corresponded to winter and spring. Windows and doors were kept closed during the occupation period of the classrooms and the maximum CO2 concentration varied between 661 and
6000 ppm with a mean value of 1779 ppm. Recently 310 schools and day-care centers distributed in all regions of France were studied(Ramalho et al. 2013). Three air pollutants, including CO2, were measured for 2 weeks and throughout a total period of one year. In the
occupied period, the median CO2 level was 1200 ppm in winter and 960 ppm in summer. In
10% of classrooms, levels above 4000 ppm were measured. The sample included buildings with and without specific ventilation system. The global results showed that air change rates are higher (and the CO2 level is lower) when a specific ventilation system is present. The most
frequent system was based on exhaust ventilation directly in the room (47% of cases), followed by balanced ventilation (32% of the day care centers). In conclusion, the authors recommended that a minimum ventilation rate should be provided during the night to limit high level of pollutants indoors. Mydlarz et al. (Mydlarz et al. 2013) carried out measurements in 75 classrooms of 4 schools in the UK. Measurements were performed over almost two years and covered the 4 seasons. It was observed that 39% of the classrooms exceeded the recommended limit of 1500 ppm, 93% of which were old buildings. No significant difference between naturally and mechanically ventilated schools was detected. Gaitani and Santamouris (2013) (Gaitani and Santamouris 2013) evaluated 83 classrooms of 18 schools in Greece, all naturally ventilated. With classrooms unoccupied and windows closed, the ACH varied between 0.1 and 1.9 h-1. During classes breaks, with most windows opened, ACH varied between 1.3 and 12.1 h-1. Regarding CO
2 concentration, the 1000 ppm limit was exceeded in 61% of the schools.
1 2 3 4 5 6 7 8 9 10 11 12 13 14 15 16 17 18 19 20 21 22 23 24 25 26 27 28 29 30 31 32 33 34 35 36 37 38 39 40 41 42 43 44 45 46 47 48 49 50 51 52 53 54 55 56 57 58 59
The hygrothermal component of the IEQ is specified in both national and international standards and regulations. Table 2 presents the requirements for comfort in classrooms (temperature and relative humidity). It should be noted that although several international studies support adaptive comfort methodologies, these are still not included in the large majority of the national regulations.
Table 2 - Hygrothermal requirements in classrooms. Country [Standard or regulation] Temperature - T [ºC] Relative humidity - RH [%]
winter summer winter summer Portugal
[RECS (2013)] 20 - 25 - -
United Kingdom
[Building Bulletin 87 (2003) and 101 (2006)]
18 24 4ºC* - < 70** Germany
[DIN 1946-2 (2005)] 20 - 23 < 26 40 - 60
Finland
[National building code – Part D2 (2010)] 21 1 < 25 - - USA
[ASHRAE 62.1 (2013)] - - 65
Europe
[EN 15251 (2007)]*** 20 26 - -
*this value can be exceeded during 80 hours/year;
**this value can be exceeded during 2 hours in 12 hours period
***value for class II (normal level of expectation - new buildings and renovations).
Among European and North American countries it is well established the idea of “low energy” new, or rehabilitated, school buildings, leading to high insulation levels. However, situations of overheating might occur. This problem has been reported by several researchers (Jenkins et al. 2009; Montazami and Nicol 2013). Additionally, the latest studies show that children and adults have different perceptions of comfort. Mors et al. (Mors et al. 2011) studied the PMV model in 3 classrooms from different primary schools, located in Netherlands, all naturally ventilated. Measurements were made in spring, summer and winter seasons and the PMV model was tested in a set of 79 children. They concluded that PMV model does not accurately predicts the thermal sensation of children, underestimating the thermal sensation up
1 2 3 4 5 6 7 8 9 10 11 12 13 14 15 16 17 18 19 20 21 22 23 24 25 26 27 28 29 30 31 32 33 34 35 36 37 38 39 40 41 42 43 44 45 46 47 48 49 50 51 52 53 54 55 56 57 58 59
to 1.5 scale points. Also, it was found that children prefer lower temperatures than those predicted by adaptive models. Teli et al. (Despoina Teli et al. 2012; D. Teli et al. 2013), through questionnaires given to 230 students belonging to 8 classrooms in a UK naturally ventilated school, concluded that, out of the winter season (April to July), children prefer lower temperatures than the ones predicted in PMV and adaptive models. The importance of adjusting the existing models to account for the differences between adults and children is discussed. A literature review published by Frontczak and Wargocki (Frontczak and Wargocki 2011) on the influence of various factors on human comfort concluded that thermal comfort is the most important parameter in IEQ evaluation and that occupants of buildings with natural ventilation revealed a more adaptive behaviour. Wargocki and Wyon (Wargocki and Wyon 2013) published a summary of 7 experiments carried out in Denmark in 5 primary schools comprising 10 classrooms, with mechanical ventilation, with the involvement of 380 children. They concluded that high CO2 concentrations and high temperatures may reduce performance by
about 30%. They have also inferred that the effectiveness of window opening to achieve good indoor environmental conditions is dependent on the use of CO2 sensors or in the existence of
automatic opening systems. In Mediterranean climates, as a result of a favourable climate that supports the use of natural ventilation, specific adaptive models have been developed (Corgnati et al. 2009; Guedes et al. 2009; Eusébio Z. E. Conceição et al. 2012).
1.2 IEQ and students’ performance
Mendell and Heath (Mendell and Heath 2005) published a critical review of previous studies, which intended to prove a relationship between the IEQ of classrooms and the academic performance of students in secondary schools. The results of the 30 analyzed studies suggest that poor IEQ (e.g. insufficient ventilation) is common in schools and it is linked to health problems, also negatively influencing students’ performance and attendance. Franchimon et al.
1 2 3 4 5 6 7 8 9 10 11 12 13 14 15 16 17 18 19 20 21 22 23 24 25 26 27 28 29 30 31 32 33 34 35 36 37 38 39 40 41 42 43 44 45 46 47 48 49 50 51 52 53 54 55 56 57 58 59
(Franchimon et al. 2009) analyzed the results obtained in several studies on the relationship between students’ academic performance and the ventilation rate. It was concluded that learning performance decreases for ventilation rates below 4 l/s/person and that above 10 l/s/person learning improvement is not so evident. However, above this ventilation rate there were few studies. They stated that it is necessary to implement ventilation rates that also include infiltration. Shaughnessy et al. (Haverinen-Shaughnessy et al. 2011), for a set of 100 fifth-grade classrooms of different US schools, concluded that an improvement in the ventilation rate corresponds to a better academic performance (in the range 0.9 - 7.1 l/s/person, an increment of 1.0 l/s/person corresponds to an increase of 2.9% in the number of students who obtained approval on standardized tests). Sundell et al. (Sundell et al. 2011), through a literature review, concluded that low ventilation rates are associated with absenteeism and respiratory symptoms and Bakó-Biró et al. (Bakó-Biró et al. 2012) analyzing computer tasks performed by 200 children belonging to 16 classrooms of 8 primary schools, found that low levels of ventilation reduce the attention and vigilance and negatively affect memory and concentration.
1.3 Natural ventilation in schools
In recent years several studies regarding IEQ were published, covering schools of different levels of education with natural ventilation systems (single-sided or cross ventilation), in continuous or purge ventilation. Natural ventilation proved to have great potential, particularly in southern European climate. However, the results, particularly in terms of thermal comfort (air temperature) and ventilation rate or levels of CO2 concentration have not always
been satisfactory.
Coley and Beisteiner (Coley and Beisteiner 2002; Beisteiner and Coley 2003) performed measurements in UK primary schools in winter (7 classrooms) and during summer (4 classrooms). The measurements took place during a week-long period in each classroom and it
1 2 3 4 5 6 7 8 9 10 11 12 13 14 15 16 17 18 19 20 21 22 23 24 25 26 27 28 29 30 31 32 33 34 35 36 37 38 39 40 41 42 43 44 45 46 47 48 49 50 51 52 53 54 55 56 57 58 59
was concluded that opening windows between classes - purge ventilation - has the potential to reduce CO2 levels to the recommended values. They concluded that opening windows was not
commonly used due to their location (above the occupied zone), or to possible air drafts and also because the staff, including teachers, were reluctant to open the windows, especially because they are not sensitized to the issue of classrooms ventilation. Conceição and Lúcio (E.Z.E. Conceição and Lúcio 2006) monitored 2 unoccupied classrooms of 1 school in the south of Portugal with cross ventilation, using the sliding sash windows opening, located above the door and main windows. An air change rate between 0.9 and 1.0 h-1 was obtained. CO2
concentration in a new UK school building was measured for one week during heating season (exterior temperatures between 2 and 13 ºC). The school was naturally ventilated, the mean daily value varied between 700 and 1500 ppm and the maximum registered value was 2800 ppm. It was concluded that purge ventilation during 10 min can reduce CO2 concentration
by approximately 1000 ppm without compromising thermal comfort. However, more than two periods of ventilation are required to maintain an adequate daily mean level of concentration (Griffiths and Eftekhari 2008).
Santamouris et al. (Santamouris et al. 2008) monitored the IAQ in 62 classrooms of 27 naturally ventilated schools of Athens. Measurements were performed in spring and fall seasons when window opening is the main ventilation procedure. Three situations were assessed: a) empty rooms and windows closed; b) during classes, with some windows opened; c) between classes, with most of the windows opened. The average flow rates obtained were 1.5 l/s/person, 4.5 l/s/person and 7 l/s/person, respectively. During the three measurement periods, 52% of the classrooms presented a CO2 concentration greater than 1000 ppm with a median value of
1070 ppm. At the end of the class period, there was a maximum concentration of 3000 ppm with a median of 1650 ppm. A statistically significant relationship between the window opening and the difference in indoor-outdoor temperature was confirmed. In an attempt to combine
1 2 3 4 5 6 7 8 9 10 11 12 13 14 15 16 17 18 19 20 21 22 23 24 25 26 27 28 29 30 31 32 33 34 35 36 37 38 39 40 41 42 43 44 45 46 47 48 49 50 51 52 53 54 55 56 57 58 59
mechanical and natural ventilation, Heudorf et al. (Heudorf et al. 2009) measured the CO2
concentration level in 2 mechanically ventilated primary schools in Germany during three weeks (in February and March). In the third week, ventilation rate was improved by including a protocol for window opening between classes. It was verified that in the first two weeks, the mean CO2 concentration was 1500 ppm with a maximum value of 4850 ppm and in the third
week there was a reduction for a mean value of 1000 ppm with a maximum value of 3600 ppm. Mumovic et al.(Mumovic et al. 2009) performed a measurement campaign in two classrooms of 9 secondary schools in the UK; temperature, relative humidity and CO2 concentration were
recorded. Of the total classrooms monitored, 14 had natural ventilation (cross or single-sided ventilation), 1 hybrid ventilation and 4 mechanical ventilation. The measurements were carried out for a week in the heating season. Results revealed that air temperature varied between 18.2 and 29.1 °C, far higher than the ones recommended by standards and considered for design purposes. Relative humidity ranged between 33 and 70%. Regarding IAQ, only 6 classrooms failed to meet the average 1500 ppm, all with natural ventilation. It was also found that acoustic requirements inside the rooms are possible to achieve even in schools with natural ventilation, provided that the outside noise is not excessive. Giuli et al. (De Giuli et al. 2012) evaluated 7 Italian primary schools (28 classrooms), all naturally ventilated. Measurements took place in spring and the average CO2 concentration above the exterior concentration varied between 45
and 3635 ppm. Twelve classrooms exceeded exterior concentration by more than 1000 ppm. Through surveys, it was concluded that indoor conditions strongly depend on teachers’ preferences and behaviour and that windows are mainly opened during breaks. In Denmark, different ventilation strategies were tested by Gao et al. (Gao et al. 2014) in 4 classrooms, including either manually operable windows or automatically operable windows (with and without an exhaust fan in operation). The classroom in which ventilation was achieved by
1 2 3 4 5 6 7 8 9 10 11 12 13 14 15 16 17 18 19 20 21 22 23 24 25 26 27 28 29 30 31 32 33 34 35 36 37 38 39 40 41 42 43 44 45 46 47 48 49 50 51 52 53 54 55 56 57 58 59
manually operable windows had the highest air temperatures and CO2 concentrations (air
change rate was the lowest).
1.4 Research motivation
Natural ventilation, as other ventilation systems, has advantages and disadvantages. However, towards the goals of reducing energy consumption and considering the adaptive possibilities of students, our hypothesis is that in Portugal and in other southern European countries, natural ventilation in schools, both new and refurbished, has a great potential for successful implementation (Guedes et al. 2009; Almeida and de Freitas 2014). Yet, according to the above mentioned, various examples have shown that the practical application of too rigid ventilation protocols not always proves efficient.
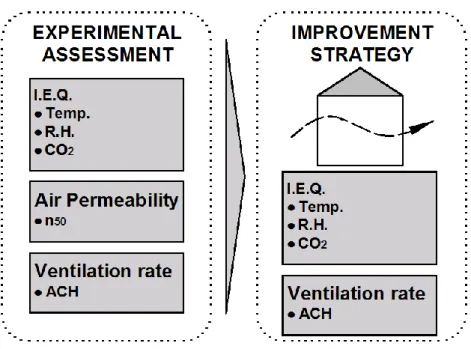
In this vein, a large research plan was prepared to experimentally assess the ventilation conditions of Portuguese classrooms and based on the results an improvement strategy based on a simple ventilation protocol was tested. Classrooms characterization included the IEQ evaluation, air permeability measurements and air change rate determination under different boundary conditions (with emphasis on evaluating the cross-ventilation potential of the classrooms). The research strategy is represented schematically in Figure 1.
1 2 3 4 5 6 7 8 9 10 11 12 13 14 15 16 17 18 19 20 21 22 23 24 25 26 27 28 29 30 31 32 33 34 35 36 37 38 39 40 41 42 43 44 45 46 47 48 49 50 51 52 53 54 55 56 57 58 59
Figure 1. Research strategy.
2 METHODOLOGY 2.1 Schools and campaigns
This paper focuses on the IAQ and thermal comfort and their relation with buildings airtightness and the effect of different natural ventilation protocols in school buildings. A simplified evaluation of the thermal comfort was implemented as only the air temperature and relative humidity were considered.
The project comprises 8 schools of different levels of education (from kindergarten to college) located in the town of Viseu.
School Buildings’ construction is quite homogeneous. All are based on heavy construction, which provide large thermal inertia: single and double brick masonry and reinforced concrete floor slabs and roofs. The schools A, C, E, G and H have double glazed windows, while schools B, D and F have single glazed windows. Windows have aluminum frames, except school D (Table 3), which has various systems. Average ratio between glazed and floor area is 20%. Different shading devices were identified, including fabric blinds in the interior and in the
1 2 3 4 5 6 7 8 9 10 11 12 13 14 15 16 17 18 19 20 21 22 23 24 25 26 27 28 29 30 31 32 33 34 35 36 37 38 39 40 41 42 43 44 45 46 47 48 49 50 51 52 53 54 55 56 57 58 59
exterior PVC horizontal fixed blades (louvres) and horizontal overhangs. Regarding the envelope insulation, three periods can be defined:
- Buildings constructed before 1991 (no thermal regulation was available): no (or very low) insulation thickness was used;
- Buildings constructed between 1991 and 2006 (first thermal regulation): low insulation thickness (usually 3 cm);
- Buildings constructed after 2006 (second thermal regulation): insulation thickness of approximately 6 cm.
A total of 32 classrooms, installed in buildings of different types and ages, and with different orientations and sun exposure, were evaluated (Table 3). Classrooms had an approximate average area of 50 m2 and an internal height of 3 m. All have bottom hung windows on the
outside and several had small openings in the interior with adjoining corridors, allowing for the implementation of a cross ventilation strategy as described in section 5. Regarding heating systems, all the schools have hot water radiators, except G and H (HVAC systems). However, the use all the systems was, during most of the time, discontinuous and dependent on the school board instructions.
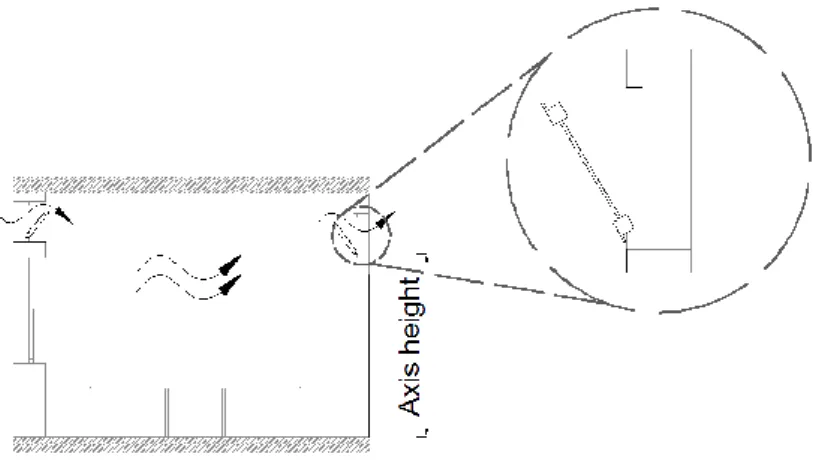
The exterior bottom hung windows with opening above the occupied zone allow to reduce discomfort due to drafts. The Portuguese thermal regulation (2013) only allows natural ventilation in schools if part of the windows is 1.80 m above the floor. Schools G and H have ventilation windows with an axis at a height of approximately 0.90 m but the others respect that recommendation. Figure 2 shows the cross ventilation strategy defined in sections 5 and 6, highlighting the bottom hung window’s system and the axis position.
1 2 3 4 5 6 7 8 9 10 11 12 13 14 15 16 17 18 19 20 21 22 23 24 25 26 27 28 29 30 31 32 33 34 35 36 37 38 39 40 41 42 43 44 45 46 47 48 49 50 51 52 53 54 55 56 57 58 59
Figure 2. Cross ventilation scheme and axis position.
Table 3 - School building characterization.
School Classrooms Designation Year Built Level of education Designation Building floor Orientation Windows typea Ventilation systemb A 1993 College A1 0 S TT + BH MV off A2 0 S / W A3 1 S A4 1 S / W B 1991 Lower secondary B1 0 NE S + BH NV B2 0 SW B3 1 NE B4 1 SW C 2004 Kindergarten C1 0 SE BH NV C2 0 NW Primary C3 1 SE C4 1 NW D 1968 Lower secondary D1 -1 S SH + BH NV D2 1 S D3 1 S D4 -1 S / E S E 1996 Primary E1 0 E SH + BH NV Lower secondary E2 0 S / E E3 1 E E4 1 W / S F 1958 Primary F1 0 S / N S + BH NV F2 1 S / N F3 0 S / N F4 1 S / N G 2011 Kindergarten G1 0 E TT + BH HVAC G2 0 W Primary G3 1 S G4 1 S H 2011 Kindergarten H1 0 E SH + BH HVAC H2 0 W Primary H3 1 W H4 -1 E
aTT - tilt and turn; BH - bottom hung (tilting); SH - side hung (casement); S - sliding (horizontal sash).
1 2 3 4 5 6 7 8 9 10 11 12 13 14 15 16 17 18 19 20 21 22 23 24 25 26 27 28 29 30 31 32 33 34 35 36 37 38 39 40 41 42 43 44 45 46 47 48 49 50 51 52 53 54 55 56 57 58 59
The research was developed in 3 campaigns:
- spring 2013 (March - May): measurements were performed during 4 consecutive days in each school in occupied classrooms - hygrothermal performance (T and RH) and IAQ (CO2) were evaluated;
- summer 2013 (July - September): ACH rate measurements were performed using the tracer gas method - decay technique, in unoccupied classrooms and according to various conditions concerning window and door positions; classrooms air permeability, including the influence of windows and other openings, was determined using the fan pressurization method (blower door);
- autumn 2013 (September - October): same parameters as for the first campaign were measured during 2-4 days. However, in each school, 2 classrooms were selected with specific conditions for single-sided or cross ventilation and a ventilation protocol was imposed. The other 2 classrooms had no control on the window opening.
2.2 Tests and equipment
Research included temperature, relative humidity and CO2 concentration continuous
measurements with one minute sampling interval. Existing international recommendations were accomplished (WHO European Centre for Environment and Health 2011; Materials 2012), in particular, for sensors location, avoiding windows and heaters proximity. Generally, sensors were positioned next to the teacher desk (at an approximate height of 0.70 m). The following equipment was used: 1 indoor air quality measurement device, that records temperature, relative humidity and CO2 concentration (temperature accuracy ± 0.5 ºC; relative
humidity accuracy ± 2%; CO2 concentration accuracy 2.75% + 75 ppm), 3 data loggers for
temperature and relative humidity (temperature accuracy ± 0.35 ºC; relative humidity accuracy
1 2 3 4 5 6 7 8 9 10 11 12 13 14 15 16 17 18 19 20 21 22 23 24 25 26 27 28 29 30 31 32 33 34 35 36 37 38 39 40 41 42 43 44 45 46 47 48 49 50 51 52 53 54 55 56 57 58 59
5% of the reading, whichever is greater). All the sensors used in this project were calibrated by the manufacturers and by an independent governmental entity.
Ventilation rates (ACH) measurements was performed according to ASTM E741: 2011 (ASTM 2011). A photoacustic detection equipment with a repeatability of 1% of the measured value and the SF6 tracer gas were used.
Regarding air permeability assessment, the fan pressurization methodology proposed in EN 13829: 2001 (CEN 2001) was used. The test allows the determination of n50, which corresponds
to the air change rate at a pressure difference of 50 Pa. A blower door was used with an accuracy of the gauge of 1 Pa or 2%, whichever is greater.
Exterior climate conditions were assessed (temperature, relative humidity and wind direction and velocity) by the use of a local meteorological station.
Portugal has a temperate Mediterranean climate, however with differences between north and south and distance to Atlantic Ocean. Viseu, located in the center of Portugal, is characterized by lower rainfall and higher annual temperature range. However, as can be seen on Table 4, the external temperature, except for a few winter months, allows the use of natural ventilation, while avoiding the risk of discomfort due to drafts. Similarly, in the months of June and September outside temperatures are moderate allowing cross ventilation for indoor cooling. The Portuguese thermal regulation (2013) indicates, for the town of Viseu, approximately 1700 heating degree days (base 18 ºC).
1 2 3 4 5 6 7 8 9 10 11 12 13 14 15 16 17 18 19 20 21 22 23 24 25 26 27 28 29 30 31 32 33 34 35 36 37 38 39 40 41 42 43 44 45 46 47 48 49 50 51 52 53 54 55 56 57 58 59
Table 4 - Monthly weather variables in the town of Viseu (2012) - period between 8:00 and 18:00. Tav [ºC] HRav [%] wvav [m/s] January 8.7 68.1 3.2 February 8.5 44.7 3.9 March 14.2 44.9 3.7 April 9.5 77.0 3.6 May 17.8 60.7 3.3 Jun 19.5 61.7 3.0 September 21.7 47.5 4.0 October 15.2 70.9 2.8 November 9.8 78.2 3.6 December 8.9 81.3 3.1 3 IEQ ASSESSMENT
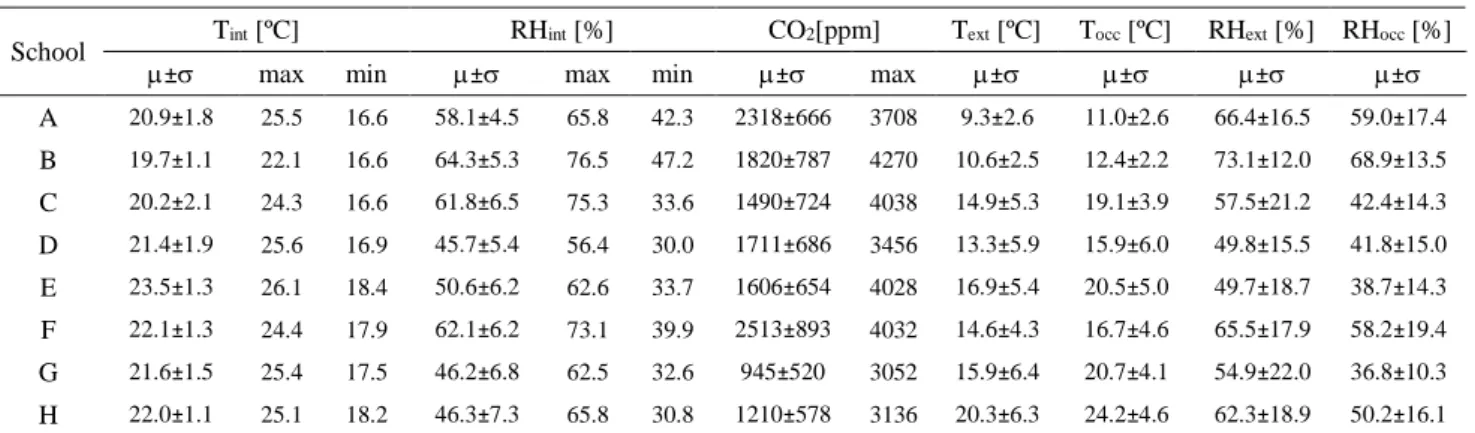
Classrooms IEQ was evaluated according to the previously described methodology. Descriptive statistical analysis of the results are presented in Table 5, which includes information about indoor temperature, relative humidity and CO2 concentration, during the
period of occupation and the correspondent weather conditions, temperature and relative humidity, both daily (Text and RHext) and only considering the period of occupation (Tocc and
RHocc). Normal distribution of the data-sets was tested (Shapiro-Wilk test; p < 0.05).
Table 5 - IEQ results (spring 2013).
School Tint [ºC] RHint [%] CO2[ppm] Text [ºC] Tocc [ºC] RHext [%] RHocc [%]
± max min ± max min ± max ± ± ± ± A 20.9±1.8 25.5 16.6 58.1±4.5 65.8 42.3 2318±666 3708 9.3±2.6 11.0±2.6 66.4±16.5 59.0±17.4 B 19.7±1.1 22.1 16.6 64.3±5.3 76.5 47.2 1820±787 4270 10.6±2.5 12.4±2.2 73.1±12.0 68.9±13.5 C 20.2±2.1 24.3 16.6 61.8±6.5 75.3 33.6 1490±724 4038 14.9±5.3 19.1±3.9 57.5±21.2 42.4±14.3 D 21.4±1.9 25.6 16.9 45.7±5.4 56.4 30.0 1711±686 3456 13.3±5.9 15.9±6.0 49.8±15.5 41.8±15.0 E 23.5±1.3 26.1 18.4 50.6±6.2 62.6 33.7 1606±654 4028 16.9±5.4 20.5±5.0 49.7±18.7 38.7±14.3 F 22.1±1.3 24.4 17.9 62.1±6.2 73.1 39.9 2513±893 4032 14.6±4.3 16.7±4.6 65.5±17.9 58.2±19.4 G 21.6±1.5 25.4 17.5 46.2±6.8 62.5 32.6 945±520 3052 15.9±6.4 20.7±4.1 54.9±22.0 36.8±10.3 H 22.0±1.1 25.1 18.2 46.3±7.3 65.8 30.8 1210±578 3136 20.3±6.3 24.2±4.6 62.3±18.9 50.2±16.1
A clear distinction between the hygrothermal and the IAQ results must be made. Temperature and relative humidity results revealed a performance within the comfort zone
1 2 3 4 5 6 7 8 9 10 11 12 13 14 15 16 17 18 19 20 21 22 23 24 25 26 27 28 29 30 31 32 33 34 35 36 37 38 39 40 41 42 43 44 45 46 47 48 49 50 51 52 53 54 55 56 57 58 59
according to the Portuguese regulation: average temperature above 20.0 ºC (the only exception is school B with 19.7 ºC), with a relatively small dispersion of results (standard deviation below 2.0 ºC, the only exception being school C with 2.1 ºC); the maximum temperature was observed in school E with 26.1 ºC and the minimum temperature was 16.6 ºC in schools A, B and C; relative humidity mean values varied between 46% and 64%, and the overall oscillation is limited to the range 30-77%, usually considered as adequate indoor conditions (CEN 2006); the maximum relative humidity was registered in school B (76.5%) and the minimum one in school D (30.0%). When analysing the temperature only considering the period of occupation, the effect of exterior temperature become clear.
On the indoor air quality evaluation a completely different scenario was observed with high CO2 concentrations being identified, with a magnitude that, in some situations, should be a
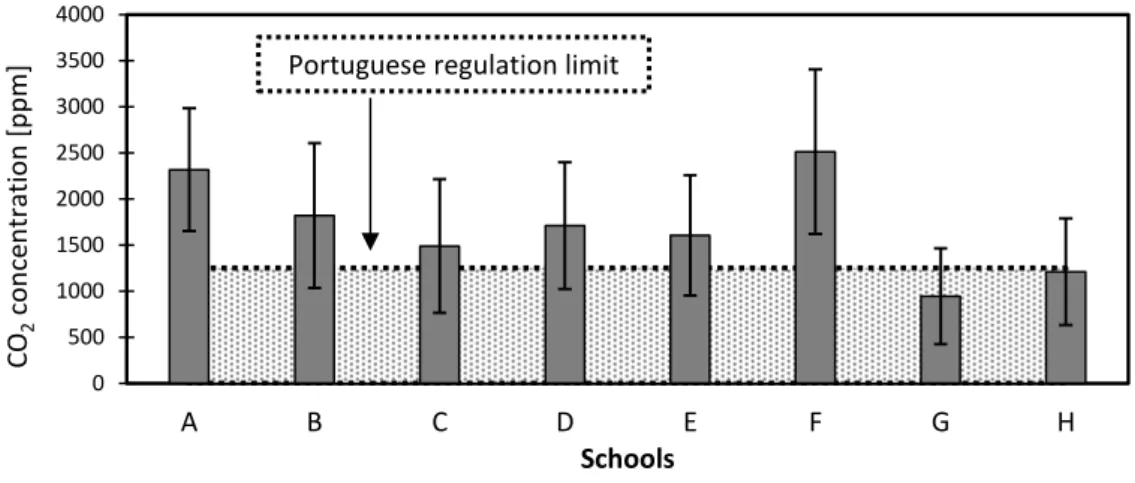
matter of concern for the building administration. This kind of situation is not new, even in countries with different climate conditions, since several previous studies reported similar problems in classrooms throughout the World (Jenkins et al. 2009; Despoina Teli et al. 2011; Montazami et al. 2012; Almeida and de Freitas 2014). Maximum values were above 3000 ppm in all school buildings and in four of them they have increased up to 4000 ppm. Considering average values for the all period, only schools G and H presented concentrations below 1250 ppm (the Portuguese regulation concentration limit); in 6 buildings the mean value was higher than 1500 ppm and in 2 of them it was higher than 2000 ppm. For our sample, the best performing schools were G and H. On the other hand, the worst scenarios were observed in schools A and F. These findings might be related to the external conditions as, for instance, average external temperature during monitoring: for school A was 9.3 ºC; and for school H was 20.3 ºC (enhancing the window opening). High standard deviation values also indicate a large spreading on the results (Figure 3).
1 2 3 4 5 6 7 8 9 10 11 12 13 14 15 16 17 18 19 20 21 22 23 24 25 26 27 28 29 30 31 32 33 34 35 36 37 38 39 40 41 42 43 44 45 46 47 48 49 50 51 52 53 54 55 56 57 58 59
Figure 3. CO2 concentration average and standard deviation.
The importance of improving classrooms ventilation arises from results of first campaign. The next step, in the study, was to evaluate the ventilation conditions of the classrooms, including the potential to improve ventilation rates by simple adjustments based on a ventilation protocol that must be implemented in such a manner that classrooms comfort conditions are not neglected.
4 CLASSROOMS AIR PERMEABILITY: BLOWER DOOR MEASUREMENTS Air permeability of the envelope was the first assessed ventilation parameter which is essential for the air infiltration and, therefore, affecting both the energy efficiency of the building and the IAQ. Classrooms permeability was evaluated by the fan pressurization method according to the experimental procedure referred in section 2. Tests were performed on one classroom of 5 schools.
The followed methodology allowed the evaluation of the individual contribution of the envelope elements for the classroom permeability. Therefore, several experimental set-ups were analysed in each classroom: the first corresponding to the “in use scenario” where nothing was sealed; then the construction elements that have a higher contribution to the air leakage of
0 500 1000 1500 2000 2500 3000 3500 4000 A B C D E F G H CO 2 con ce n tra tio n [pp m ] Schools
Portuguese regulation limit
1 2 3 4 5 6 7 8 9 10 11 12 13 14 15 16 17 18 19 20 21 22 23 24 25 26 27 28 29 30 31 32 33 34 35 36 37 38 39 40 41 42 43 44 45 46 47 48 49 50 51 52 53 54 55 56 57 58 59
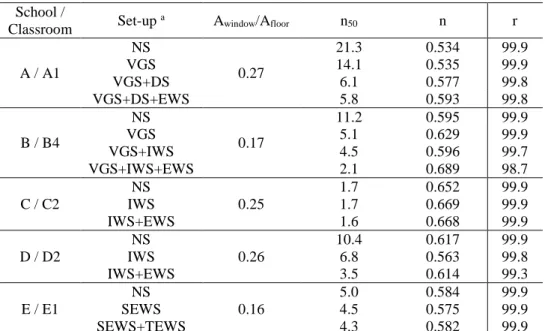
consecutively sealed. The individual contribution was then computed by the difference between consecutive tests. All the remaining boundary conditions were kept unchanged. Therefore, the “nothing sealed” scenario includes leakage from the neighbouring classrooms and is a measure of internal building leakage corresponding to typical use conditions (method A of EN 13829: 2001(CEN 2001)). This procedure resulted in a total of 34 blower door tests (17 for pressurization and 17 for depressurization). Table 6 summarizes the results, including the set-up description, the ratio window to floor area, the air change rate at a pressure difference of 50 Pa (n50) and the air flow exponent (n) of the corresponding permeability law. Figure 2
presents the maximum differences of n50 (maximum and minimum value).
Table 6 - Measured air permeability and related parameters. School / Classroom Set-up a A window/Afloor n50 n r A / A1 NS 0.27 21.3 0.534 99.9 VGS 14.1 0.535 99.9 VGS+DS 6.1 0.577 99.8 VGS+DS+EWS 5.8 0.593 99.8 B / B4 NS 0.17 11.2 0.595 99.9 VGS 5.1 0.629 99.9 VGS+IWS 4.5 0.596 99.7 VGS+IWS+EWS 2.1 0.689 98.7 C / C2 NS 0.25 1.7 0.652 99.9 IWS 1.7 0.669 99.9 IWS+EWS 1.6 0.668 99.9 D / D2 NS 0.26 10.4 0.617 99.9 IWS 6.8 0.563 99.8 IWS+EWS 3.5 0.614 99.3 E / E1 NS 0.16 5.0 0.584 99.9 SEWS 4.5 0.575 99.9 SEWS+TEWS 4.3 0.582 99.9
a NS - nothing sealed; VGS - ventilation grilles sealed; DS - door sealed; EWS - external windows sealed; IWS - interior windows sealed; SEWS - sliding exterior windows sealed; TEWS - top-hung exterior window sealed.
1 2 3 4 5 6 7 8 9 10 11 12 13 14 15 16 17 18 19 20 21 22 23 24 25 26 27 28 29 30 31 32 33 34 35 36 37 38 39 40 41 42 43 44 45 46 47 48 49 50 51 52 53 54 55 56 57 58 59
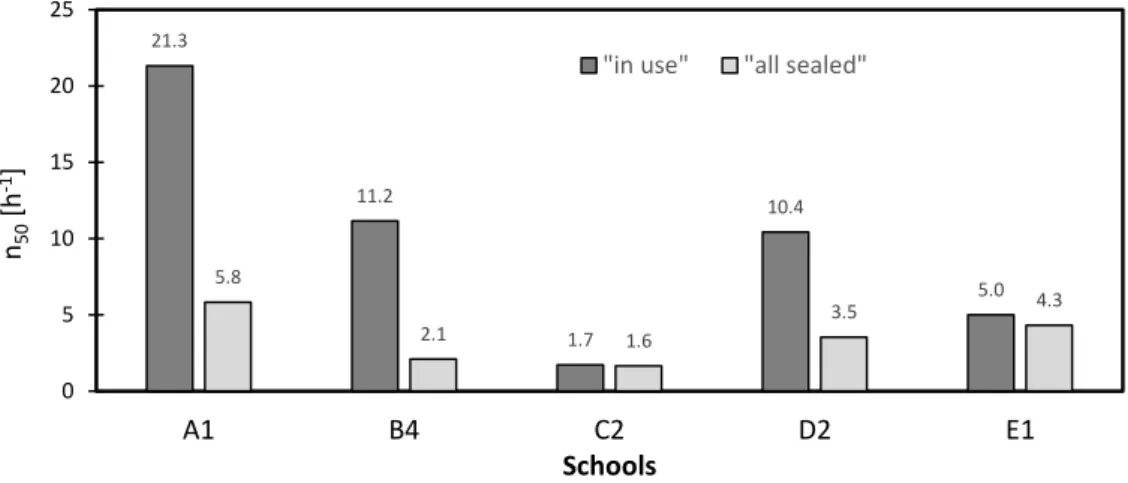
Figure 4. Average air permeability at p = 50 Pa.
Obtained results showed large differences between schools. The construction characteristics, including materials and technical solutions adopted (e.g. ventilation system and aperture mode of the windows) and also the buildings’ age are decisive for the air permeability. The largest reduction was observed in school B (81%) with the most important contributions from the ventilation grilles and exterior windows frame. Reductions of 73% and 66% were obtained in schools A and D, respectively. All these constructions have more than 20 years. On the contrary, lower air permeability was detected in schools C and E. Even for the “in use” condition (nothing sealed) the average air permeability at p = 50 Pa was 1.7 and 5.0, respectively. School C windows are bottom hung, very airtight, and most of the glazed area is fixed, which might help to explain the lower values.
Air permeability is closely linked with infiltration and, therefore, it can assume an important role on the building ventilation, particularly in naturally ventilated buildings. However, despite having a positive impact on the classrooms’ IAQ, being “uncontrolled” ventilation, it should be minimized because it will be responsible for large energy losses during the winter season, negatively affecting the building energy efficiency.
21.3 11.2 1.7 10.4 5.0 5.8 2.1 1.6 3.5 4.3 0 5 10 15 20 25 A1 B4 C2 D2 E1 n50 [h -1] Schools
"in use" "all sealed"
1 2 3 4 5 6 7 8 9 10 11 12 13 14 15 16 17 18 19 20 21 22 23 24 25 26 27 28 29 30 31 32 33 34 35 36 37 38 39 40 41 42 43 44 45 46 47 48 49 50 51 52 53 54 55 56 57 58 59
5 ACH MEASUREMENTS
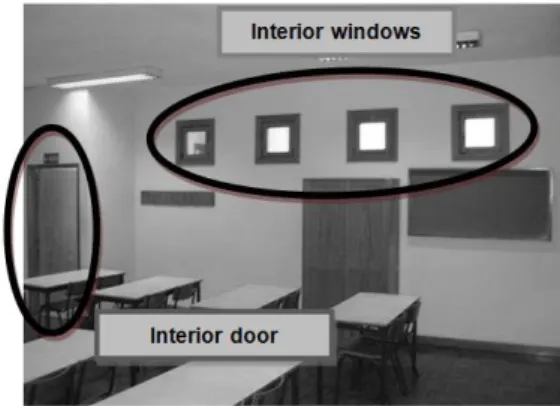
ACH measurements were made on unoccupied classrooms, during summer break (August), using the tracer gas method - decay technique. According to the specific conditions of each classroom, such as windows type and position, several experimental set-ups were assessed in order to evaluate the different possibilities for natural ventilation: everything closed (only infiltration), single-sided ventilation, cross ventilation, with and without door opened (Figure 5).
Figure 5. Example of openings used for the ACH determination.
A total of 110 measurements were performed on the 32 classrooms under study. All the measurements were made with moderate wind conditions (average velocity of 4.1 m/s). The experimental procedure time length varied between 30 minutes and 5 hours, depending on the ventilation rate (longest duration for lower ventilation rate) and according to the specified on ASTM E741: 2011 (ASTM 2011). The sampling point was located on the center of the classroom at a height of 1.2 m; 2 fans were used to mix and to distribute the tracer gas uniformly in the zone, and data was collected with a 40 seconds interval (in average). The regression method was used to determine the ACH.
Natural ventilation potential was assessed in the following conditions:
1 2 3 4 5 6 7 8 9 10 11 12 13 14 15 16 17 18 19 20 21 22 23 24 25 26 27 28 29 30 31 32 33 34 35 36 37 38 39 40 41 42 43 44 45 46 47 48 49 50 51 52 53 54 55 56 57 58 59
- everything closed or “in use” position (ex.: permanent openings above the entrance door): it is intended to simulate the current conditions of natural ventilation achieved by infiltration only;
- single-sided ventilation: it was used when classrooms did not have interior windows or other openings and 2 exterior windows were opened;
- cross ventilation: it was used when classrooms had exterior and interior openings (interior openings adjacent to the corridor) and 2 exterior and 2 interior windows were opened; - cross ventilation and door opened: identical to the previous set-up but with the entrance door opened (0,82,0 m2).
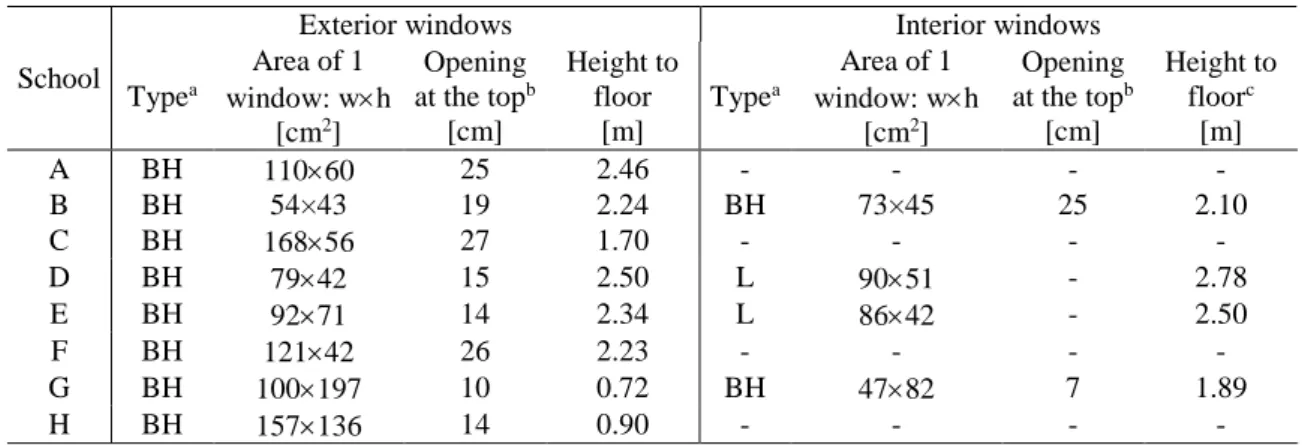
Table 7 details the classrooms windows characteristics.
Table 7 - Windows characteristics.
School
Exterior windows Interior windows
Typea Area of 1 window: wh [cm2] Opening at the topb [cm] Height to floor [m] Typea Area of 1 window: wh [cm2] Opening at the topb [cm] Height to floorc [m] A BH 11060 25 2.46 - - - - B BH 54×43 19 2.24 BH 73×45 25 2.10 C BH 16856 27 1.70 - - - - D BH 7942 15 2.50 L 9051 - 2.78 E BH 9271 14 2.34 L 8642 - 2.50 F BH 12142 26 2.23 - - - - G BH 100197 10 0.72 BH 4782 7 1.89 H BH 157136 14 0.90 - - - -
a BH - bottom hung (tilting); L - louvred.
b Horizontal distance between movable and fixed frame. c Axis height in Figure 2
1 2 3 4 5 6 7 8 9 10 11 12 13 14 15 16 17 18 19 20 21 22 23 24 25 26 27 28 29 30 31 32 33 34 35 36 37 38 39 40 41 42 43 44 45 46 47 48 49 50 51 52 53 54 55 56 57 58 59
Table 8 summarizes the results in each school, including the number of samples (N).
Table 8 - ACH tests in each school.
School Set-up a Cl CV CV + door SS A N ± 4 2 5 4 B N ± C N ± D N ± E N ± F N ± G N ± H N ±
aCl - windows closed; CV - cross ventilation; CV+door - cross ventilation + door; SS – single-sided ventilation.
In line with previous studies (Almeida and de Freitas 2014), results exposed airtight enclosures. For the scenario of windows closed (Cl), the ACH average ranged from 0.04 h-1 in school C to 0.5 h-1 in school B, with exception of school D that presented 1.5 h-1. In fact, school D is a special case since the wood on the window frames is deteriorated and in a very poor condition, allowing uncontrolled airflow. Another interesting conclusion is that, when available, cross ventilation (CV) has a great potential. In this condition, results varied between 1.6 h-1 and 7.6 h-1. Regarding the single-sided (SS) ventilation, results were more modest, ranging from 0.6 h-1 to 2.9 h -1, although still being an interesting approach to improve the IAQ.
The variability of the results was also analyzed. Figure 6 presents the results box-plot.
1 2 3 4 5 6 7 8 9 10 11 12 13 14 15 16 17 18 19 20 21 22 23 24 25 26 27 28 29 30 31 32 33 34 35 36 37 38 39 40 41 42 43 44 45 46 47 48 49 50 51 52 53 54 55 56 57 58 59
Figure 6. Box-plot of the results of the ACH measurements.
Enclosure permeability, which corresponds to the situation of windows closed, is the one that presents less variability, the other scenarios having a wider range of results. For this situation median ACH was 0.2 h-1 clearly confirming that infiltration is not sufficient to control and dilute
de CO2 internal production. Therefore, additional ventilation must be provided. For that purpose
results revealed that the two ventilation modes that can be implemented during classes (CV and SS) should significantly improve the IAQ. A median ACH of 2.8 and 1.0 h-1 were found for CV and SS, respectively. As it would be expected, CV has a higher potential according to the reference values presented in Table 1 for the Portuguese case. The ventilation mode CV+door, which can be implemented during breaks, presents the higher median value, 3.4 h-1 and can provide an important contribution for the control of CO2 concentration. CV modes are the ones
that present higher variability with maximum values up to 8.3 and 14.2 h-1 for CV and CV+door, respectively.
The ACH obtained with tracer gas and the blower door results can be compared. The relation n50/20 is typically used for low precision estimations of the ACH value through infiltration.
0 2 4 6 8 10 12 14 16 Cl (N=31) CV (N=14) CV + door (N=37) SS (N=28) AC H [h -1] Type of ventilation Cl: windows closed CV: cross ventilation
CV+door: cross ventilation + door SS: single-sided ventilation 1 2 3 4 5 6 7 8 9 10 11 12 13 14 15 16 17 18 19 20 21 22 23 24 25 26 27 28 29 30 31 32 33 34 35 36 37 38 39 40 41 42 43 44 45 46 47 48 49 50 51 52 53 54 55 56 57 58 59
Table 9 compares the results obtained using both methods. In classrooms B4, C2 and E1 a good agreement can be found. Yet, it is important to notice that ACH results are median values obtained in different classrooms, which may also explain the differences obtained in classrooms A1 and D2. Two important ideas arise from these results. On the one hand, no clear relation between blower-door and tracer gas measurements was found in the context of classrooms and additional research is required is this area. On the other hand, once again it was confirmed that these are airtight classrooms.
Table 9 - Comparison n50/20 and ACH tests, respectively, in each classroom and school.
Classroom n50/20a ACHb A1 1.07 0.20 B4 0.56 0.50 C2 0.09 0.04 D2 0.52 1.50 E1 0.25 0.20 aNS - nothing sealed;
bCl - windows closed; median of 3 or 4 classrooms.
6 IEQ ASSESSMENT WITH VENTILATION PROTOCOL
The first campaign results enhance the importance of improving classrooms ventilation. After the individual analysis of the classrooms permeability, described in sections 4 and 5, the following step on this investigation was then to improve the ventilation rates by simple adjustments based on a ventilation protocol, which should be implemented in such a manner that classrooms’ comfort conditions are not neglected.
Therefore, in the last measurement campaign (September - October) the parameters of the first campaign were measured during 2-4 days. However, in each school, there were 2 classrooms where specific conditions for cross and single-sided ventilation were imposed (ventilation protocol - VP). The other 2 classrooms, carefully selected as identical to the previous, had no control on the window opening (NVP). In the classrooms with VP, exterior and interior
1 2 3 4 5 6 7 8 9 10 11 12 13 14 15 16 17 18 19 20 21 22 23 24 25 26 27 28 29 30 31 32 33 34 35 36 37 38 39 40 41 42 43 44 45 46 47 48 49 50 51 52 53 54 55 56 57 58 59
5 and 5). Throughout the day users had the possibility to close them, if they felt uncomfortable. Moreover, teachers were encouraged to maintain the door opened during breaks. Hence, the idea was to test a simple and feasible protocol, which afterwards could easily be implemented on day by day basis.
Table 10 shows the average values of air temperature, relative humidity and CO2 concentration
separately for scenarios with and without ventilation protocol. The percent improvement in terms of CO2 concentration is also indicated, with positive values corresponding to a reduction
in concentration.
Table 10 - Air temperature, relative humidity and CO2 concentration (VP and NVP).
School Tint [ºC] RHint [%] CO2[ppm]
VP NVP VP NVP VP NVP Δ % A 24.1 24.7 67 70 978 1436 32 B 27.7 26.6 46 53 788 1279 38 C 26.6 27.0 45 45 1611 1222 -32 D 23.0 24.0 67 66 1059 1576 33 E 26.5 26.6 54 57 768 949 20 F 24.4 24.2 48 51 954 1316 28 H 24.3 22.9 52 64 1370 2485 47
The introduction of a ventilation protocol resulted on an improvement of the IAQ in 6 schools. The only exception was school building C, probably because users (teachers) had the possibility to reject the protocol if they felt uncomfortable and in this school windows opening axis is inside occupied zone (situation that does not occur in the other schools) making it easier to operate. Apart this particular situation, the implementation of the ventilation protocol was positive: the most interesting performance was obtained in school H with a reduction of 47% in the CO2 concentration and even for the less efficient scenario (school E), an improvement of
20% was obtained. Another important result that must be underlined is that the comfort conditions were not neglected with this protocol since no significant difference of temperature between VP and NVP classrooms was found (Kruskal-Wallis test; p > 0.05). However, it is
1 2 3 4 5 6 7 8 9 10 11 12 13 14 15 16 17 18 19 20 21 22 23 24 25 26 27 28 29 30 31 32 33 34 35 36 37 38 39 40 41 42 43 44 45 46 47 48 49 50 51 52 53 54 55 56 57 58 59
important to refer that these results were obtained during autumn; additional measurements must be performed for winter conditions to validate the strategy.
7 CONCLUSIONS
On the first campaign, the IEQ of 32 classrooms was assessed and the following conclusions can be stated: temperature and relative humidity results revealed a performance within the comfort zone with an average temperature above 20.0 ºC and a small dispersion and relative humidity mean values varied between 45% and 65%; IAQ measurements exposed a different situation. Maximum values of CO2 concentration above 3000 ppm were recorded in the 8 school
buildings and in 4 of them this value increased up to 4000 ppm. Regarding the average values, only 2 schools presented a concentration below the limit of 1250 ppm and in 6 buildings the mean value was higher than 1500 ppm and in 2 higher than 2000 ppm; and from these results the importance of improving classrooms ventilation arises.
The permeability tests allowed to conclude that the construction characteristics, including the materials and the technical solutions adopted, namely the ventilation system and aperture mode of the windows, and the buildings’ age are decisive for the air permeability.
Natural ventilation potential was also evaluated through tracer gas measurements of the ACH. The results revealed airtight enclosures and, therefore, additional ventilation must be provided. For that purpose results suggested that both cross and single-sided ventilation have great potential. The choice of opening windows and their location are both important in the design of the school façade as this affects the effectiveness of natural ventilation.
The application of the ventilation protocol, based on a cross and single-sided ventilation strategy, shows a decrease on the CO2 concentration without modifying the comfort conditions.
Yet, results in school C reveal that sometimes protocol implementation is not straightforward
1 2 3 4 5 6 7 8 9 10 11 12 13 14 15 16 17 18 19 20 21 22 23 24 25 26 27 28 29 30 31 32 33 34 35 36 37 38 39 40 41 42 43 44 45 46 47 48 49 50 51 52 53 54 55 56 57 58 59
since the entire concept hinges on the teacher’s willingness. This strategy should continue to be explored and validated for winter conditions.
8 REFERENCES
Al-Rashidi, K., Loveday, D., & Al-Mutawa, N. (2012). Impact of ventilation modes on carbon dioxide concentration levels in Kuwait classrooms. Energy and Buildings, 47(0), 540-549, doi:10.1016/j.enbuild.2011.12.030.
Almeida, R. M. S. F., & de Freitas, V. P. (2014). Indoor environmental quality of classrooms in Southern European climate. Energy and Buildings, 81(0), 127-140, doi:http://dx.doi.org/10.1016/j.enbuild.2014.06.020.
ASHRAE ( 2013). ASHRAE Standard 62.1-2013 Ventilation for Acceptable Indoor Air Quality. Atlanta GA.
ASTM (2011). Standard Test Method for Determining Air Change in a Single Zone by Means of a Tracer Gas Dilution. E 741. West Conshohocken, USA: American Society for Testing and Materials.
Bakó-Biró, Z., Clements-Croome, D. J., Kochhar, N., Awbi, H. B., & Williams, M. J. (2012). Ventilation rates in schools and pupils’ performance. Building and Environment, 48(0), 215-223, doi:10.1016/j.buildenv.2011.08.018.
Beisteiner, A., & Coley, D. A. (2003). Carbon Dioxide Levels and Summertime Ventilation Rates in UK Schools. International Journal Of Ventilation, 1(3), 181-187.
CEN (2001). EN 13829: Thermal performance of buildings - Determination of air permeability of buildings - Fan pressurization method. Brussels: CEN - European Committee for Standardization.
CEN (2006). PD CEN/TR 14788:2006 - Ventilation for buildings. Design and dimensioning of residential ventilation systems. Brussels: CEN - European Committee for Standardization.
Coley, D. A., & Beisteiner, A. (2002). Carbon Dioxide Levels and Ventilation Rates in Schools. International Journal Of Ventilation, 1(1), 45–52.
Conceição, E. Z. E., Gomes, J. M. M., Antão, N. H., & Lúcio, M. M. J. R. (2012). Application of a developed adaptive model in the evaluation of thermal comfort in ventilated kindergarten occupied spaces. Building and Environment, 50(0), 190-201, doi:http://dx.doi.org/10.1016/j.buildenv.2011.10.013.
Conceição, E. Z. E., & Lúcio, M. M. J. R. (2006). Air Quality Inside a School Building : Air Exchange Monitoring, Evolution of Carbon Dioxide and Assessment of Ventilation Strategies. The International Journal of Ventilation, 5(2), 259-270
Corgnati, S. P., Ansaldi, R., & Filippi, M. (2009). Thermal comfort in Italian classrooms under free running conditions during mid seasons: Assessment through objective and subjective approaches. Building and Environment, 44(4), 785-792, doi:http://dx.doi.org/10.1016/j.buildenv.2008.05.023.
De Giuli, V., Da Pos, O., & De Carli, M. (2012). Indoor environmental quality and pupil perception in Italian primary schools. Building and Environment, 56(0), 335-345, doi:10.1016/j.buildenv.2012.03.024.
Franchimon, F., Dijken, F. v., Pernot, C. E. E., & Bronswijk, J. E. M. H. v. Air-exchange rate under debate. In Healthy Buildings 2009, Syracuse, NY, USA, September 13-17 2009
1 2 3 4 5 6 7 8 9 10 11 12 13 14 15 16 17 18 19 20 21 22 23 24 25 26 27 28 29 30 31 32 33 34 35 36 37 38 39 40 41 42 43 44 45 46 47 48 49 50 51 52 53 54 55 56 57 58 59
Frontczak, M., & Wargocki, P. (2011). Literature survey on how different factors influence human comfort in indoor environments. Building and Environment, 46(4), 922-937, doi:http://dx.doi.org/10.1016/j.buildenv.2010.10.021.
Gaitani, N., & Santamouris, M. Energy Efficiency & IAQ Aspects of the School Buildings in Greece. In 34th AIVC Conference, Athens, Greece, September 2013 2013
Gao, J., Wargocki, P., & Wang, Y. (2014). Ventilation system type, classroom environmental quality and pupils' perceptions and symptoms. Building and Environment, 75(0), 46-57, doi:http://dx.doi.org/10.1016/j.buildenv.2014.01.015.
Griffiths, M., & Eftekhari, M. (2008). Control of CO2 in a naturally ventilated classroom. Energy and Buildings, 40(4), 556-560, doi:10.1016/j.enbuild.2007.04.013.
Guedes, M. C., Matias, L., & Santos, C. P. (2009). Thermal comfort criteria and building design: Field work in Portugal. Renewable Energy, 34(11), 2357-2361, doi:10.1016/j.renene.2009.03.004.
Haverinen-Shaughnessy, U., Moschandreas, D. J., & Shaughnessy, R. J. (2011). Association between substandard classroom ventilation rates and students’ academic achievement. Indoor Air, 21(2), 121-131, doi:10.1111/j.1600-0668.2010.00686.x.
Heudorf, U., Neitzert, V., & Spark, J. (2009). Particulate matter and carbon dioxide in classrooms – The impact of cleaning and ventilation. International Journal of Hygiene and Environmental Health, 212(1), 45-55, doi:10.1016/j.ijheh.2007.09.011.
Jenkins, D. P., Peacock, A. D., & Banfill, P. F. G. (2009). Will future low-carbon schools in the UK have an overheating problem? Building and Environment, 44(3), 490-501, doi:10.1016/j.buildenv.2008.04.012.
Madureira, J., Alvim-Ferraz, M. C. M., Rodrigues, S., Gonçalves, C., Azevedo, M. C., Pinto, E., et al. (2009). Indoor Air Quality in Schools and Health Symptoms among Portuguese Teachers. Human and Ecological Risk Assessment: An International Journal, 15(1), 159-169, doi:10.1080/10807030802615881.
Materials, A.-A. S. f. T. a. (2012). ASTM D 6245-12: Standard Guide for Using Indoor Carbon Dioxide Concentrations to Evaluate Indoor Air Quality and Ventilation. ASTM. Mendell, M. J., & Heath, G. A. (2005). Do indoor pollutants and thermal conditions in schools
influence student performance? A critical review of the literature. Indoor Air, 15(1), 27-52, doi:10.1111/j.1600-0668.2004.00320.x.
Montazami, A., & Nicol, F. (2013). Overheating in schools: comparing existing and new guidelines. Building Research & Information, 41(3), 317-329, doi:10.1080/09613218.2013.770716.
Montazami, A., Wilson, M., & Nicol, F. (2012). Aircraft noise, overheating and poor air quality in classrooms in London primary schools. Building and Environment, 52(0), 129-141, doi:http://dx.doi.org/10.1016/j.buildenv.2011.11.019.
Mors, S. t., Hensen, J. L. M., Loomans, M. G. L. C., & Boerstra, A. C. (2011). Adaptive thermal comfort in primary school classrooms: Creating and validating PMV-based comfort
charts. Building and Environment, 46(12), 2454-2461,
doi:http://dx.doi.org/10.1016/j.buildenv.2011.05.025.
Mumovic, D., Palmer, J., Davies, M., Orme, M., Ridley, I., Oreszczyn, T., et al. (2009). Winter indoor air quality, thermal comfort and acoustic performance of newly built secondary schools in England. Building and Environment, 44(7), 1466-1477, doi:10.1016/j.buildenv.2008.06.014.
Mydlarz, C. A., Conetta, R., Connolly, D., Cox, T. J., Dockrell, J. E., & Shield, B. M. (2013). Comparison of environmental and acoustic factors in occupied school classrooms for 11–16 year old students. Building and Environment, 60(0), 265-271, doi:http://dx.doi.org/10.1016/j.buildenv.2012.10.020. 1 2 3 4 5 6 7 8 9 10 11 12 13 14 15 16 17 18 19 20 21 22 23 24 25 26 27 28 29 30 31 32 33 34 35 36 37 38 39 40 41 42 43 44 45 46 47 48 49 50 51 52 53 54 55 56 57 58 59
Ramalho, O., Mandin, C., Ribéron, J., & Wyart, G. (2013). Air Stuffiness and Air Exchange Rate in French Schools and Day-Care Centres. The International Journal of Ventilation, 12(2).
Santamouris, M., Synnefa, A., Asssimakopoulos, M., Livada, I., Pavlou, K., Papaglastra, M., et al. (2008). Experimental investigation of the air flow and indoor carbon dioxide concentration in classrooms with intermittent natural ventilation. Energy and Buildings, 40(10), 1833-1843, doi:10.1016/j.enbuild.2008.04.002.
Satish, U., Mendell, M., Shekhar, K., Hotchi, T., Sullivan, D., Streufert, S., et al. (2012). Is CO2 an Indoor Pollutant? Direct Effects of Low-to-Moderate CO2 Concentrations on Human Decision-Making Performance. Environ Health Perspect(120), 1671–1677, doi:http://dx.doi.org/10.1289/ehp.1104789.
Shendell, D. G., Prill, R., Fisk, W. J., Apte, M. G., Blake, D., & Faulkner, D. (2004). Associations between classroom CO2 concentrations and student attendance in Washington and Idaho. Indoor Air, 14(5), 333-341, doi:10.1111/j.1600-0668.2004.00251.x.
Sundell, J., Levin, H., Nazaroff, W. W., Cain, W. S., Fisk, W. J., Grimsrud, D. T., et al. (2011). Ventilation rates and health: multidisciplinary review of the scientific literature. Indoor Air, 21(3), 191-204, doi:10.1111/j.1600-0668.2010.00703.x.
Teli, D., James, P. A. B., & Jentsch, M. F. (2013). Thermal comfort in naturally ventilated primary school classrooms. Building Research and Information, 41(3), 301-316. Teli, D., Jentsch, M. F., & James, P. A. B. (2012). Naturally ventilated classrooms: An
assessment of existing comfort models for predicting the thermal sensation and preference of primary school children. Energy and Buildings, 53(0), 166-182, doi:http://dx.doi.org/10.1016/j.enbuild.2012.06.022.
Teli, D., Jentsch, M. F., James, P. A. B., & Bahaj, A. S. Overheating risk evaluation of school classrooms. In Proceedings, World Renewable Energy Congress 2011, Linköping, Sweden, 08 Apr - 11 May 2011 2011
Wargocki, P., & Wyon, D. P. (2007). The Effects of Moderately Raised Classroom Temperatures and Classroom Ventilation Rate on the Performance of Schoolwork by
Children (RP-1257). HVAC&R Research, 13(2), 193-220,
doi:10.1080/10789669.2007.10390951.
Wargocki, P., & Wyon, D. P. (2013). Providing better thermal and air quality conditions in school classrooms would be cost-effective. Building and Environment, 59(0), 581-589, doi:http://dx.doi.org/10.1016/j.buildenv.2012.10.007.
WHO (2005). Effects of Air Pollution on Children's Health and Development: a review of the evidence. In B. O. WHO European Centre for Environment and Health (Ed.), (pp. 191). Copenhagen, Denmark: World Health Organisation Regional Office for Europe. WHO European Centre for Environment and Health, B. O. (2011). Methods for monitoring
indoor air quality in schools. Copenhagen, Denmark: WHO - World Health Organization. 1 2 3 4 5 6 7 8 9 10 11 12 13 14 15 16 17 18 19 20 21 22 23 24 25 26 27 28 29 30 31 32 33 34 35 36 37 38 39 40 41 42 43 44 45 46 47 48 49 50 51 52 53 54 55 56 57 58 59