BRAZILIAN JOURNAL OF OCEANOGRAPHY, 58(3):189-205, 2010
PHYTOPLANKTON DYNAMICS IN A HIGHLY EUTROPHIC
ESTUARY IN TROPICAL BRAZIL
Marilene Felipe Santiago1*,Maria da Glória Gonçalves da Silva-Cunha1, Sigrid Neumann-Leitão1, Kátia Muniz Pereira da Costa1, Gislayne Cristina Borges Palmeira1,
Fernando de Figueiredo Porto Neto2 and Fabiana Santana Nunes1
1
Universidade Federal de Pernambuco - Departamento de Oceanografia (Av. Arquitetura s/n, Cidade Universitária, 50 601-910 Recife, PE, Brasil)
2
Universidade Federal Rural de Pernambuco - Departamento de Zootecnia (Rua Dom Manoel de Medeiros, s/n, Dois Irmãos, 52171-900 Recife, PE, Brasil)
*Corresponding author: [email protected]
A
B S T R A C TThe port of Recife in northeastern Brazil is an important ecological and social area but little is known about its environmental quality. Observations, sampling and measurements of phytoplankton were performed during spring and neap tides in the dry (January-February, 2005) and rainy (June, 2005) seasons to assess the environmental quality of the port of Recife. The area had chlorophyll-a concentrations ranging from 3.30 to 54.40 mg m-3, the highest values occurring at low tide during the dry season. A total of 129 species were identified: 53 of them in the dry season and 97 in the rainy season. Diatoms were the most diverse group and comprised 75.47% of the phytoplankton collected in the dry season and 60.82% of those collected in the rainy season. The dry season was characterized by Coscinodiscus sp. and Helicotheca tamesis; the rainy season by Oscillatoria sp. and
Coscinodiscus centralis. Species diversity indices varied from 1.06 to 3.74 bits cel-1. Low indices were related to the dominance of Helicotheca tamesis, Coscinodiscus centralis, Coscinodiscus sp. and Aulacoseira granulata. Seasonal forcing, rather than the estuarine flux, determined the phytoplankton community structure. The area is exposed to seasonally varying negative impacts due to metropolitan degradation and the high level of eutrophication.
R
E S U M OPara avaliar a qualidade ambiental Porto do Recife (Nordeste do Brasil), uma área ecológica e socialmente importante mas pouco investigada, observações, medições e amostragem do fitoplâncton foram realizadas durante as marés de sizígia e quadratura no período de estiagem (janeiro-fevereiro / 2005) e chuvoso (junho/2005). A área apresentou concentração de clorofila a variando de 3,30 a 54,40 mg m-3, com maiores valores registrados durante a maré baixa no período de estiagem. Um total de 129 espécies foi identificada com 53 espécies durante o período de estiagem e 97 espécies no chuvoso. As diatomáceas formaram o grupo mais diverso, com 75,47% no período de estiagem e 60,82% no chuvoso. Coscinodiscus sp. e Helicotheca tamesis caracterizaram o período de estiagem e
Oscillatoria sp. e Coscinodiscus centralis o período chuvoso. A diversidade de espécie variou de
1,06 a 3,74 bits cel-1. Os baixos índices foram relacionados com a dominância de Helicotheca
tamesis, Coscinodiscus centralis, Coscinodiscus sp. e Aulacoseira granulata. A sazonalidade
determinou a estrutura da comunidade fitoplanctônica, em vez do fluxo estuarino. A área é exposta sazonalmente a vários impactos negativos, devido à degradação metropolitana e ao elevado nível de eutrofização.
Descriptors: Phytoplankton, Port, estuary, Diurnal variation, Tropical. Descritores: Fitoplâncton, Porto, Estuário, Variação diurnal, Tropical.
I
NTRODUCTIONThe Pina Basin Estuaray is located in the metropolitan area of Recife in Pernambuco State, northeastern Brazil. As with many other tropical coastal areas, it is threatened by the diverse human uses of this body of water and the land areas that drain
into it. Consequently, the port basin presents a multitude of environmental problems. The most common problems are degraded natural habitats, declining plant and animal populations, diminishing fish and shellfish harvests and impaired water quality.
circulation patterns and fluctuations of input influences (e.g., Capibaribe River, Beberibe River, Tejipió River, sewage flow) induce high temporal variability on scales ranging from hours to seasons. This variability may be reflected in population dynamics, especially those of phytoplankton populations thriving in coastal systems.
Phytoplankton species can be used as a diagnostic tool in determining ecosystem quality (MAGUIRE, 1973; RESH, UNZICKER, 1975; DAY JR. et al., 1989). Previous research has identified biotic and abiotic factors that regulate primary productivity and has developed models that describe phytoplankton growth dynamics under specific environmental conditions (BAIRD et al., 2001).
Phytoplankton communities are highly complex multispecies communities in terms of their diversity and dynamics. Succession shifts in phytoplankton community structure are primarily due to changes in environmental variables (e.g., degree or type of nutrient limitation) and/or shifts in higher trophic levels (e.g., microzooplankton to mesozooplankton) (MILLER et al., 1995; GILBERT, 1998; LEWITUS et al., 1998; RIEGMAN; NOORDELOOS, 1998; RABOUILLE et al., 2001; FERNANDES; BRANDINI, 2004).
The influence of environmental variables and preferential grazing by herbivores on phytoplankton community composition is not well understood, particularly in harbor areas under extremely impacted influx. Identifying the ecological variables that regulate phytoplankton community structure is essential for facilitating the elaboration of broad hypotheses of pervasive environmental issues, such as eutrophication and harmful algal blooms
(SMAYDA, 1997; RIEGMAN; FLAMELING;
NOORDELOOS 1998; MAFRA JUNIOR et al., 2006). Since one of the most important factors affecting variability in the port of Recife and its basin is the tide, accurate estimates of the plankton requires sampling over a 24 h period (McLUSKY; ELLIOTT, 2004).
One question addressed in this study is whether the abiotic phenomena of the port basin of Recife (e.g., circulation patterns, tides) and water condition are related to identifiable phytoplankton assemblages or abundance patterns.
Despite the ecological and social importance of the port of Recife, few investigations of phytoplankton composition have been conducted in the harbor or in nearby areas (FEITOSA; PASSAVANTE, 1990; 1991/1993; FEITOSA et al., 1999; NASCIMENTO et al., 2003).
Many studies have been dedicated to the temporal variability of phytoplankton densities in marine systems (SOROKIN, 1995), but few data are
available on the dynamics of tropical harbor phytoplankton communities.
The main objective of the present study was to study temporal changes of phytoplankton and hydrographic parameters in the highly polluted port basin of Recife in northeastern Brazil.
S
TUDYA
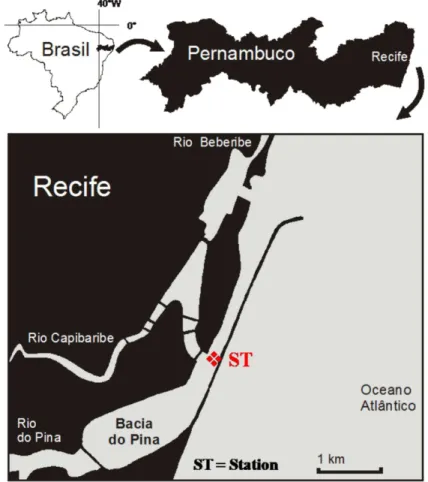
REAThe Port Basin Estuary is located in Recife, the capital of Pernambuco State, Brazil. Recife is the main urban center of northeastern Brazil and lies partly on the mainland and partly on the island. Dissected by waterways, it is often called the “Brazilian Venice” (Fig. 1).
This area has a hot and humid tropical climate and is categorized as Group A on the Köppen Scale. Annual average air and water temperatures are around 25°C, the annual minimum being 24ºC and the maximum 31ºC. Relative humidity varies from 80% to 90% and annual rainfall ranges from 1760 mm to 2270 mm, with 80% of it occurring between April and July (the rainy season). The dominant wind is from the southeast (ARAGÃO, 2004).
The maximum tidal height (during extreme spring tides) at the port is around 3 m, with an annual high tide average of 2.6 m during spring tides and 1.6 m during neap tides. There are two natural access channels to the port. The main access channel, South Channel, is approximately 260 m wide and 3.4 km long with a depth of 10.5 m. The North Channel, only used by smaller vessels, is narrower, being approximately 1.0 km long and 6.5 m deep. The basin constitutes a shallow, restricted environment that receives large quantities of untreated sewage and is, therefore, polluted, eutrophic and hypoxic.
M
ATERIAL ANDM
ETHODSSampling was carried out at one fixed station located at the confluence of the port of Recife, the Capibaribe River and the Pina Basin (08º04'01" S and 34º52'06"W), called the Port basin (Fig. 1). Sampling was conducted on two consecutive days during the dry season (January 25-26 and February 02-03, 2005) and the rainy season (June 07-08 and 14-15, 2005) at spring and neap tides during the diurnal high, low, flood and ebb tides.
al., 1983) and suspended particulate material (BAUMGARTEN et al., 1996). The following parameters were measured in situ : water temperature (Hanna digital thermometer), salinity (refractometer) and water transparency (Secchi disc). Chlorophyll-a was collected with a 1 liter Van Dorn bottle at the surface and measured using a Micronal B280 spectrophotometer (PARSONS; STRICKLAND, 1963; WETZEL; LINKENS, 1991).
Phytoplankton sampling was conducted with a plankton net (mesh size 64 µm) fitted with a flowmeter. Three-minute horizontal surface hauls were carried out. After collection, samples were preserved in a 4% buffered formaldehyde/seawater solution (NEWELL; NEWELL, 1963).
In the laboratory, 300 mL samples were homogenized and a 1 mL subsample was analyzed under a compound microscope. Each cell, colony or filamentous alga was counted as an individual and expressed as relative abundance (%). Identification was based on the phytoplankton literature
(PÉRAGALLO; PÉRAGALLO, 1897-1908;
HUSTEDT, 1930-1966; CUPP, 1943;
DESIKACHARY, 1959; SOURNIA, 1967; 1986; PRESCOTT, 1975; PARRA et al., 1982; TOMAS, 1996; KOMÁREK; ANAGNOSTIDIS, 2000).
The Shannon index was used to estimate the community diversity (SHANNON, 1948).
Cluster analysis of the sample-species data matrix was also performed, using the Bray & Curtis method. The Weighted Pair Group Method, using arithmetic averages, was the link method used for the dendrograms (WPGMA) (LEGENDRE; LEGENDRE, 1998). A cophenetic value matrix was applied to test the adequacy of fit of the cluster analysis (ROHLF; FISHER, 1968). A Principal Component Analysis was computed based on a matrix formed by richness, diversity, chlorophyll-a and hydrological data. Data analyses were carried out using the Numerical Taxonomy and Multivariate Analyses System (NTSYS ver. 1.30, Metagraphics Software Corporation, California, USA, 1987).
Fig. 1. Study area and sampling station (ST) in the Port Basin of Recife (Pernambuco, Brazil).
A non-parametric Kruskal-Wallis test was applied (BioEstat 3.0) to test significant differences (p<0.05) between dry and rainy seasons and between tides, based on the physicochemical and biological parameters.
R
ESULTSPhysical Environment
No significant difference (p>0.5) in the abiotic parameters (water temperature, salinity, transparence, particulate organic material, pH, dissolved oxygen, dissolved oxygen saturation tax,
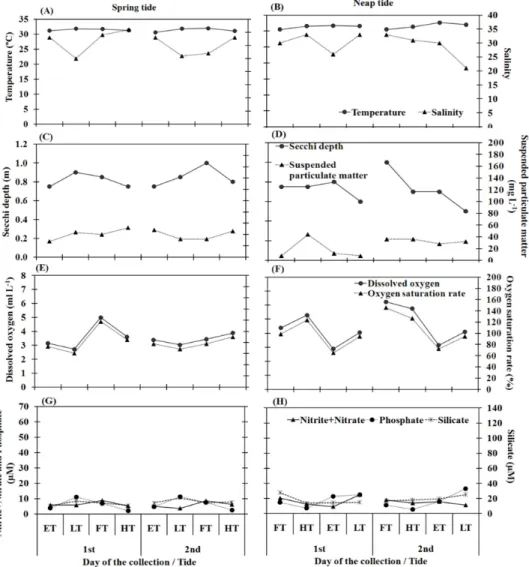
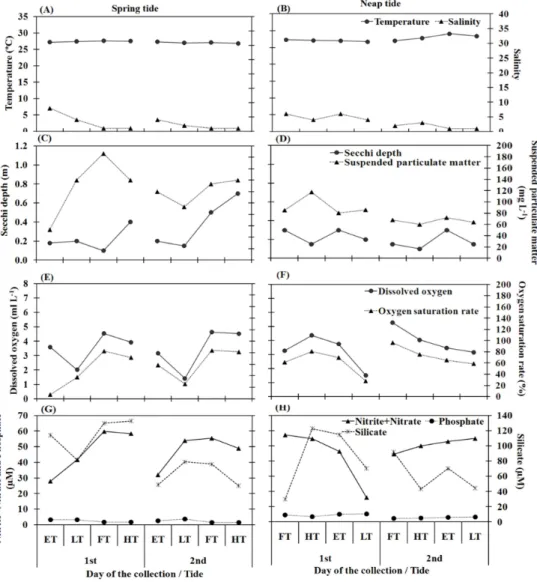
nitrite+nitrate, phosphate and silicate) was found between spring and neap tides. Water temperature varied between 27°C and 32.6°C, the higher values being recorded in the late morning and early afternoon when the sunlight was more intense. Salinity varied between 21 and 36 during the dry season and ranged from 1 to 8 during the rainy season (Figs 2A, B; Figs 3A, B). Water transparency varied from 0.1 m to 1.0 m and higher values were recorded during the flood tide of the spring and neap tides in both seasons (Figs 2C, D; Figs 3C, D). The pH was > 7.0 the larger part of the time. In general, temperature, salinity, transparency and pH were significantly higher during the dry season (p<0.05).
Fig. 3. Temporal variation of abiotic variables in the Port Basin of Recife Estuary (Pernambuco, Brazil) during the rainy season (June 07-08 and 14-15, 2005). Note: ST = spring tide, NT = neap tide, ET = ebb tide, LT = low tide, FT = flood tide and HT = high tide.
The suspended particulate material (SPM) varied from 8.0 mg L-1 to 187 mg L-1, with higher values during flood and high tides in the rainy season (Figs 2C, D; Fig. 3C, D).
No significant difference (p>0.05) was found between ebb tide (ET), low tide (LT), flood tide (FT) and high tide (HT) in terms of temperature, salinity, pH, transparency and suspended particulate material. However, significant differences were found between dry and rainy seasons (p=0.000).
The dissolved oxygen was lower during low tide and higher during the spring and neap flood tides (Figs 2E, F; Fig. 3E, F). The minimum value was 2.72 ml L-1 and the maximum was 6.24 ml L-1, with
significant differences between ET and LT (p=0.006), ET and HT (p=0.010), LT and FT (p=0.001) and LT and HT (p=0.002). However, no significant differences were observed between tidal stages (ET, FT, LT, and HT) or between dry and rainy seasons (p>0.05). The dissolved oxygen saturation rate ranged from 6.93% to 145.45%, with lower values in the rainy season during low tide and higher values in the dry season during flood and high tide (Figs 2E, F; Figs 3E, F). Significant differences occurred between ET and FT (p=0.006), ET and HT (p=0.013), LT and FT (p=0.007) and LT and HT (p=0.014) and between seasons (p=0.004).
Nitrite+nitrate ranged between 3.80 µM and 59.75 µM. Silicate ranged between 10.70 µM and 133.89 µM, with highest concentrations during the rainy season (Figs 2G, H; Figs 3G, H). No significant differences were found among tidal stages (ET, LT, FT, HT). Significant differences occurred between dry and rainy seasons (p=0.000).
In general, silicate content presented a similar distribution to nitrite + nitrate, with highest values in the rainy season (Figs 2G, H; Fig. 3G, H). However, concentrations higher than 10.70 µM in any season indicate that the environment has a great abundance of this nutrient. Significant differences were recorded between seasons (p<0.05) but no differences were found among tidal stages.
The phosphate varied from 1.50 µM to 16.40 µM and was abundant during the dry season (Figs 2G, H; Fig. 3G, H). Significant differences were observed between ET and HT (p=0.035), LT and HT (p=0.001) and between dry and rainy seasons (p=0.000).
Phytoplankton
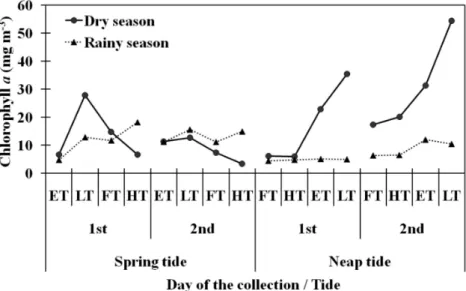
Chlorophyll-a concentrations varied between 3.30 mg m-3 and 54.40 mg m-3, with higher values at the low neap tide during the dry season (Figs 4A, B, C, D). There was no significant difference among tidal stages or between seasons.
A total of 127 taxa were identified: 52 in the dry season and 95 in the rainy season. In both seasons, diatoms were the group that most contributed to species richness. There were 40 diatom taxa (76.92%) in the dry season and 58 (61.05%) in the rainy season. There were 7 chlorophyte taxa (13.46 %) in the dry
season and 21 (22.11%) in the rainy season. Cyanobacteria were present with 4 taxa (7.69%) in the dry season and 13 taxa (13.68%) in the rainy season. Dinoflagellates were present only in the dry season with one taxon (1.92%) and the euglenophytes were present only in the rainy season with three taxa (3.16%) (Table 1).
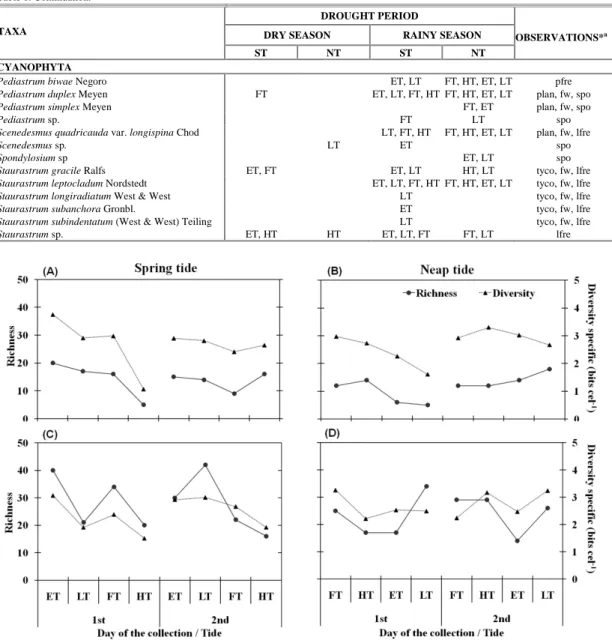
The taxonomic richness ranged from 5 to 42, with highest values during the rainy season (Figs 5A, B, C, D) and significant seasonal differences (p=0.000).
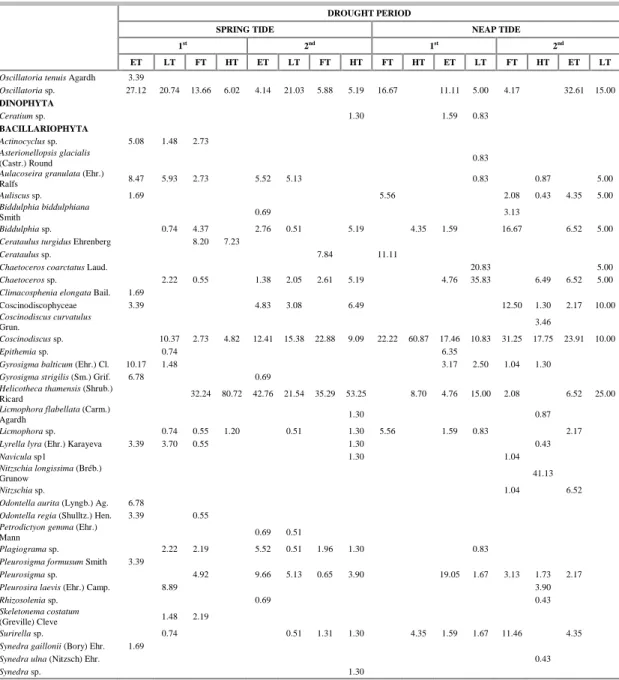
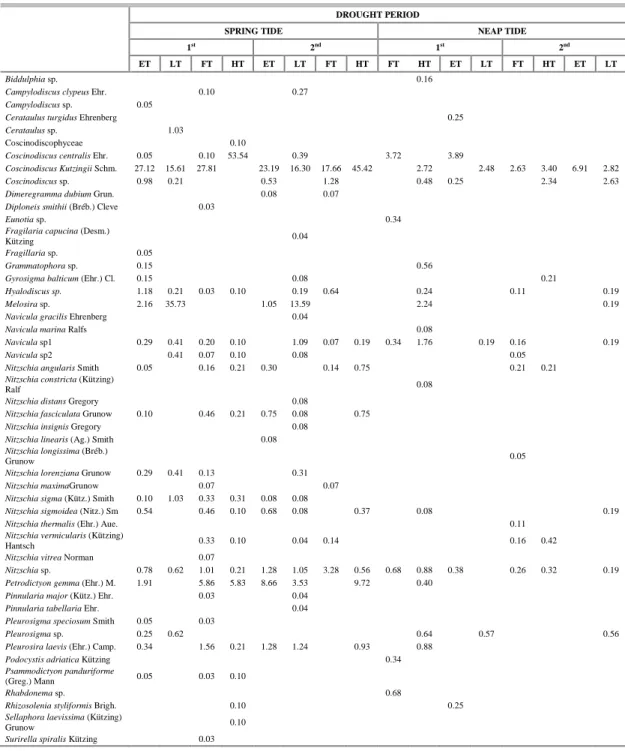
The phytoplankton community was dominated by Helicotheca tamesis (Shrubsole) Ricard (80.72%) during the dry season at the spring tide and by Coscinodiscus sp. (60.87%) at neap tide (Table 2). In the rainy season, Coscinodiscus centralis Ehrenberg (53.54%) dominated in the spring tide and Oscillatoria sp. (56.16%) in the neap tide (Table 3).
Most taxa (62.59%) occurred sporadically, followed by those of low frequency of occurrence (28.78%), of frequent occurrence (7.19%) and of very frequent occurrence (1.44%). The species Oscillatoria sp. (84.38%) and Aulacoseira granulata (Ehrenberg) Ralfs (71.88%) were the most frequent (Table 1).
The specific diversity index ranged from 1.06 bits cel-1 (high tide) to 3.74 bits cel-1 (ebb tide) during spring tide in the dry season (Fig. 5A, B, C, D). Low species diversity was caused by the dominance of Helicotheca tamesis, Coscinodiscus centralis, Coscinodiscus kutzingii Schmidt and Aulacoseira granulate (Table 2; Table 3). There was no significant difference among tidal stages or between seasons.
Table 1. Microphytoplankton species checklist for the Pina Basin Estuary, Recife, Brazil, during the dry season (January 25-26 and February 02-03, 2005) and rainy season (June 07-08 and 14-15, 2005). *a Comments: Habitat and species typical or frequent in areas: plan = planktonic, tyco = tycoplanktonic, fw = freshwater algal, est = estuarine, ner = neritic, oc = oceanic, vfre = very frequent species, fre = frequent species, lfre = low frequency species, espo = sporadic species. Note: ST= spring tide, NT = neap tide, ET = ebb tide, LT = low tide, FT = flood tide and HT = high tide.
DROUGHT PERIOD
DRY SEASON RAINY SEASON TAXA
ST NT ST NT
OBSERVATIONS*a
CYANOPHYTA
Anabaena sp. ET ET, LT, FT, HT FT, HT, ET, LT lfre
Chrooccocus dispersus (Keissler) Lemmermann HT FT, HT, ET plan, fw, vfre
Chrooccocus minor (Kützing) Naegeli LT tyco, fw, spo
Chrooccocus sp. LT spo
Dactylococcosis acicularis Lemmermann ET plan, fw, spo
Geitlerinema sp. ET, LT, FT LT, FT, HT vfre
Lyngbya versicolor (Wartmann) Gomont ET, LT, FT FT, HT, ET, LT tyco, fw, spo
Lyngbya sp. FT LT fre
Merismopedia tenuissima Lemmermann LT tyco, fw, spo
Oscillatoria princeps Vaucher ET, LT tyco, fw, spo
Oscillatoria tenuis Agardh ET ET, LT, FT FT, HT, ET, LT tyco, fw, spo
Oscillatoria sp. ET, LT, FT, HT FT, HT, ET ET, LT, FT FT, HT, ET, LT vfre
Phormidium sp. ET spo
Planktolyngbya microspira Kom. & Cronb. ET, LT, FT FT, HT, ET, LT plan, fw, lfre
EUGLENOPHYTA
Euglena acus Ehrenberg ET LT plan, fw, spo
Euglena spirogyra Ehrenberg LT plan, fw, spo
Euglena sp. LT spo
DINOPHYTA
Ceratium sp. HT FT, HT spo
BACILLARIOPHYTA
Actinocyclus sp. ET, LT, EM spo
Amphiprora paludosa Smith ET tyco, ner, spo
Amphiprora sp. ET spo
Anomoeoneis serians (Brébisson) Cleve ET tyco, fw, spo
Asterionellopsis glacialis (Castracane) Round HT tyco, ner, spo
Aulacoseira granulata (Ehrenberg) Ralfs ET, LT, FT HT, LT ET, LT, FT, HT FT, HT, ET, LT plan, fw, vfre
Auliscus sp. ET FT, HT, ET, LT lfre
Biddulphia biddulphiana Smith ET ET tyco, ner, spo
Biddulphia tridens Ehrenberg LT tyco, ner, spo
Biddulphia sp. ET, LT, FT, HT FT, HT, ET, LT LT lfre
Campylodiscus clypeus Ehrenberg LT, FT tyco, ner, spo
Campylodiscus sp. ET spo
Cerataulus turgidus Ehrenberg FT, HT FT tyco, ner, spo
Cerataulus sp. FT ET spo
Chaetoceros coarctatus Lauder HT plan, oc, spo
Chaetoceros sp. ET, LT, FT, HT FT, HT, LT lfre
Climacosphenia elongata Bailey ET tyco, ner, spo
Coscinodiscus centralis Ehrenberg ET, LT, FT, HT ET, FT plan, oc, lfre
Coscinodiscus curvatulus Grunow LT plan, oc, spo
Coscinodiscus kutzingii Schmidt ET, LT, FT, HT FT, HT, ET, LT plan, oc, lfre
Coscinodiscus sp. ET, LT, FT, HT FT, HT, ET, LT ET, FT FT, HT, LT fre
Dimerogramma dubium Grunow ET, FT tyco, ner, spo
Diploneis smithii (Brébisson) Cleve FT tyco, ner, spo
Epithemia sp. LT FT spo
Eunotia sp. ET spo
Fragilaria capucina (Desmazière) Kützing LT tyco, fw, spo
Fragillaria sp. ET spo
Grammatophora sp. ET LT spo
Gyrosigma balticum (Ehrenberg) Cleve ET, LT FT, HT, ET, LT ET, LT LT plan, est, lfre
Gyrosigma strigilis (Smith) Griffith & Henfrey ET spo
Helicotheca tamensis (Shrubsole) Ricard ET, LT, FT, HT FT, HT, ET, LT plan, ner, lfre
Hyalodiscus sp. ET, LT, FT, HT HT, ET, LT lfre
Licmophora flabellata (Carmichael) Agardh HT LT tyco, ner, spo
Licmophora sp. LT, FT, HT HT, ET, FT lfre
Lyrella lyra (Ehrenberg) Karayeva ET, LT, FT LT tyco, ner, lfre
Table 1. Continuation
DROUGHT PERIOD
DRY SEASON RAINY SEASON TAXA
ST NT ST NT
OBSERVATIONS*a
CYANOPHYTA
Melosira sp. ET, LT HT, LT lfre
Navicula gracilis Ehrenberg LT tyco, ner, esp
Navicula marina Ralfs LT tyco, ner, spo
Navicula spp HT ET ET, LT, FT, HT FT, HT, ET, LT spo
Nitzschia angularis Smith ET, FT, HT ET, LT tyco, est, lfre
Nitzschia constricta (Kützing) Ralf LT tyco, ner, spo
Nitzschia distans Gregory FT plan, oc, spo
Nitzschia fasciculata Grunow ET, LT, FT, HT est, lfre
Nitzschia insignis Gregory FT tyco, est, spo
Nitzschia linearis (Agardh) Smith ET tyco, fw, spo
Nitzschia longissima (Brébisson) Grunow LT ET tyco, fw, spo
Nitzschia lorenziana Grunow ET, LT, FT tyco, fw, spo
Nitzschia máxima Grunow FT est, spo
Nitzschia sigma (Kützing) Smith ET, LT, FT, HT tyco, fw, lfre
Nitzschia sigmoidea (Nitzch) Smith ET, LT, FT, HT HT, LT plan, oc, lfre
Nitzschia thermalis (Ehrenberg) Auerswald ET spo
Nitzschia vermicularis (Kützing) Hantsch LT, FT, HT ET, LT ner, lfre
Nitzschia vitrea Norman FT fw, spo
Nitzschia sp. FT, ET ET, LT, FT, HT FT, HT, ET, LT spo
Odontella aurita (Lyngbye) Agardh ET tyco, ner, spo
Odontella regia (Shulltz.) Hendey ET, FT tyco, ner, spo
Petrodictyon gemma (Ehrenberg) Mann ET, LT ET, LT, FT, HT LT tyco, ner, lfre
Pinnularia major (Kützing) Ehrenberg LT, FT tyco, ner, spo
Pinnularia tabellaria Ehrenberg LT tyco, ner, spo
Plagiograma sp. ET, LT, FT, HT HT lfre
Pleurosigma formusum Smith ET tyco, est, spo
Pleurosigma speciosum Smith ET, FT tyco, ner, spo
Pleurosigma sp. ET, LT, FT, HT FT, HT, ET, LT ET HT, LT fre
Pleurosira laevis (Ehrenberg) Campère LT LT ET, LT, FT, HT LT tyco, ner, lfre
Podocystis adriatica Kützing ET tyco, ner, spo
Psammodictyon panduriforme (Gregory) Mann ET, FT, HT tyco, ner, spo
Rhabdonema sp. spo
Rhizosolenia styliformis Brightwell HT FT plan, oc, spo
Rhizosolenia sp. ET LT spo
Sellaphora laevissima (Kützing) Grunow HT tyco, oc, spo
Skeletonema costatum (Greville) Cleve LT, FT plan, ner, spo
Surirella spiralis Kützing FT tyco, es, spo
Surirella striatula Jurpin FT tyco, es, spo
Surirella sp. LT, FT, HT FT, HT, ET, LT FT, HT FT, HT, ET, LT spo
Synedra gaillonii (Bory) Ehrenberg ET tyco, est, spo
Synedra ulna (Nitzsch) Ehrenberg LT tyco, fw, spo
Synedra sp. HT FT spo
Tabellaria flocculosa (Roth) Kützing LT tyco, fw, spo
Terpsinoe americana Bailey LT tyco, est, spo
Terpsinoe musica Ehrenberg ET, LT HT tyco, est, spo
Thalassiosira eccentrica (Ehrenberg) Cleve ET LT plan, oc, esp
Thalassiosira sp. ET, LT, FT FT, HT, ET, LT fre
Triceratium alternans Bailey LT tyco, ner, spo
Triceratium antedeluvianum (Ehrenberg) Grunow ET tyco, ner, spo
Triceratium pentacrinus (Ehrenberg) Wallicia ET LT tyco, ner, spo
CHLOROPHYTA
Actinastrum hantzschii Lagerheim FT, HT, ET plan, fw, spo
Ankistrodesmus falcatus (Corda) Ralfs Wille LT FT, ET, LT plan, fw, lfre
Ankistrodesmus longissimus Lemmerman ET, LT, FT FT, HT, ET, LT plan, fw, lfre
Closterium dianae Ehrenberg ET plan, fw, spo
Closterium rostratum Ehrenberg ET HT, LT plan, fw, spo
Closterium setaceum Ehrenberg FT plan, fw, spo
Closterium striolatum Ehrenberg FT plan, fw, spo
Closterium sp. ET LT spo
Coelastrum microporum Naegeli LT tyco, fw, spo
Microspora sp. ET spo
Table 1. Continuation.
DROUGHT PERIOD
DRY SEASON RAINY SEASON TAXA
ST NT ST NT
OBSERVATIONS*a
CYANOPHYTA
Pediastrum biwae Negoro ET, LT FT, HT, ET, LT pfre
Pediastrum duplex Meyen FT ET, LT, FT, HT FT, HT, ET, LT plan, fw, spo
Pediastrum simplex Meyen FT, ET plan, fw, spo
Pediastrum sp. FT LT spo
Scenedesmus quadricauda var. longispina Chod LT, FT, HT FT, HT, ET, LT plan, fw, lfre
Scenedesmus sp. LT ET spo
Spondylosium sp ET, LT spo
Staurastrum gracile Ralfs ET, FT ET, LT HT, LT tyco, fw, lfre
Staurastrum leptocladum Nordstedt ET, LT, FT, HT FT, HT, ET, LT tyco, fw, lfre
Staurastrum longiradiatum West & West LT tyco, fw, lfre
Staurastrum subanchora Gronbl. ET tyco, fw, lfre
Staurastrum subindentatum (West & West) Teiling LT tyco, fw, lfre
Staurastrum sp. ET, HT HT ET, LT, FT FT, LT lfre
Fig. 5. Temporal variation of biotic variables in the Port Basin of Recife Estuary (Pernambuco, Brazil) during the dry season (January 25-26 and February 02-03, 2005) (A, B) and rainy season (June 07-08 and 14-15, 2005) (C, D). Note: ST = spring tide, NT = neap tide, ET = ebb tide, LT = low tide, FT = flood tide and HT = high tide.
Table 2. Relative abundance (%) of the microphytoplankton species in the Pina Basin Estuary, Recife, Brazil, during the dry season (January 25-26 and February 02-03, 2005). Note: ST = spring tide, NT = neap tide, ET = ebb tide, LT = low tide, FT = flood tide and HT = high tide.
DROUGHT PERIOD
SPRING TIDE NEAP TIDE
1st
2nd
1st
2nd
ET LT FT HT ET LT FT HT FT HT ET LT FT HT ET LT
CYANOPHYTA
Anabaena sp. 1.69
Oscillatoria princeps
Vaucher 1.69 0.74
Table 2. Continuation.
DROUGHT PERIOD
SPRING TIDE NEAP TIDE
1st
2nd
1st
2nd
ET LT FT HT ET LT FT HT FT HT ET LT FT HT ET LT
Oscillatoria tenuis Agardh 3.39
Oscillatoria sp. 27.12 20.74 13.66 6.02 4.14 21.03 5.88 5.19 16.67 11.11 5.00 4.17 32.61 15.00
DINOPHYTA
Ceratium sp. 1.30 1.59 0.83
BACILLARIOPHYTA
Actinocyclus sp. 5.08 1.48 2.73
Asterionellopsis glacialis
(Castr.) Round 0.83
Aulacoseira granulata (Ehr.)
Ralfs 8.47 5.93 2.73 5.52 5.13 0.83 0.87 5.00
Auliscus sp. 1.69 5.56 2.08 0.43 4.35 5.00
Biddulphia biddulphiana
Smith 0.69 3.13
Biddulphia sp. 0.74 4.37 2.76 0.51 5.19 4.35 1.59 16.67 6.52 5.00
Cerataulus turgidus Ehrenberg 8.20 7.23
Cerataulus sp. 7.84 11.11
Chaetoceros coarctatus Laud. 20.83 5.00
Chaetoceros sp. 2.22 0.55 1.38 2.05 2.61 5.19 4.76 35.83 6.49 6.52 5.00
Climacosphenia elongata Bail. 1.69
Coscinodiscophyceae 3.39 4.83 3.08 6.49 12.50 1.30 2.17 10.00
Coscinodiscus curvatulus
Grun. 3.46
Coscinodiscus sp. 10.37 2.73 4.82 12.41 15.38 22.88 9.09 22.22 60.87 17.46 10.83 31.25 17.75 23.91 10.00
Epithemia sp. 0.74 6.35
Gyrosigma balticum (Ehr.) Cl. 10.17 1.48 3.17 2.50 1.04 1.30
Gyrosigma strigilis (Sm.) Grif. 6.78 0.69
Helicotheca thamensis (Shrub.)
Ricard 32.24 80.72 42.76 21.54 35.29 53.25 8.70 4.76 15.00 2.08 6.52 25.00
Licmophora flabellata (Carm.)
Agardh 1.30 0.87
Licmophora sp. 0.74 0.55 1.20 0.51 1.30 5.56 1.59 0.83 2.17
Lyrella lyra (Ehr.) Karayeva 3.39 3.70 0.55 1.30 0.43
Navicula sp1 1.30 1.04
Nitzschia longissima (Bréb.)
Grunow 41.13
Nitzschia sp. 1.04 6.52
Odontella aurita (Lyngb.) Ag. 6.78
Odontella regia (Shulltz.) Hen. 3.39 0.55 Petrodictyon gemma (Ehr.)
Mann 0.69 0.51
Plagiograma sp. 2.22 2.19 5.52 0.51 1.96 1.30 0.83
Pleurosigma formusum Smith 3.39
Pleurosigma sp. 4.92 9.66 5.13 0.65 3.90 19.05 1.67 3.13 1.73 2.17
Pleurosira laevis (Ehr.) Camp. 8.89 3.90
Rhizosolenia sp. 0.69 0.43
Skeletonema costatum
(Greville) Cleve 1.48 2.19
Surirella sp. 0.74 0.51 1.31 1.30 4.35 1.59 1.67 11.46 4.35
Synedra gaillonii (Bory) Ehr. 1.69
Synedra ulna (Nitzsch) Ehr. 0.43
Table 2. Continuation.
DROUGHT PERIOD
SPRING TIDE NEAP TIDE
1st
2nd
1st
2nd
ET LT FT HT ET LT FT HT FT HT ET LT FT HT ET LT
Tabellaria flocculosa (Roth)
Kützing 0.74
Thalassiosira eccentrica (Ehr.)
Cleve 5.08
Thalassiosira sp. 37.04 21.31 4.83 23.59 21.57 38.89 21.74 26.98 2.50 9.38 17.75 2.17 5.00
Triceratium pentacrinus (Ehr.)
Wal. 1.69 0.43
CHLOROPHYTA
Closterium sp. 1.04
Coelastrum microporum Naeg. 0.87
Microspora sp. 1.69
Pediastrum duplex Meyen 0.51
Scenedesmus sp. 0.43
Staurastrum gracile Ralfs 1.69 0.55
Staurastrum sp. 3.45 1.30 5.00
Table 3. Relative abundance (%) of microphytoplankton species in the Pina Basin Estuary, Recife, Brazil, during the rainy season (June 07-08 and 14-15, 2005). Note: ST = spring tide, NT = neap tide, ET = ebb tide, LT = low tide, FT = flood tide and HT = high tide.
DROUGHT PERIOD
SPRING TIDE NEAP TIDE
1st 2nd 1st 2nd
ET LT FT HT ET LT FT HT FT HT ET LT FT HT ET LT
CYANOPHYTA
Anabaena sp. 0.98 4.68 0.30 0.31 0.19 0.72 0.25 2.53 4.32
Chrooccocus dispersus
(Keissler) Lemmermann 0.19 0.38 0.37 0.20 0.38
Chrooccocus minor (Kützing)
Naegeli 0.48
Chrooccocus sp. 0.21
Cyanophyceae 15.20 3.71 8.73 5.98 0.56 21.96 17.12 11.68 47.71 0.95 2.12 50.84 34.77 Dactylococcosis acicularis
Lemmermann 7.60 0.11
Geitlerinema sp. 1.47 0.52 0.53 0.56 15.45 2.86 0.39 1.32
Lyngbya versicolar (Wartmann)
Gomont 0.14 0.11
Lyngbya sp. 0.34 0.13 0.08 0.58 0.36 3.38 0.80 3.39 0.95 0.11 0.32 0.69 0.19
Merismopedia tenuissima
Lemmermann 0.88
Oscillatoria sp. 5.74 21.77 2.86 9.86 27.48 4.84 21.96 56.16 25.88 30.92 49.47 27.60 10.56 13.72
Oscillatoriaceae 0.34 10.33 37.16 0.38 2.32 11.04
Phormidium sp. 0.34
Planktolyngbya microspira
Komarek 1.37 1.44 0.55 1.51 0.23 1.00 0.40 1.51 1.72 3.11 0.99 3.95
EUGLENOPHYTA
Euglena acus Ehrenberg 0.08 0.24
Euglena spirogyra Ehrenberg 0.08
Euglena sp. 0.11
BACILLARIOPHYTA
Amphiprora paludosa Smith 0.21 0.08
Amphiprora sp. 0.05
Anomoeoneis serians (Bréb.) Cl. 0.05 Aulacoseira granulata
(Ehrenberg) Ralfs 27.66 47.23 37.60 35.09 22.67 39.89 37.01 2.03 6.00 17.09 4.58 16.32 19.96 17.97 9.96
Bacillariophyceae 6.52 0.62 2.64 1.28 0.21 1.31 3.12 1.34 0.21 2.44
Biddulphia tridens Ehrenberg 0.11
Table 3. Continuation.
DROUGHT PERIOD
SPRING TIDE NEAP TIDE
1st
2nd
1st
2nd
ET LT FT HT ET LT FT HT FT HT ET LT FT HT ET LT
Biddulphia sp. 0.16
Campylodiscus clypeus Ehr. 0.10 0.27
Campylodiscus sp. 0.05
Cerataulus turgidus Ehrenberg 0.25
Cerataulus sp. 1.03
Coscinodiscophyceae 0.10
Coscinodiscus centralis Ehr. 0.05 0.10 53.54 0.39 3.72 3.89
Coscinodiscus Kutzingii Schm. 27.12 15.61 27.81 23.19 16.30 17.66 45.42 2.72 2.48 2.63 3.40 6.91 2.82
Coscinodiscus sp. 0.98 0.21 0.53 1.28 0.48 0.25 2.34 2.63
Dimeregramma dubium Grun. 0.08 0.07
Diploneis smithii (Bréb.) Cleve 0.03
Eunotia sp. 0.34
Fragilaria capucina (Desm.)
Kützing 0.04
Fragillaria sp. 0.05
Grammatophora sp. 0.15 0.56
Gyrosigma balticum (Ehr.) Cl. 0.15 0.08 0.21
Hyalodiscus sp. 1.18 0.21 0.03 0.10 0.19 0.64 0.24 0.11 0.19
Melosira sp. 2.16 35.73 1.05 13.59 2.24 0.19
Navicula gracilis Ehrenberg 0.04
Navicula marina Ralfs 0.08
Navicula sp1 0.29 0.41 0.20 0.10 1.09 0.07 0.19 0.34 1.76 0.19 0.16 0.19
Navicula sp2 0.41 0.07 0.10 0.08 0.05
Nitzschia angularis Smith 0.05 0.16 0.21 0.30 0.14 0.75 0.21 0.21
Nitzschia constricta (Kützing)
Ralf 0.08
Nitzschia distans Gregory 0.08
Nitzschia fasciculata Grunow 0.10 0.46 0.21 0.75 0.08 0.75
Nitzschia insignis Gregory 0.08
Nitzschia linearis (Ag.) Smith 0.08
Nitzschia longissima (Bréb.)
Grunow 0.05
Nitzschia lorenziana Grunow 0.29 0.41 0.13 0.31
Nitzschia maximaGrunow 0.07 0.07
Nitzschia sigma (Kütz.) Smith 0.10 1.03 0.33 0.31 0.08 0.08
Nitzschia sigmoidea (Nitz.) Sm 0.54 0.46 0.10 0.68 0.08 0.37 0.08 0.19
Nitzschia thermalis (Ehr.) Aue. 0.11
Nitzschia vermicularis (Kützing)
Hantsch 0.33 0.10 0.04 0.14 0.16 0.42
Nitzschia vitrea Norman 0.07
Nitzschia sp. 0.78 0.62 1.01 0.21 1.28 1.05 3.28 0.56 0.68 0.88 0.38 0.26 0.32 0.19
Petrodictyon gemma (Ehr.) M. 1.91 5.86 5.83 8.66 3.53 9.72 0.40
Pinnularia major (Kütz.) Ehr. 0.03 0.04
Pinnularia tabellaria Ehr. 0.04
Pleurosigma speciosum Smith 0.05 0.03
Pleurosigma sp. 0.25 0.62 0.64 0.57 0.56
Pleurosira laevis (Ehr.) Camp. 0.34 1.56 0.21 1.28 1.24 0.93 0.88
Podocystis adriatica Kützing 0.34
Psammodictyon panduriforme
(Greg.) Mann 0.05 0.03 0.10
Rhabdonema sp. 0.68
Rhizosolenia styliformis Brigh. 0.10 0.25
Sellaphora laevissima (Kützing)
Grunow 0.10
Table 3. Continuation.
DROUGHT PERIOD
SPRING TIDE NEAP TIDE
1st
2nd
1st
2nd
ET LT FT HT ET LT FT HT FT HT ET LT FT HT ET LT
Surirella striatula Jurpin 6.78 0.78
Surirella sp. 4.27 0.19 0.25 0.42 0.74 0.19
Synedra sp. 0.14
Terpsinoe americana Bailey 0.04
Terpsinoe musica Ehrenberg 0.25 0.12 0.19
Thalassiosira eccentrica
(Ehrenberg) Cleve 0.21
Triceratium alternans Bailey 0.64 0.21
Triceratium antedeluvianum
(Ehrenberg) Grunow 0.08
CHLOROPHYTA
Actinastrum hantzschii Lag. 0.05 0.20 0.38
Ankistrodesmus falcatus (Corda)
Ralfs Wille 0.04 0.34 0.75 0.42 1.70 0.20
Ankistrodesmus longissimus
Lemm. 0.93 0.13 0.30 0.04 0.08 8.42 4.01 15.53 12.74 6.42 10.90
Chlorophyceae 0.74 0.21 0.72 0.90 0.54 14.32 1.68 5.07 0.88 2.51 1.34 7.75 4.05 8.27
Closterium dianae Ehrenberg 0.11
Closterium rostratum Ehr. 0.08 0.24 0.38
Closterium setaceum Ehr. 0.13
Closterium striolatum Ehr. 0.25
Closterium sp. 0.34 0.21
Onychonema sp. 0.68
Pediastrum biwae Negoro 0.05 0.62 0.15 0.08 0.08 2.64 2.63 0.53 0.10 0.38
Pediastrum duplex Meyen 0.10 0.08 0.04 0.07 0.19 0.68 2.76 0.38 1.32 2.23 0.49 1.13
Pediastrum simplex Meyen 0.38 0.11
Pediastrum sp. 0.03 0.53
Scenedesmus longispina Chod 0.07 0.10 0.04 0.08 0.63 0.19 0.11 0.19
Scenedesmus sp. 0.10
Spondylosium sp. 0.05 3.93
Staurastrum gracile Ralfs 0.05 0.12 0.08 0.19
Staurastrum leptocladum Nor. 1.47 4.11 0.49 0.73 1.43 1.16 0.16 0.50 0.26 0.32 0.19
Staurastrum longiradiatum
West and West 0.04
Staurastrum subanchora
Gronbl. 0.05
Staurastrum subindentatum 0.19
Staurastrum sp. 0.41 0.15 0.31 0.28 0.13 0.21
The first two PCA components accounted for 67.59% of the total variation. The first factor accounted for 53.39% and the second for14.20%. The bi-dimensional projection shows two groups of variables with high internal correlation. Group A includes salinity, water temperature, water transparency and phosphate and characterizes the dry season. Group B brought together species richness, nitrogen (nitrate+nitrite), silicate and suspended particulate matter and characterized the rainy season. The dissolved oxygen and chlorophyll-a were related to the second axis and were inversely correlated to the species diversity (Fig. 6).
From the similarity analysis of the samples it was possible to distinguish two groups of species corresponding to the dry and rainy seasons (Fig. 7) when significant differences (p=0.001) were observed.
However, no significant differences were observed among the stages or between spring and neap tides.
D
ISCUSSIONA multitude of physical, chemical and biological processes affect organisms in marine areas (MANN, 1982). These processes operate over a range of spatial and temporal scales (TAGUSHI; LAWS, 1987) that must be considered when explaining variability in the structure, function and distribution of phytoplankton communities. In the tropics, this variability is highly affected by seasonal changes in rainfall (SOURNIA, 1969). Seasonal rainfall in tropical areas produces temporal and regional differences in river discharge. This induces fluctuations in salinity, nutrient concentrations, turbidity and biological productivity.
Fig. 6. Principal Component Analysis of the Port Basin of Recife Estuary (Pernambuco, Brazil) during the dry season (January 25-26 and February 02-03, 2005) and rainy season (June 07-08 and 14-15, 2005). Note: CL = chlorophyll-a, DIV = species diversity, P = phosphate, SPM = suspended particulate matter, N = nitrite+nitrate, RIC = number of species, DO = dissolved oxygen, SL = salinity, SIL = silicate, Tx = oxygen saturation rate, TE = water temperature and SEC = water transparency.
Previous research in the port of Recife and adjacent estuary shows that rainfall, Capibaribe and Beberibe Rivers and Pina Basin run-off affect the harbor area and produce temporal and spatial changes in the dynamics of coastal waters and phytoplankton standing crops (FEITOSA; PASSAVANTE, 1990; RESSURREIÇÃO et al., 1990; FEITOSA et al., 1999). The port of Recife presents features typical of estuarine waters during the rainy season when runoff is high and nutrients are abundant. Later, these nutrients fuel the phytoplankton blooms that commonly occur during the next dry season, when the river discharges decrease appreciably.
These blooms in the dry season bring about conditions of high productivity and create an unbalanced area. In our study, the high chlorophyll-a values were associated with high nutrient loads which enhance the eutrophication recorded in the adjacent Pina Basin (FEITOSA; PASSAVANTE, 1990; FEITOSA et al., 1999; NASCIMENTO et al., 2003) and other coastal environments (VARELA; PREGO,
2003; MELO-MAGALHÃES; KOENING;
SANT’ANNA, 2004).
During this study, dissolved oxygen, saturation rate and phosphate showed significant differences with respect to changes in tidal stages, which suggests a great influence of the mixture between river flux and marine waters. Additionally, wind action can cause upwelling in shallow areas, causing resuspension of particulate matter and nutrients (McLUSKY; ELLIOT, 2004). The other physical, chemical and biological parameters showed no significant differences with low variation during the day, probably resulting from the mixing of these water masses.
Although nutrients appear to be available for the production of large quantities of phytoplankton in the study area, maximal production is apparently achieved only during neap tides in the dry season due to greater water transparency and duration of residence. In this time period, phytoplankton displayed an enhanced biomass with chlorophyll-a values up to 55 mg m-3.
According to McLusky and Elliot (2004), three factors limit phytoplankton production: turbidity can limit the penetration of light, shallowness means that blooms may not develop and the growth rate of phytoplankton may be less than the flushing rate of the estuary.
The estuarine area adjacent to Recife Harbor presents eutrophic to hyper-eutrophic conditions. This is typical of urban estuaries with strong anthropogenic impacts (e.g., dredging processes, dumping of municipal sewage), as documented for the Pina Basin (FEITOSA; PASSAVANTE, 1990; FEITOSA et al., 1999; NASCIMENTO et al., 2003) and the Capibaribe River (KOENING et al., 1995). This process has been
observed in many other urban areas (e.g., ALMEIDA et al., 2002; ODEBRECHT et al., 2005).
The higher phytoplankton richness in the rainy season was influenced by the input of freshwater species (chlorophytes and cyanobacteria). However, diatoms were the dominant phytoplankton group and some high density species (Helicotheca tamesis, Coscinodiscus centralis, Coscinodiscus kutzingii) were often responsible for the low diversity index. This group of species is predominant in other tropical estuaries under marine influence, probably due to their euryhaline characteristics (ESKINAZI-LEÇA et al., 2000; KOENING et al., 2003; LACERDA et al., 2004; MELO-MAGALHÃES; KOENING; SANT’ANNA, 2004; ROSEVEL DA SILVA et al., 2005; GAMEIRO et al., 2007).
The exceptionally high numbers of chlorophytes and cyanobacteria species (mainly Anabaena, Oscillatoria, Pediastrum, Scenedesmus and Staurastrum) in the rainy season were caused by the intense freshwater flux. This condition and the affinity of these groups with high nutrient concentrations favor their development, instead of the development of other photosynthesizing organisms (GRAHAM; WILCOX, 2000). Chlorophytes were the second group in terms of species richness. In general, this group is the most important component of oligotrophic and eutrophic continental waters (BICUDO; PARRA, 1995).
In our study we observed a great interplay of variables influencing the rate of phytoplankton photosynthesis (e.g., nutrient limitation, light limitation) and factors influencing species composition (e.g., tides, salinity). Rainfall influenced seasonal variability with high inputs of nutrients and sediments. Research into primary production in similar environmental conditions has shown that inputs stimulate phytoplankton growth when light conditions improve and that primary productivity decreases as turbidity increases (FEITOSA; PASSAVANTE, 1991,
1993; RESSURREIÇÃO; PASSAVANTE;
MACEDO, 1996; ESKINAZI-LEÇA; KOENING; SILVA-CUNHA, 2000).
When primary production is high, eutrophication can lead to harmful algal blooms in the phytoplankton. Even in this case, total primary production will not necessarily change, but the changes in nutrient concentrations and ratios may influence the species composition of phytoplankton and have profound ecological implications (DAY JR. et al. 1989).
A
CKNOWLEDGMENTSWe wish to thank the Coordenação de Aperfeiçoamento de Pessoal de Apoio de Nível Superior (CAPES) for the grant to the first author; Drs. Enide Eskinazi Leça, Maria Luise Koening and Manuel de Jesus Flores Montes for reviewing the paper; Dr. Ralf Schwamborn for his suggestions; Zinaldo Ferreira dos Santos for his important help during field experiments and Mr. José Arnaldo of the Casa de Banho restaurant (Bar do Dique) for his support during our field work.
R
EFERENCESALMEIDA, M. A.; CUNHA, M. A.; ALCÂNTARA, F. Seasonal change in the proion of bacterial and phytoplankton production along a salinity gradient in shallow estuary. Hydrobiology, v. 475/476, p. 251-262, 2002.
ARAGÃO, J. O. R. A influência dos oceanos Pacífico e Atlântico na dinâmica do tempo e do clima do Nordeste do Brasil. Pp. 287-317. In: ESKINAZI-LEÇA, E.; NEUMANN-LEITÃO, S.; COSTA, M. F. (Org.). Oceanografia – Um cenário tropical. Recife: Bagaço, 2004.
BAIRD, M. E.; EMSLEY, S. M.; MCGLADE, J. M. Modelling the interacting effects of nutrient uptake, light capture and temperature on phytoplankton growth. J. Plankt. Res., v. 23, p. 829-840, 2001.
BAUMGARTEN, M. G. Z.; ROCHA, J. M. B.; NIENCHESKI, L. F. H. Manual de analises em oceanografia química. Rio Grande: EDFURG, 1996. 132 p.
BICUDO, C. E. M.; PARRA, O. O. Introducción a la biologia y sistemática de las algas continentales. Santiago: Ediciones Universidad de Concepción, 1995. CUPP, E. E. Marine plankton diatoms of the west coast of
North America. Bull. Scripps Inst. Oceanogr., v. 5, p. 1-237, 1943.
DAY JR., J. W.; HALL, C. A. J.; KEMP, W. M.; YÁÑEZ-ARANCIBIA, A. Estuarine Ecology. New York: Wiley-Interscience, 1989. 556 p.
DESIKACHARY, T. V. Cyanophyta. New Delhi: Indian Council of Agricultural Research, 1959. 686 p. ESKINAZI-LEÇA, E.; KOENING, M. L.; SILVA-CUNHA,
M. G. G. O fitoplâncton: estrutura e produtividade. p. 67-74. In: BARROS, H. M.; ESKINAZI-LEÇA, E.; MACÊDO, S. J.; LIMA, T. (Ed.). Gerenciamento participativo de estuários e manguezais. Recife: EDUFPE, 2000. 252 p.
FEITOSA, F. A. N.; PASSAVANTE, J. Z. O. Variação sazonal da biomassa primária do fitoplâncton da Bacia do Pina (Pernambuco – Brasil). Trabhs oceanogr., Univ.Fed. Pernambuco, v. 21, p. 33-46, 1990. FEITOSA, F. A. N.; PASSAVANTE, J. Z. O. Variação
sazonal da produção primária do fitoplâncton da Bacia do Pina (Pernambuco – Brasil). Trabhs oceanogr., Univ. Fed. Pernambuco, v. 22, p. 65-82, 1991/1993.
FEITOSA, F. A. N.; NASCIMENTO, F. C. R.; COSTA, K. M. P. Distribuição espacial e temporal da biomassa fitoplanctônica relacionada com parâmetros hidrológicos na Bacia do Pina (Pernambuco – Brasil). Trabs oceanogr., Univ. Fed. Pernambuco, v. 27, n. 2, p. 1-13, 1999.
FERNANDES, L. F.; BRANDINI, F. P. Diatom associations in shelf waters off Paraná State, Southern Brazil: annual variation in relation to environmental factors. Braz. J. Oceanogr., v. 52, n. 1, p. 19-34, 2004.
GAMEIRO, C; CARTAXANA, P.; BROTAS, V. Environmental drivers of phytoplankton distribution and composition in Tagus Estuary, Portugal. Estuar.coast. Shelf Sci., v. 75, p. 21-34, 2007.
GILBERT, P. M. Interactions of top-down and bottom-up control in planktonic nitrogen cycling. Hydrobiologia, v. 363, p.1-12, 1998.
GRAHAM, L. E.; WILCOX, L.W. Algae. New Delhi: Prentice Hall, 2000. 640 p.
GRASSHOFF, K.; EMRHARDT, M.; KREMLING, K. Methods of seawater analysis. 2. ed. New York: Verlag Chemie, 1983. 419 p.
HUSTEDT, F. Die Kieselalgen Deutschlands, Österreichs und der Schweiz unter Berücksichtigung der übrigen Länder Europas sowie der angrenzenden Meeresgebiete. Kriptogamen-Flora von Deutschlands, Österreichs und der Schweiz, Leipzig, v. 7, pt. 1, p. 920, 1930; pt. 2, p. 845, 1959; pt . 3, p. 816, 1961-1966.
KOENING, M. L.; MACÊDO, S. J.; TRAVASSOS, P. E. P. F.; PASSAVANTE, J. Z. O. Biomassa fitoplanctônica no estuário do rio Capibaribe (Recife – Pernambuco – Brasil). Arq. Biol. Tecnol., v. 38, n. 4, p. 1071-1083, 1995
KOENING, M. L.; ESKINAZI LEÇA, E.; NEUMANN-LEITÃO, S.; MACEDO, S. J. Impacts of the construction of the (omission ?) of Suape on phytoplankton in the Ipojuca River estuary (Pernambuco-Brazil). Braz. Arch. Biol. Technol., v. 46, n. 1, p. 3-81, 2003.
.KOMÁREK, J.; ANAGNOSTIDIS, K. Cyanoprokaryota. 1. Teil: Chroococcales. Berlim: Spektrum, Akademische Verlag, 2000. (Sübwasserflora von Mitteleuropa; Band 19/1).
LACERDA, S. R.; KOENING, M. L.; NEUMANN-LEITÃO, S.; FLORES-MONTES, M. J. Phytoplankton nyctemeral variation at a tropical river estuary (Itamaracá-Pernambuco-Brazil). Braz. J. Biol., v. 64, n.1, p. 81-94, 2004.
LEGENDRE, P.; LEGENDRE, L. Numerical Ecology. Amsterdam: Elsevier Science, 1998. 853 p. (Developments in Environmental Modelling, 20). LEWITUS, A. J.; KOEPFLER, E. T.; MORRIS, J. T.
Seasonal variation in the regulation of phytoplankton by nitrogen and grazing in a salt-marsh estuary. Limnology and Oceanography, Baltimore, v. 43, p. 636-646, 1998. MAFRA JUNIOR, L.; FERNANDES, L. F.; PROENÇA, L.
A. O. Harmful algae and toxis in Paranaguá bay, Brazil: bases for monitoring. Braz.J. Oceanogr., v. 54, n. 2-3, p. 107-121, 2006.
MANN, K. H. Ecology of Coastal Waters: A System approach.. Oxford: Blackwell Science Publications, 1982. 322 p.
MARONE, E.; MACHADO, E. C.; LOPES, R. M.; SILVA, E. T. Land-ocean fluxes in the Paranaguá Bay estuarine system, southern Brazil. Braz. J. Oceanogra., v. 53, n. 3-4, p. 169-181, 2005.
McLUSKY, D. S.; ELLIOTT, M. The Estuarine Ecosystem. New York: John Wiley and Sons, 2004.
MELO-MAGALHÃES, E. M; KOENING, M. L.; SANT’ANNA, C. L. Fitoplâncton e variáveis ambientais nos canais do sistema estuarino lagunar Mundaú/Manguaba, Alagoas, Brasil. Hoehnea, , v. 31, n.1, p. 73-86, 2004.
MILLER, C. A.; PENRY, D. L.; GLIBERT, P. M. The impact of trophic interactions on rates of nitrogen regeneration and grazing in Chesapeake Bay. Limnol. Oceanogr., v. 40, p. 1005-1011, 1995.
NASCIMENTO, F. C. R.; MUNIZ, K.; FEITOSA, F. A. N.; ARAÚJO, J. P.; SILVA, R. M. S.; SILVA, G. S.; FLORES MONTES, M. J. Disponibilidade nutricional da Bacia do Pina e rio Tejipió (Recife- PE- Brasil) em relação aos nutrientes e biomassa primária (setembro/2000). Trop. Oceanogr., v. 31, n. 2, p. 149– 169, 2003.
NEWELL, G. H.; NEWELL, R. Marine plankton: a practical guide. London: Hutchinson Education, 1963. 221 p.
ODEBRECHT C. P.; ABREU, O. O.; MÖLLER JR., L. F.; NIENCHESKI, L. A.; PROENÇA-TORGAN, L. C. Dry effects on pelagic propetiers (properties ?) in the shallow and turbid Patos lagoon, Brazil. Estuaries, v. 28, p. 675-685, 2005.
PARRA, O. O.; GONZALEZ, M.; DELLAROSSA, V.; RIVERA, P.; ORELLANA, M. Manual taxonomico del fitoplancton de aguas continentales com especial referencia al fitoplancton de Chile. Concepcion: [s.n.], 1982. 70 p. (v.1: Cyanophyceae).
PARSONS, T. R.; STRICKLAND, J. D. H. Discussion of spectrophotometric determination of marine plankton pigments, with revised equations of ascertaining chlorophyll a and carotenoids. J. mar. Res., v. 21, n. 3, p. 155-163, 1963.
PÉRAGALLO, H.; PÉRAGALLO, M. Diatomées marines de France et des districts maritimes voisins. Paris: M. J. Tempere, 1897-1908.
PRESCOTT, G. W. Algae of the western great lakes area. Duduque: Wm. C. Brown, 1975.
RABOUILLE, C.; MACKENZIE, F. T.; VER, L. M. Influence of the human perturbation on carbon, nitrogen, and oxygen biogeochemical cycles in the global coastal ocean. Geochim. Cosmochim. Acta, v. 65, p.3615-3641, 2001.
RESH, V. H.; UNZICKER, J. D. Water quality monitoring and aquatic organisms: the importance of species identification. J. Wat. Pollut. Control Fed., v. 47, n. 1, p. 9-19. 1975.
RESSURREIÇÃO, M. G.; PASSAVANTE, J. Z. O.; MACÊDO, S. J. Estudo da plataforma Continental na área do Recife (Brasil): variação sazonal da biomassa fitoplanctônica (08°03’38’’ lat. S; 34°42’28’’ a 34°52’00’’ long. W). Trabhs oceanogr., Univ. Fed. Pernambuco, v. 24, p. 39-59, 1990.
RIEGMAN, R.; NOORDELOOS, A. A. M. Size-fractionated uptake of nitrogenous nutrients and carbon by phytoplankton in the North Sea during summer, 1994. Mar. Ecol. Progr. Ser., v. 173, p. 95-106, 1998. RIEGMAN, R.; FLAMELING, I. A.; NOORDELOOS, A. A.
M. Size-fractionated uptake of ammonium, nitrate and urea and phytoplankton growth in the North Sea during spring 1994. Mar. Ecol. Progr. Ser.ies, v. 173, p. 85-94, 1998.
ROHLF, F. J.; FISHER, D. L. Test for hierarchical structure in random data sets. Systematic Zoology, v. 17, p. 407-412, 1968.
ROSEVEL DA SILVA, M.; SILVA-CUNHA, M. G. G.; FEITOSA, F. A. N.; MUNIZ, K. Estrutura da comunidade fitoplânctônica na baía de Tamandaré (Pernambuco, Nordeste do Brasil). Trop. Oceanogr., Recife, v. 33, n.2, p.163–181, 2005.
SHANNON, L. E. A mathematical theory of communication. Bull. of System Tecnology Journal, Curitiba, v. 27, p. 379-423, 1948.
SMAYDA, T. J. Harmful algal blooms: their ecophysiology and general relevance to phytoplankton blooms in the sea. Limnol. Oceanogr., v. 42, p.1137-1153, 1997. SOROKIN, Y. I. Role of plankton in the turnover of organic
matter on the Great Barrier Reef, Australia. Hydrobiologia, v. 308, n. 1, p. 35-44, 1995.
SOURNIA, A. Atlas du phytoplancton marin: introduction, Cyanophycées, Dictyochophycées, Dinophycées et Raphidophycées. Paris: Centre National de la Recherche Scientifique, 1986.
SOURNIA, A. Cycle annuel du phytoplankton et de la production primaire dans les mers tropicales. Mar. Biol., p. 3287-3303, 1969.
SOURNIA, A. Le genre Ceratium (Peridinien planctonique) dans le canal Mozambique: contribution a une révision mondiale. Biologie Marine ., Paris, v.22/23, p. 375-499, 1967.
STRICKLAND, J. D. H.; PARSONS, T. R. A. Manual of Seawater Analysis. Bull. Fish. Res. Bd Canada, v. 125, p. 1-205, 1972.
TAGUSHI, S.; LAWS, E. A. Patterns and causes of temporal variability of the phytoplankton community in Kaneohe Bay, Hawaii. J. Plankt. Res., v. 9, p. 1143-1157, 1987. TOMAS, C. R. (Ed.). Identifying marine diatoms and
dinoflagellates. San Diego: Academic Press, 1996. UNESCO. International Oceanographic Table. Wormly:
Optichrome, 1973.
VARELA, M.; PREGO, R. Hydrography and phytoplankton in an isolated and non-pristine ria(?) area: the A Coruña Harbour (NW Spain). Acta Oecol., v. 24, p. 113-124, 2003.
WETZEL, R. G.; LIKENS, G. E. Limnological analyses. 2. ed. New York: Springer-Verlag, 1991. 391 p.
(Manuscript received 30 July 2009; revised 14 March 2010; accepted 06 May 2010)