Universidade de Aveiro Departamento de Biologia 2016
ANA CAROLINA
SINIGALI ALVES
LIMA
ASSESSING THE IMPACT OF DAMMING ON
RIVER FISHES: GOING BEYOND TAXONOMY
AVALIAÇÃO DO IMPACTO DE BARRAGENS EM
PEIXES DE ÁGUA DOCE: PARA ALÉM DA
Universidade de Aveiro Departamento de Biologia 2016
ANA CAROLINA
SINIGALI ALVES
LIMA
ASSESSING THE IMPACT OF DAMMING ON RIVER
FISHES: GOING BEYOND TAXONOMY
AVALIAÇÃO DO IMPACTO DE BARRAGENS EM
PEIXES DE ÁGUA DOCE: PARA ALÉM DA
TAXONOMIA
Tese apresentada à Universidade de Aveiro para cumprimento dos requisitos necessários à obtenção do de Doutor em Biologia e Ecologia das Alterações Globais, realizada sob a orientação científica do Professor Doutor Amadeu Mortágua Velho da Maia Soares, Professor Catedrático do Departamento de Biologia da Universidade de Aveiro e do Doutor Kieran Andrew Monaghan, Investigador Auxiliar do Departamento de Biologia da Universidade de Aveiro
Apoio financeiro da FCT e do FSE no âmbito do III Quadro Comunitário de Apoio. Referência da bolsa doutoral: SFRH / BD / 51408 / 2011
iii
“Eu já disse, mas vou repetir: não se represa um rio, não se engana a natureza, faça a represa o que quiser, pois o rio cedo ou tarde vai arranjar um jeito de rasgar a terra, abrir um caminho, e voltar a correr em seu leito de origem.”
Fernando Pessoa
i
o júri
presidente Prof. Doutor Nuno Miguel Gonçalves Borges de Carvalho
Professor Catedrático do Departamento de Eletrónica e Telecomunicações e Informática da Universidade de Aveiro
Prof. Doutor Manuel Augusto Simões Graça Professor Catedrático do Departamento de Ciências da Vida, Faculdade de Ciências e Tecnologia da Universidade de Coimbra
Prof. Doutor Amadeu Mortágua Velho da Maia Soares
Professor Catedrático do Departamento de Biologia da Universidade de Aveiro
Prof. Doutor Frederick John Wrona
Chief Scientist for the Province of Alberta for the Environmental Monitoring and Science Division (EMSD), Department of Environment and Parks, Canada
Prof. Doutora Cristina Maria Branquinho Fernandes
Investigadora Principal, Centro de Biologia Ambiental, Faculdade de Ciências da Universidade de Lisboa
Prof. Doutor Rui Miguel Borges Sampaio e Rebelo
Professor Auxiliar, Departamento de Biologia Animal, Faculdade de Ciências da Universidade de Lisboa
Prof. Doutor Marco Filipe Loureiro Lemos
Professor Adjunto, Escola Superior de Turismo e Tecnologia do Mar, Instituto Politécnico de Leiria
Doutor João Luís Teixeira Pestana
Investigador em Pós-Doutoramento, Departamento de Biologia & CESAM da Universidade de Aveiro
iii
agradecimentos Aos meus orientadores, Professor Dr. Amadeu Soares por me ter
proporcionado a oportunidade de retornar ao mundo científico, por ter sido incansável em ajudar-me perante as inúmeras adversidades deste projeto e por fim, por nunca ter duvidado que iria chegar a bom porto; e Dr. Kieran Monaghan pela partilha científica e sentido crítico. Ao Dr. Carlos Sérgio Agostinho por ter concordado em participar neste projeto e por ter sido essencial na obtenção dos dados e Dr. Fred Wrona por abrir novos horizontes e pelo seu contagiante otimismo e persistência.
Às instituições e laboratórios que acolheram o meu projeto e cederam todas as condições para que se pudesse concretizar: DeBio e CESAM (Universidade de Aveiro), Universidade Federal de Tocantins (UFT) e CRI (University of New Brunswick). À ENERPEIXE S.A. por ter amavelmente cedido parte dos dados utilizados neste trabalho. À Fundação para a Ciência e Tecnologia pelo apoio financeiro.
Aos novos amigos e colegas que fiz ao longo desta atribulada aventura, principalmente à equipa das “doutoretes”, Paula e Joana com quem partilhei experiências únicas em locais extraordinários e à equipa das “kieranettes”, Luísa, Fátima, Liliana, MJ e Joana sem a qual não teria sobrevivido com alguma sanidade mental até ao fim e que tornaram tudo mais leve e com mais piada. Aos amigos de Aveiro, Maria João, Andreia, Marija, Tiago e Pestana que de alguma maneira ajudaram-me e estiveram presentes.
Aos amigos de sempre estou muito grata pela enorme paciência e apoio em todas as fases deste processo e por sempre acreditaram que eu seria capaz. À minha família Sinigali, Alves Lima, Krauss e Sayanda pelo apoio incondicional e carinho de sempre. À minha mãe Rogéria e ao meu pai Nelson por sempre me permitirem sonhar e ir mais longe. Aos meus queridos irmãos Aline e Arthur, que me fazem acreditar que é preciso lutar por um mundo melhor.
Por fim, dedico esta tese ao meu incansável marido Diogo. Não existem palavras que possam descrever o quanto foste e serás sempre a estrela mais brilhante da minha vida e o quanto o teu contributo foi essencial para que eu superasse um dos maiores desafios da minha vida.
v
palavras-chave Barragens, avaliação de impacto ambiental, ecossistemas aquáticos continentais, comunidades biológicas, atributos de peixes, biomonitorização, rios neotropicais, rios de água fria
resumo Os ecossistemas fluviais têm sido severamente afetados pelo desenvolvimento e expansão antropogénicos verificados durante o último século. Consequentemente, a sua biodiversidade sofreu um declínio significativo devido ao aumento das necessidades humanas sobre recursos fluviais limitados. A degradação e perda de serviços de ecossistemas, assim como as consequências financeiras causadas pelo crescente impacto ecológico estão a criar uma necessidade de mudança de atitude por parte dos governos e principais intervenientes no que diz respeito às estratégias para a gestão e conservação dos ecossistemas fluviais. A construção de barragens é considerada como uma das maiores causas de alterações ecológicas nestes ecossistemas associada ao desenvolvimento humano. A investigação sobre o impacto de barragens em rios tem sido realizada essencialmente através de uma perspetiva baseada em alterações taxonómicas. Esta abordagem, apesar de informativa, não tem em consideração alterações em funções biológicas. Abordagens mais simples e alternativas são assim necessárias uma vez que a construção de barragens encontra-se em expansão, principalmente em regiões tropicais onde a falta de conhecimento sobre a taxonomia e ecologia das espécies de peixes constituem um obstáculo à aplicação de medidas de mitigação efetivas. A análise baseada em atributos funcionais é promissora, na medida em que poderá contribuir para o conhecimento mecanístico das respostas biológicas às alterações de habitats, transcende a taxonomia e pode ser aplicada numa escala geográfica abrangente.
Os peixes são historicamente utilizados como indicadores biológicos de qualidade ambiental. São úteis para testar novas formas de abordar o impacto das barragens uma vez que as suas respostas às alterações antropogénicas estão relativamente bem documentadas e a sua sensibilidade para a qualidade do ambiente aquático que os rodeia é utilizada como uma das bases da monitorização da degradação ambiental. A utilização de atributos biológicos como uma abordagem alternativa à análise dos efeitos conjuntos das barragens e das alterações climáticas são apresentadas em forma de um artigo de revisão onde são abordados as suas principais vantagens sobre os métodos tradicionais baseados em métricas taxonómicas, assim como as suas principais limitações.
O principal objetivo deste estudo foi analisar o impacto de barragens em comunidades de peixes através de métodos taxonómicos e atributos biológicos. O desenho experimental considerou dois aspetos fundamentais:
espacial - criação de um gradiente longitudinal de montante para jusante da
barragem; e temporal - antes do início de funcionamento da barragem, após um curto período de tempo (entre 1 a 5 anos) e a partir dos 5 cinco anos de funcionamento.
O primeiro caso de estudo foi conduzido no Rio Tocantins, Brasil, onde a barragem hidroelétrica de Peixe Angical foi construída e incluiu três partes: (i) análise através de métodos taxonómicos que confirmaram as evidências observadas em outras barragens Neotropicais de um aumento significativo da riqueza específica e abundância no ano imediatamente a seguir ao enchimento do reservatório, seguido por um declínio acentuado após apenas 5 anos, quando as comunidades apresentaram um nível de diversidade inferior ao registado antes do funcionamento da barragem; (ii) abordagem alternativa através de descritores simples de organização (ex., Curvas de Biomassa e Abundância) que demonstrou um impacto evidente na estrutura das comunidades, mostrando-se mais informativos relativamente aos indicies de diversidade tradicionais e que assumem uma mais-valia em regiões tropicais onde a aplicação de metodologias tracionais de biomonitorização são dificultadas pela falta de conhecimento sobre as espécies; (iii) análise através de atributos biológicos de peixes que demonstrou após 5 anos de funcionamento da barragem que espécies com características oportunistas (ex.: não-migratórias; sem cuidados parentais) são mais bem-sucedidas em oposição a espécies migratórias, betónicas, detritívoras e que apresentam cuidados parentais. Apesar de algumas limitações inerentes a esta comunidade de peixes em particular (ex.: falta de conhecimento sobre muitos atributos biológicos que possam estar relacionados com a sua resposta face à barragem) os resultados obtidos demonstram que para além de uma perda de espécies, ocorreu uma alteração da estrutura funcional das comunidades de peixes associada às alterações antropogénicas.
O segundo caso de estudo foi conduzido no Rio Oldman em Alberta, Canada, onde foi construída uma barragem para efeitos de irrigação. Os resultados demonstraram que integrar as duas perspectivas diferentes (taxonómica e funcional) constitui uma vantagem. Planos de biomonitorização futuros devem considerar expressamente o gradiente longitudinal formado pela presença da barragem. No cenário global são fornecidas informações que identificam características específicas que devem ser consideradas na avaliação e na biomonitorização de rios impactados por barragens através da utilização de comunidades de peixes para a aplicação numa gestão fluvial verdadeiramente ecológica.
vii
keywords Damming, impact assessment, freshwater ecosystems, biological communities, fish traits, biomonitoring, neotropical river, cold region river
abstract Freshwater ecosystems have been severely affected by the expansion of human development in the last century. Freshwater biodiversity is consequently in sharp decline due to increased demand over limited water resources. Degradation and loss of ecosystem services, as well as financial consequences of ecological freshwater problems are creating pressure for a change in attitude from governments and stakeholders concerning strategies for conservation management. Damming is one of the major causes of ecological change in rivers associated with human development. Knowledge of their impact on freshwater ecosystems has been mostly described from the perspective of taxonomic changes. However, this approach provides little information about biological function. Alternative and simpler ways to assess the impact of damming are crucial since the constructions of dams are in expansion, especially in tropical regions where the lack of taxonomical and ecological knowledge about fish species impose an obstacle to effective mitigation measures. A trait-based approach holds the promise to increase our mechanistic understanding of biological responses to disturbed habitats; it transcends taxonomy and it can be applicable across large geographic units. Fishes have a history as biological indicators of environmental quality. They are useful for testing new approaches as their responses to varied anthropogenic disturbances are relatively well documented and their sensitivities to the health of surrounding aquatic environments form one of the basis to monitor environmental degradation. The usage of fish traits as an alternative approach to assess impacted rivers is presented in a critical review where their potential advantages over traditionally used methods are discussed as well as their challenges.
The aim of this study was to assess the impact of damming on fish fauna after dam closure using taxonomic and trait-based approaches. The experimental design considered both spatial – the longitudinal gradient from Upstream to Downstream caused by reservoir formation – and temporal - before, after a short time period and after at least five years of dam closure - effects of damming in rivers.
The first case study was conducted on the Tocantins River in Brazil, where the hydroelectric dam Peixe Angical was constructed. It included three parts: (i) a first approach using the traditional taxonomic metrics which confirmed the evidence from other Neotropical rivers of an increase in species richness and
abundance immediately after the filling phase and a reduction after only five years, when communities contracted to a level of diversity below that observed prior to dam closure; (ii) an alternative analysis using simple descriptors of community organization (Abundance Biomass Curves and Species Abundance Distributions) which showed a clear impact on the structure of fish assemblages and were more informative than traditional diversity indices; (iii) the application of a species-trait approach which showed that after five years of dam closure opportunistic strategies (e.g., non-migratory; no parental care) appeared to be more successful under the changed conditions. Long-distance migratory, benthic, detritivore and species with parental care were the most negatively affected. Despite the limitations inherent to the study of this particular fish community (e.g., the lack of knowledge on specific traits categories that might also mediate the response of fish communities to the impact of damming) these results demonstrated that beyond a loss of species richness there is a change in the functional structure of fish communities associated with anthropogenic disturbance.
The second case study was conducted in Oldman River in Alberta, Canada where the Oldman River Dam was constructed for irrigation purposes. Integrating taxonomic and trait-based approaches was found to be more informative in a temporal-spatial context of change. Biomonitoring plans should explicitly consider longitudinal spatial gradients created by reservoir formation in their implementation and related management actions. Overall, information is given to identify specific features that should be considered in the assessment and biomonitoring of impacted freshwater systems using fish communities for the application of true ecologically oriented river management.
ix
Table of Contents
Table of Contents ________________________________________________ ix List of Figures ___________________________________________________ xi List of Tables __________________________________________________ xiii Chapter 1. General Introduction _________________________________15
1.1 Freshwater ecosystems: threats and conservation _________________17
1.2 Assessing the effects of dams using fish _________________________19
1.1.1 Traditional approach ______________________________________20
1.1.2 Multimetric indices _______________________________________21
1.1.3 Trait-based approach _____________________________________22
1.3 Conceptual framework of the study _____________________________22
1.4 References ________________________________________________24
Chapter 2. Fish traits as an alternative tool for the assessment of
impacted rivers __________________________________________________29 Abstract _______________________________________________________31
2.1 Introduction ________________________________________________31
2.2 Climate change and dams – Confounding environmental effects _______34
2.3 A trait-based approach to dams’ impacts on fish ___________________38
2.4 Current challenges of trait-based approaches _____________________42
2.5 Management option and applications ____________________________43
2.6 Conclusion ________________________________________________44
2.7 References ________________________________________________45
Chapter 3. The rise and fall of fish diversity in a Neotropical river
after impoundment _______________________________________________57 Abstract _______________________________________________________59
3.1 Introduction ________________________________________________59
3.2 Materials and Methods _______________________________________61
3.2.1 Study Area _____________________________________________61 3.2.2 Environmental data _______________________________________64 3.2.3 Fish surveys ____________________________________________64 3.2.4 Data analysis ___________________________________________65 3.3 Results ___________________________________________________67 3.4 Discussion ________________________________________________79 3.5 Conclusions _______________________________________________82 3.6 References ________________________________________________83
Chapter 4. Alternative ways to measure impacts of dam
closure to the structure of fish communities of a Neotropical river _______89 Abstract _______________________________________________________91
4.1 Introduction ________________________________________________92
4.2 Materials and Methods _______________________________________94
4.2.2 Fish surveys ___________________________________________ 94 4.2.3 Data analysis __________________________________________ 95 4.3 Results __________________________________________________ 96 4.4 Discussion ______________________________________________ 102 4.5 Conclusions _____________________________________________ 106 4.6 References ______________________________________________ 106
Chapter 5. Using a trait-based approach to measure the impact of
dam closure in fish communities of a Neotropical river _______________ 113 Abstract _____________________________________________________ 115
5.1 Introduction ______________________________________________ 115
5.2 Methods ________________________________________________ 118
5.2.1 Study sites ___________________________________________ 118
5.2.2 Fish surveys __________________________________________ 119
5.2.3 Traits and trait categories ________________________________ 119
5.2.4 Data analysis _________________________________________ 122
5.3 Results _________________________________________________ 124
5.4 Discussion and Conclusions _________________________________ 130
5.5 References ______________________________________________ 134
Chapter 6. Integrating taxonomic and trait analyses to assess the impact of damming on fish communities in a northern cold regions
river_________________ ________________________________________ 143 Abstract _____________________________________________________ 145 6.1 Introduction ______________________________________________ 145 6.2 Methods ________________________________________________ 147 6.2.1 Study area ___________________________________________ 147 6.2.2 Fish surveys __________________________________________ 149 6.2.3 Flow data ____________________________________________ 151
6.2.4 Traits and trait categories ________________________________ 151
6.3 Data analysis ____________________________________________ 153
6.4 Results _________________________________________________ 155
6.5 Discussion ______________________________________________ 163
6.6 Conclusions _____________________________________________ 167
6.7 References ______________________________________________ 168
Chapter 7. Discussion and Conclusions _________________________ 175
7.1 Further work _____________________________________________ 181 7.2 References ______________________________________________ 182 Chapter 8. Appendices _______________________________________ 185 8.1 Appendix I _______________________________________________ 187 8.2 Appendix II ______________________________________________ 189 8.3 Appendix III ______________________________________________ 191 8.4 Appendix IV _____________________________________________ 205
xi
List of Figures
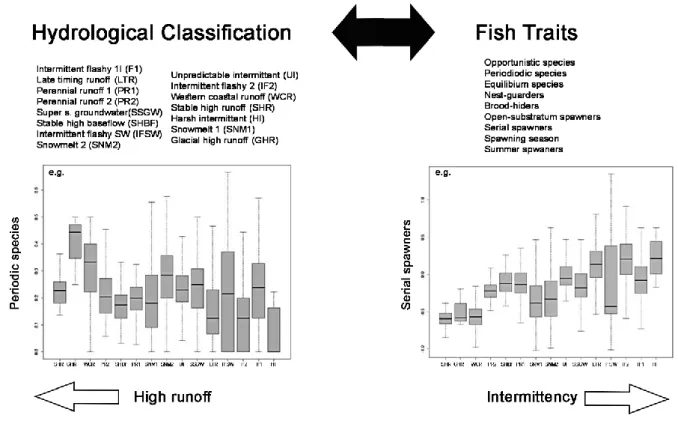
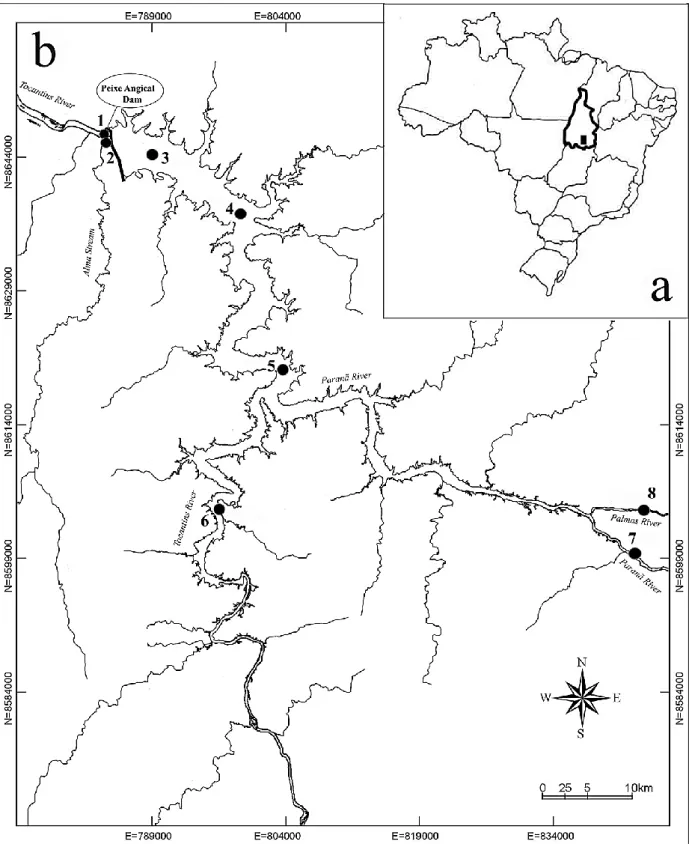
Figure 1.1 - Global distribution (by country) of large reservoirs in GRanD database (Adapted from Lehner et al., 2011). ... 19 Figure 2.1 - Parameters used in the development of a predictive linkage between the hydrologic classification and fish traits (top). Box and whisker plots of distributions of traits (proportion of periodic species, left, and serial spawning index, right) within hydrologic classes. Hydrologic classes were sorted from high runoff to highly intermittent. Periodic strategists were associated with stable, predictable flow, whereas Opportunistic strategists (and Serial spawners) were more affiliated with intermittent, variable flows. Modified from McManamay et al. (2015). ... 42 Figure 3.1 - Location of the study area and sampling sites (1 to 8). a – Brazil, Tocantins State; b – Tocantins River and Peixe Angical Dam. ... 63 Figure 3.2 - Mean daily discharge (m3/s) for Peixe Angical Dam and total precipitation (mm) during a
5 years period pre-dam (2001-2005) and 5 years period post-dam (2006-2010). ... 68 Figure 3.3 - Principal Components Analysis plot of axes 1 and 2. The arrows indicate the environmental variables loadings and geometric forms site loadings. Time periods (before, after 1 year and after 5 years of dam closure) correspond to different colors and locations (Downstream, Reservoir, Transition and Upstream) correspond to different shapes. ... 69 Figure 3.4 - Seasonal (rainy and dry) fish abundance (CPUE) in each site (1 to 8), grouped by locations (a - Downstream, b - Reservoir, c - Transition, d - Upstream), in the 3 time periods considered (before, after 1 and after 5 years of dam closure). ... 72 Figure 3.5 - Box-plots of species richness (S) and diversity (Shannon-Wiener - H) between locations (Downstream, Reservoir, Transition and Upstream) and time periods (before, after 1 and after 5). 73 Figure 3.6 - Nonmetric multidimensional scaling ordinations of seasonal fish abundances in different time periods: before dam closure (Medium-gray), after 1 year (Light-gray) and after 5 years (Black); r – rainy season, d – dry season. Sampling sites are coded 1 to 8. ... 74 Figure 3.7 - Canonical correspondence analysis (CCA) diagram of seasonal species abundance for each sampling site coded 1 to 8 and season: r – rainy season; d – dry season. Time periods are coded by colors: medium grey – before; light gray – after 1 year; black – after 5 years. Environmental variables are represented by arrows that point towards the direction of maximum variation. Eigenvalues were 0.25 for the first axis and 0.08 for the second axis. ... 78 Figure 4.1 - Abundance and biomass comparison between before, after 1 and after 5 years of dam closure for study locations: (A) Downstream (sites 1 and 2), (B) Reservoir (sites 3 and 4), (C) Transition (sites 5 and 6) and (D) Upstream (sites 7 and 8). Significant differences between time periods (Kruskall–Wallis, H) are indicated by ‘a’, ‘b’ and ‘c’: (a) between after 1 and after 5; (b) between before and after 1 and (c) between before and after 5. ... 97 Figure 4.2 - Abundance–biomass comparison curves based on monthly abundance and biomass of all fish species found within each site during the three periods of time considered. (a) Downstream
(sites 1 and 2), (b) reservoir (sites 3 and 4), (c) transition (sites 5 and 6) and (d) upstream (sites 7 and 8). ... 99 Figure 4.3 - Rank abundance plots of abundance and biomass for each site and the three time periods considered (before, after 1 year and after 5 years of dam closure). (A) Downstream (sites 1 and 2), (B) Reservoir (sites 3 and 4), (C) Transition (sites 5 and 6) and (D) Upstream (sites 7 and 8). ... 100 Figure 5.1 - CWMs values of selected traits categories (Reproduction – NEW and NEP; Habitat preference – benthic and pelagic; Feeding diet – detritivore and piscivore; Socio-economic – fishery high value and aquatic high value) for each location (Downstream, Reservoir, Transition and Upstream) between the time periods analyzed (before, after 1 years and after 5 years of dam closure). ... 127 Figure 5.2 – Nonmetric multidimensional scaling (nMDS) ordinations of community weighted means (CWMs) in different time periods: before dam closure (triangles), after 1 year (squares) and after 5 years (circles). ... 128 Figure 6.1 - Location of the study area: a – Canada, Alberta; b – Oldman River. Sampling sites locations: Downstream (D1 and D2); Reservoir (R) and Upstream (U): U1 and U2; GS1 - Gauge station 05AA024; GS2 – Gauge station 05AA008. ... 148 Figure 6.2 - Mean monthly discharge (m3/s) and standard deviation for Oldman River before (1983
to 1986), during the first 5 years (1994 to 1998) and after 5 years (1999 to 2010) of dam closure, in the locations Downstream and Upstream. ... 156 Figure 6.3 - Box-plots of species richness (S) and diversity (Shannon entropy – H’) between locations (Downstream - D1 and D2, Reservoir – R and Upstream - U) and time periods (before,< 5 yrs and > 5 yrs). ... 158 Figure 6.4 - Daily average water temperature in the Oldman River near Brocket (aprox. 100 m downstream from the dam) in the periods before dam closure (1985, 1988-1990), transition (1991-1992) and post-dam closure (1993-2001). Adapted from Hazewinkel & Saffran (2007). ... 164
xiii
List of Tables
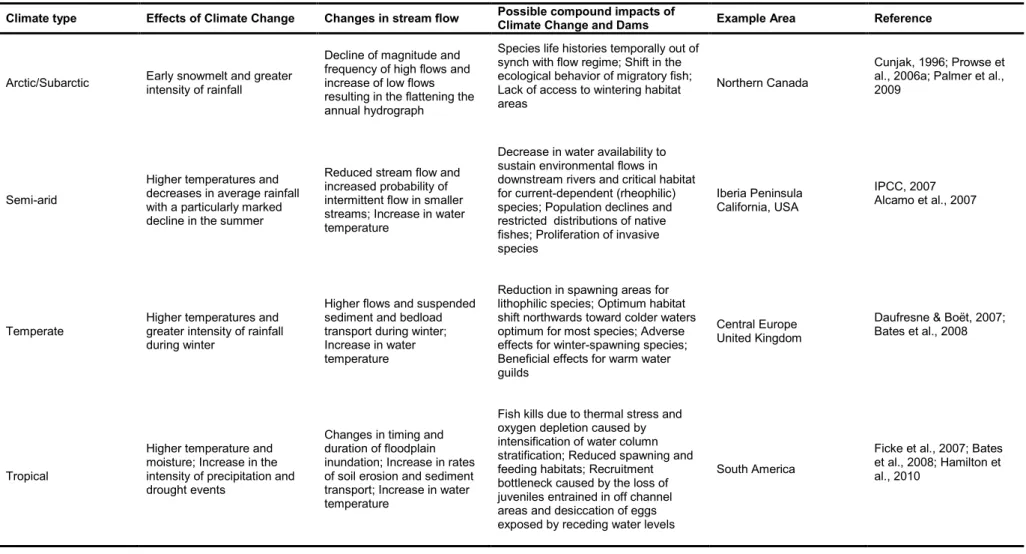
Table 2.1 - Potential effects of climate change, their consequences on river flow and possible combined effects for of both on organisms in determined areas under different climates... 37 Table 3.1 - Mean values (and standard deviation) of environmental variables recorded at the eight sample sites on the Tocantins river stretch affected by Peixe Angical dam before, after 1 year and after 5 years of dam closure. ... 70 Table 3.2 – Results from the SIMPER analysis of the total number of species that accounted for 90% of the dissimilarity between the time periods: before vs. after 1; before vs. after 5 and after 1 vs. after 5 and their overall dissimilarity in respective locations (Downstream, Reservoir, Transition and Upstream). ... 75 Table 3.3 - Results from the SIMPER analysis of dissimilarity for the first five most contributing species between 3 time periods (before, after1 and after 5) in respective locations (Reservoir, Transition, Upstream and Downstream). Fish species contributing most to the dissimilarity between time periods are shown together with their average abundance (av.) and percentage contribution in dissimilarity (%). ... 77 Table 3.4 – Results from the ordination by canonical correspondence analysis (CCA) of the seasonal fish abundance and environmental variables that were selected as being significantly related with fish species composition (p<0.05). The correlation of the explanatory variables with the first two canonical axes are displayed. Eigenvalues were 0.25 for the first axis and 0.08 for the second axis. ... 79 Table 4.1 - Kruskall–Wallis results (H and p-value) for comparisons of abundance and biomass between time periods (before, after 1 and after 5 years of dam closure) for each study site. ... 98 Table 4.2 - Abundance–biomass comparison (ABC) W-statistics based on monthly abundance and biomass of all fish species found within each site during the three periods of time considered. ... 98 Table 4.3 - Two-way ANOVA test results for differences observed between locations, time periods and interactions for each calculated index. Significant values are indicated in bold. ... 102 Table 4.4 - Post hoc Tukey’s test results for the significant differences observed between locations and time periods for each calculated index. Significant values are indicated in bold. ... 102 Table 5.1 - Description of six functional traits and twenty trait categories used to characterize fish species with their respective codes. ... 122 Table 5.2 - Results from the Kruskall-Wallis test between time periods for each trait category in all four locations (Downstream, Reservoir, Transition and Upstream). Significant values are marked in bold. The results from the post hoc pairwise test for multiple comparisons of mean rank sums (Nemenyi-test) between time periods (before, after 1 years and after 5 years) for each trait category are shown at the Appendix III - Table 8.6. ... 126 Table 5.3 – Main results for the “best” negative binomial regression model adjustment. ... 129
Table 5.4 – Coefficients for the “best” negative binomial regression model. ... 129 Table 6.1- Description of the sampling points, date and survey type of for each location (Reservoir, Downstream - D1 and D2 and Upstream - U1 and U2). ... 149 Table 6.2 - Description of the sixteen trait classes used to characterize fish species. ... 152 Table 6.3 - Results from the SIMPER analysis of the total number of species that accounted for 90% of the dissimilarity between the time periods: before vs. <5yrs; before vs. >5yrs and < 5yrs vs. >5yrs and their overall dissimilarity in respective locations (Downstream – D1 and D2, Reservoir, and Upstream). ... 159 Table 6.4 - Results from the SIMPER analysis of dissimilarity for the species contributing most to the difference between 3 time periods (before, < 5 yrs and > 5 yrs) in respective locations (Downstream D1 and D2, Reservoir and Upstream). Fish species contributing most to the dissimilarity between time periods are shown together with their average abundance (av.) and percentage contribution in dissimilarity (%). ... 160 Table 6.5 - Results from the multinomial regression model with a combination of the 10 species traits categories with the higher coefficient values for each location (Downstream – D1 and D2, Reservoir, and Upstream). ... 162 Table 8.1 - Pearson correlation matrix for the environmental variables measured... 187 Table 8.2 - Results from the Kruskal-Wallis test and post-hoc pairwise test for multiple comparisons of mean rank sums (Nemenyi-test) for seasonal abundances between time periods (before, after 1 and after 5) in respective locations (Downstream, Reservoir, Transition and Upstream). Significant p-values are indicated in bold. ... 187 Table 8.3 - Number of individuals, Species richness (S), Shannon–Weiner’s index (H’), Pielou’s J (J’), Simpson’s 1-lambda (1-λ) and Hill’s N1 for each site, Before, After 1 year and After 5 years of dam closure. ... 189 Table 8.4 - Species classification into trait categories. ... 191 Table 8.5 - Results from the post hoc pairwise test for multiple comparisons of mean rank sums (Nemenyi-test) for single-traits for each location between the three time periods analyzed: Before (b); After one year (a1) and After five years (a5). Significant p-values are indicated in bold. ... 202 Table 8.6 - Species classification into trait categories ... 205 Table 8.7 - Results from the Kruskal-Wallis test and post-hoc pairwise test for multiple comparisons of mean rank sums (Nemenyi-test) for Species richness (S) and Shannon entropy (H’) between time periods (before, < 5yrs, > 5yrs) in respective locations (Downstream – D1 and D2, Reservoir - R, and Upstream - U). Significant p-values are indicated in bold. ... 207 Table 8.8 - Results from the multinomial regression model with all selected species traits categories and their coefficient values for each location (Downstream – D1 and D2, Reservoir, and Upstream). ... 208
15
17 1.1 Freshwater ecosystems: threats and conservation
The world’s rivers and wetlands have been altered by human development extensively in the last century and are degrading at an alarming rate, more than other ecosystems (Reid et al., 2005). The causes are well known widespread threats, including habitat loss and degradation, invasive species, overharvesting, damming and pollution (Allan & Flecker, 1993; Dudgeon et al., 2006), whose impacts may be altered by climate change, which is predicted to change flow regimes to rivers (Bates et al., 2008; Palmer et al., 2009). Degradation and loss of ecosystem services for humans, as well as financial consequences of ecological freshwater problems such as deteriorating water quality are creating pressure for a change in attitude from governments and stakeholders concerning strategies for conservation management. These threats are necessarily associated with water-management objectives for human requirements, often the cause of degradation (Kingsford et al., 2011).
Although other threats to freshwater ecosystems can be substantial, modification of flow regimes remains the most widespread problem for rivers and damming is one of the major causes of flow regime modification associated with human development (Bunn & Arthington, 2002; Lamouroux et al., 2002; Webb et al., 2013). Dams have greatly contributed to the increase of habitat alteration and lower the diversity of structural features preferred by fish and other aquatic organisms, which is translated into biodiversity losses (Webb et al., 2013).
Given the current scenario of deleterious effects of human activities in freshwater ecosystems and their underlying ecological value, the assessment, protection and restoration of the integrity of these systems is increasingly becoming a priority. Karr (1999), defined stream integrity as the preservation of a “balanced, integrated, adaptive system having the full range of elements (genes, species, assemblages) and processes (mutation, demography, biotic interactions, nutrient and energy dynamics, metapopulation processes) expected in areas with minimal influence from modern human society”. The maintenance of this ideal condition requires, therefore, the restoration of balance in the costly ecological trade-offs associated with human exploitation of freshwater ecosystems which
include urgent demands for comprehensive methodological approaches to evaluate the actual state of these ecosystems and to monitor their rate of changes (Li et al., 2010).
Dams – A global perspective
Historically, dams, and the water reservoirs they create, have been viewed as a benefit to society, providing hydroelectric power, navigable waterways, flood control, agricultural irrigation, recreation and water supply during times of drought (Baxter, 1977; Nilsson et al., 2005). It is now estimated that dams, interbasin transfers, and water withdrawals for irrigation have fragmented 60% of the world’s largest rivers (World Commission on Dams, 2000). From a global perspective, regions where climatic constrains such as seasonal lack of water (arid and semi-arid areas), or growing flooding periods (Arctic and Australia) are more pronounced have a greater number of large reservoirs (Lehner et al., 2011; Figure 1.1). This is also true for developing economies where population is exponentially increasing and water demand is a growing concern (e.g., South American countries, India and China). During the 20th century, large dams emerged as one of the most significant
and visible tools for the management of water resources. It is now estimated that more than 45000 large dams (>15 m high) have been built around the world (World Commission on Dams, 2000). Current estimates suggest that some 30-40% of irrigated land worldwide now rely on dams and they generate roughly 19% of world’s electricity (World Commission on Dams, 2000).
19
Figure 1.1 - Global distribution (by country) of large reservoirs in GRanD database (Adapted from Lehner et al., 2011).
Liermann et al. (2012), in a global study refers dams as one of the strongest threats to freshwater biodiversity. They have demonstrated that nearly 50% of the freshwater ecoregions are obstructed by large and medium size dams and approximately 27% face additional downstream obstruction.
Ecological consequences of damming are especially alarming for tropical regions where many large rivers have been modified to some extent by large hydroelectric dams (Araújo & Marques, 2013) and yet, the construction of many more are predicted (Marques et al., 2009). Although recent work has provided important understanding to the phenomena of regulation in tropical rivers from the perspective of taxonomic changes in species composition and diversity (Agostinho et al., 2004; Petesse & Petrere, 2012), the lack of basic, descriptive knowledge provides a major obstacle to strategies of impact mitigation.
1.2 Assessing the effects of dams using fish
The aims of conservation management are either to maintain the status quo or to manipulate the system to achieve some predefined target by modifying the processes that are fundamental to ecosystem structure and functioning (Legg &
Nagy, 2006). Following the assumption that measurement of the condition of the biota can be used to assess the condition of an ecosystem (Herricks & Cairns, 1982), environmental decision-making is now highly dependent on the systematic use of biological responses to evaluate changes in the environment with the intent to use this information in a quality control program – or biomonitoring (Matthews et al., 1982).
The role of fish as biological indicators has been explicitly mentioned in the legislation about water resources and aquatic environments, not only in the European Union and USA, but also in other countries (European Commission, 1992; European Union, 2000; Kurtz et al., 2001). Here, legislations focus on the need for an improvement in environmental quality, as well as for the assessment of ecological integrity as key tools for conservation, restoration and management activities (Ziglio et al., 2006). Fishes ecological responses to habitat alteration are well known and they are widely used to monitor environmental degradation (Fausch et al., 1990).
1.1.1 Traditional approach
Methods developed over the past decades for assessing stream integrity using aquatic fish communities are diverse and span from the usage of relatively simple biotic indices, to multimeric approaches that combine several of those indices or even to relatively complex multivariate approaches that aim to recognize and predict patterns of non-disturbed systems (Li et al., 2010). Traditional methods have incorporated the taxonomic composition of communities as an indicator of ecological change (Culp et al., 2011). It usually applies diversity indices developed to describe responses of a community to environmental variation, combining three components of community structure: richness (number of species present), evenness (uniformity in the distribution of individuals among the species) and abundance (total number of individuals present; e.g., Shannon entropy, Simpson Index, Margalef Index; Li et al., 2010). These indices are based on the premise that undisturbed environments are characterized by high richness and even distribution of individuals among the species (Li et al., 2010).
21 1.1.2 Multimetric indices
Over the last decades, a variety of fish-based biotic indices have been widely used to assess river quality, and the use of multimetric indices, inspired by the index of biotic integrity (IBI; Karr, 1981), has grown rapidly (Barbour et al., 1999). The original version of the IBI includes twelve assemblage attributes that are compared to values expected for an unperturbed stream of the same size in the same ecoregion (Barbour et al., 1999). The assemblage attributes can be grouped into three main categories, i.e., species richness and assemblage composition; trophic composition and fish abundance and condition.
The IBI has become a flexible conceptual framework which can be adapted on a regional scale and its original version has been modified in order to preserve its rationale, independently of the ecoregion in which it is applied (Ziglio et al., 2006). Jennings et al. (1995), proposed an adaptation of the IBI for assessing reservoirs – the Reservoir Fish Assemblage Index (RFAI) and excluded the term biotic integrity due to the absence of natural reference conditions in these systems. More recently, Terra & Araújo (2011), adapted the RFAI for the transition river-reservoir, the preliminary RRAFAI, which might enable environmental managers to assess the impact of reservoir.
Despite the sound ecological principles in which IBI indices are based, their application has received some criticism (e.g., by Suter, 1993). Namely, the fact that the IBI relies on biotic attributes that require detailed historical and ecological information which is often not available, especially in development countries. A particular problem is dealing with attributes involving proportions of fish species or functional groups, as little reference (e.g., pre-impact) information on them is usually available (Ziglio et al., 2006). Also, naturally high disturbance regimes, to which fish are adapted, may affect the ability of the IBI to evaluate ecological quality, especially because there are several anthropogenic changes that may actually mimic these natural disturbance regimes like droughts and flash floods.Therefore, alternate solutions should also be considered, such as those based on community analysis, in order to assess ecological quality by comparing fish assemblage composition in a set of different sites and time periods.
1.1.3 Trait-based approach
It is generally recognized that adequate characterization of ecosystems requires information on both structure (pattern) and function (process; Li et al., 2010). Consequently, despite the fact that assemblage structure and composition has been successfully used in studies of anthropogenic impacts in aquatic ecosystem, using an approach based on multiple biological traits (e.g., size, body form, life cycle, food and feeding habits, reproduction) allows a view of the community that exceeds mere structure (taxa richness and abundance). This view is based on the concept of the habitat template (Southwood, 1977), in which organisms have inherent traits for survival (e.g., habitat preference and life-history characteristics) and consequently, in the face of environmental change, species that display similar niches with respect to multiple environmental factors and similar traits, behave similarly (Henle et al., 2004). This approach will be discussed in more detail in the following section and in Chapter 2.
The use of species traits in basic and applied ecology is expanding rapidly because trait-based approaches hold the promise to increase our mechanistic understanding of biological responses and they can be applicable across large geographic units (Verberk et al., 2013). After stressor exposure, traits distribution at the impacted site is predicted to shift relative to the reference site (Culp et al., 2011). Consequently, traits that impart resistance or resilience to the stressor are conserved in a population which may allow biomonitoring approaches to yield mechanistic understanding rather than our current ability to observe only that ecological change has occurred (Culp et al., 2011).
1.3 Conceptual framework of the study
The consequences of damming are known to be detrimental to freshwater ecosystems, especially fish (Bunn & Arthington, 2002; Agostinho et al., 2004, 2008; Suzuki et al., 2009; Poff & Zimmerman, 2010; Webb et al., 2013). Although the investigation of dams’ impact on freshwater ecosystems has become a major issue
23 in river ecology, study efforts have focused mainly on applying a traditional approach to assess the consequences for fish fauna and much of the work and mitigation measures carried out have target mostly European and North American river systems. The main goal of this work was to assess the impact of damming in fish fauna from a Neotropical river in the Amazon basin and from a cold region river from Canada after dam closure using traditional and non-traditional approaches. The specific objectives were:
1. Analyze how fish assemblages from the Neotropical river were affected in the short-term by focusing on two distinct time periods: one year and five years after dam closure using traditional assessment approaches;
2. Asses the changes observed in spatial-temporal context;
3. Find alternative and simpler ways to measure these impacts that reflect the limitation in knowledge from the Neotropical rivers;
4. Investigate how damming influences the functional structure of fish communities using a trait-based approach in the Neotropical river;
5. Investigate the impact of damming in the short term (less than 5 years of dam closure) and longer term (more than 5 years after) in a northern cold region river integrating both the taxonomic and functional approaches.
This thesis is organized in seven chapters: (1) a general introduction, exploring the main concepts related to the subject of this thesis; (2) a chapter with a critical review about the use of fish traits to assess impacted rivers: “Fish traits as an alternative tool for the assessment of impacted rivers”; (3) a chapter named: “The rise and fall of fish diversity in a Neotropical river after impoundment”, where the response of fish assemblages to the construction of a run-of-the-river dam in an Amazonian river was assessed based on traditional taxonomic analysis; (4) a chapter where non-traditional approaches to measure the same impacts on the structure of fish assemblages were applied and is entitled: "Alternative ways to measure the impact of dam closure on the structure of fish communities of a Neotropical river"; (5) a chapter named “Using a trait-based approach to measure the impact of dam closure on fish communities of a Neotropical river” where the
response of fish communities was assessed using traits; (6) a chapter where both taxonomic and trait-based approaches were integrated to assess the impact of damming in fish assemblages from a cold climatic region named: “Integrating taxonomic and trait analyses to assess the impact of damming on fish communities in a northern cold region river”; (7) a concluding remarks chapter, summarizing the main findings. All the references used are listed at the end of the respective chapter in a specific section.
1.4 References
Agostinho, A. A., L. C. Gomes, S. Veríssimo, & E. K. Okada, 2004. Flood regime, dam regulation and fish in the Upper Paraná River: effects on assemblage attributes, reproduction and recruitment. Reviews in Fish Biology and Fisheries 14: 11–19.
Agostinho, A. A., F. M. Pelicice, & L. C. Gomes, 2008. Dams and the fish fauna of the Neotropical region: impacts and management related to diversity and fisheries. Brazilian journal of biology = Revista brasleira de biologia 68: 1119– 1132,
Allan, J. D., & A. S. Flecker, 1993. Biodiversity Conservation in Running Waters. BioScience 43: 32–43.
Araújo, E., & E. Marques, 2013. Changes in distance decay relationships after river regulation: similarity among fish assemblages in a large Amazonian river.
Ecology of Freshwater Fish 543–552,
http://onlinelibrary.wiley.com/doi/10.1111/eff.12054/full.
Barbour, M. T., J. Gerritsen, B. D. Snyder, & J. B. Stribling, 1999. Rapid Bioassessment Protocols for Use in Streams and Wadeable Rivers: Periphyton, Benthic Macroinvertebrates and Fish, Second Edition. U.S. Environmental Protection Agency; Office of Water;, Washington, DC.
Bates, B. C., Z. W. Kundzewicz, S. Wu, & J. P. Palutikof, 2008. Climate change and water. 210, http://www.citeulike.org/group/14742/article/8861411.
25 Baxter, R., 1977. Environmental effects of dams and impoundments. Annual Review
of Ecology and Systematics JSTOR 8: 255–283,
http://www.jstor.org/stable/2096729.
Bunn, S. E., & A. H. Arthington, 2002. Basic principles and ecological consequences of altered flow regimes for aquatic biodiversity. Environmental Management Springer 30: 492–507, doi:10.1007/s00267-002-2737-0.
Culp, J. M., D. G. Armanini, M. J. Dunbar, J. M. Orlofske, N. L. Poff, A. I. Pollard, A. G. Yates, & G. C. Hose, 2011. Incorporating traits in aquatic biomonitoring to enhance causal diagnosis and prediction. Integrated environmental
assessment and management 7: 187–197,
http://www.ncbi.nlm.nih.gov/pubmed/21442732.
Dudgeon, D., A. H. Arthington, M. O. Gessner, Z.-I. Kawabata, D. J. Knowler, C. Lévêque, R. J. Naiman, A.-H. Prieur-Richard, D. Soto, M. L. J. Stiassny, & C. a Sullivan, 2006. Freshwater biodiversity: importance, threats, status and conservation challenges. Biological reviews of the Cambridge Philosophical Society 81: 163–182, http://www.ncbi.nlm.nih.gov/pubmed/16336747.
European Commission, 1992. Council Directive 92/43/ECC of 21st May 1992 on the Conservation of Natural Habitats and of Wild Fauna and Flora. Brussels, Belgium.
European Union, 2000. Parliament and Council Directive 2000/60/EC of 23rd October 2000. Establishing a Framework for Community Action in the Field of Water Policy. Brussels, Belgium.
Fausch, K. D., J. Lyons, J. R. Karr, & P. L. Angermeier, 1990. Fish communities as indicators of environmental degradation. American Fishery Society Symposium 8: 123-144.
Henle, K., K. F. Davies, M. Kleyer, C. Margules, & J. Settele, 2004. Predictors of Species Sensitivity to Fragmentation. Biodiversity and Conservation 13: 207– 251, http://link.springer.com/10.1023/B:BIOC.0000004319.91643.9e.
Herricks, E. E., & J. Cairns, 1982. Biological monitoring. Water Research 16: 141– 153, http://www.sciencedirect.com/science/article/pii/0043135482901038.
Jennings, M. J., L. S. Fore, & J. R. Karr, 1995. Biological monitoring of fish assemblages in Tennessee Valley reservoirs. Regulated Rivers: Research & Management 11: 263–274.
Karr, J. R., 1981. Assessment of Biotic Integrity Using Fish Communities. Fisheries
Taylor & Francis Group 6: 21–27,
http://www.tandfonline.com/doi/abs/10.1577/1548-8446(1981)006%3C0021:AOBIUF%3E2.0.CO;2.
Karr, J. R., 1999. Defining and measuring river health. Freshwater Biology 41: 221– 234, http://doi.wiley.com/10.1046/j.1365-2427.1999.00427.x.
Kingsford, R. T., H. C. Biggs, & S. R. Pollard, 2011. Strategic Adaptive Management in freshwater protected areas and their rivers. Biological Conservation 144: 1194–1203.
Kurtz, J. C., L. E. Jackson, & W. S. Fisher, 2001. Strategies for evaluating indicators based on guidelines from the Environmental Protection Agency’s Office of Research and Development. Ecological Indicators 1: 49–60.
Lamouroux, N., N. L. R. Poff, & P. L. Angermeier, 2002. Intercontinental convergence of stream fish community traits along geomorphic and hydraulic
gradients. Ecology Eco Soc America 83: 1792–1807,
http://www.esajournals.org/doi/pdf/10.1890/0012-9658(2002)083[1792:ICOSFC]2.0.CO;2.
Legg, C. J., & L. Nagy, 2006. Why most conservation monitoring is, but need not be, a waste of time. Journal of environmental management 78: 194–199. Lehner, B., C. R. Liermann, C. Revenga, C. Vörösmarty, B. Fekete, P. Crouzet, P.
Döll, M. Endejan, K. Frenken, J. Magome, C. Nilsson, J. C. Robertson, R. Rödel, N. Sindorf, & D. Wisser, 2011. High-resolution mapping of the world’s reservoirs and dams for sustainable river-flow management. Frontiers in Ecology and the Environment Ecological Society of America 2050: 110531072704016, http://www.esajournals.org/doi/abs/10.1890/100125. Li, L., B. Zheng, & L. Liu, 2010. Biomonitoring and Bioindicators Used for River
Ecosystems: Definitions, Approaches and Trends. Procedia Environmental Sciences 2: 1510–1524.
27 Liermann, C. R., C. Nilsson, J. Robertson, & R. Y. Ng, 2012. Implications of Dam Obstruction for Global Freshwater Fish Diversity. BioScience 62: 539–548, http://bioscience.oxfordjournals.org/cgi/doi/10.1525/bio.2012.62.6.5.
Marques, E. E., R. M. Silva, & D. . Silva, 2009. Variações espaciais na estrutura das populações de peixes antes e após a formação do reservatório da UHE Peixe Angical In Agostinho, C. S., F. M. Pelicice, & E. E. Marques (eds), Reservatório de Peixe Angical: bases ecológicas para o manejo da ictiofauna. Rima, São Paulo: 51–57.
Matthews, R. A., A. L. Buikema, J. Cairns, & J. H. Rodgers, 1982. Biological monitoring. Water Research 16: 129–139.
Nilsson, C., C. Reidy, M. Dynesius, & C. Revenga, 2005. Fragmentation and flow regulation of the world’s large river systems. Science 308: 405–408.
Palmer, M. A., D. P. Lettenmaier, N. L. Poff, S. L. Postel, B. Richter, & R. Warner, 2009. Climate change and river ecosystems: protection and adaptation options. Environmental management 44: 1053–1068.
Pelicice, F. M., & A. A. Agostinho, 2008. Fish-Passage Facilities as Ecological Traps in Large Neotropical Rivers. Conservation Biology 22: 180–188, http://doi.wiley.com/10.1111/j.1523-1739.2007.00849.x.
Petesse, M. L., & J. M. Petrere, 2012. Tendency towards homogenization in fish assemblages in the cascade reservoir system of the Tiete river basin, Brazil. Brazil Ecological Engineering 48: 109–116.
Poff, N. L., & J. K. H. Zimmerman, 2010. Ecological responses to altered flow regimes: a literature review to inform the science and management of
environmental flows. Freshwater Biology 55: 194–205,
http://doi.wiley.com/10.1111/j.1365-2427.2009.02272.x.
Reid, W. V., H. A. Mooney, A. Cropper, D. Capistrano, S. R. Carpenter, K. Chopra, P. Dasgupta, T. Dietz, R. Duraiappah, Anantha Kumar Hassan, R. Kasperson, R. Leemans, R. M. May, T. (A. J. . M. P. Pingali, C. Samper, R. Scholes, R. T. Watson, M. J. L. A.H. Zakri, Zhao Shidong, Neville J. Ash, Elena Bennett, Pushpam Kumar, C. Raudsepp-Hearne, H. Simons, J. Thonell, & M. B. Zurek, 2005. Millennium Ecosystem Assessment, 2005. Ecosystems and Human Well-being: Synthesis. World Resources Institute.
Southwood, T. R. E., 1977. Habitat, The Template for Ecological Strategies?. Journal of Animal Ecology 46: 337–365.
Strayer, D. L., & D. Dudgeon, 2010. Freshwater biodiversity conservation: recent progress and future challenges. Journal of the North American Benthological Society 29: 344–358.
Suter, G. W., 1993. A critique of ecosystem health concepts and indexes. Environmental Toxicology and Chemistry 12: 1533.
Suzuki, H. I., a a Agostinho, D. Bailly, M. F. Gimenes, H. F. Júlio, & L. C. Gomes, 2009. Inter-annual variations in the abundance of young-of-the-year of migratory fishes in the Upper Paraná River floodplain: relations with hydrographic attributes. Brazilian journal of biology = Revista brasleira de biologia 69: 649–660.
Terra, B. de F., & F. G. Araújo, 2011. A preliminary fish assemblage index for a transitional river–reservoir system in southeastern Brazil. Ecological Indicators 11: 874–881.
Verberk, W. C. E. P., C. G. E. van Noordwijk, & A. G. Hildrew, 2013. Delivering on a promise: integrating species traits to transform descriptive community ecology into a predictive science. Freshwater Science The Society for Freshwater Science 32: 531–547, http://dx.doi.org/10.1899/12-092.1.
Webb, A. J., K. A. Miller, E. L. King, S. C. de Little, M. J. Stewardson, J. K. H. Zimmerman, & N. LeRoy Poff, 2013. Squeezing the most out of existing literature: a systematic re-analysis of published evidence on ecological responses to altered flows. Freshwater Biology 58: 2439–2451, http://doi.wiley.com/10.1111/fwb.12234.
World Commission on Dams, 2000. Dams and development: A new framework for decision-making : The report of the World Commission on Dams. Earthscan Publications Ltd, London,
Ziglio, G., G. Flaim, & M. Siligardi, 2006. Biological Monitoring of Rivers. John Wiley & Sons.
29
Chapter 2.
Fish traits as an alternative tool
for the assessment of impacted rivers
Lima A.C., A.M.V.M. Soares and F. J. Wrona (2016) Accepted for publication in: Reviews in Fish Biology and Fisheries
31 Abstract
The current scenario of worldwide exponential increase in river impoundment (dams) and the compounded effects of climate change are among the most important threats to freshwater ecosystems. The sharp decline in the biodiversity of impacted rivers demands the enhancement of available tools for biomonitoring and improved approaches for informing environmental decision-making. Here we demonstrate examples of how fish trait analyses could be used to assess and predict the response of fish communities to damming and how this approach has potential advantages over traditionally used methods by linking suits of traits to stressor effects through plausible cause and effect mechanisms. The advantages of using a trait-based analysis include the fact that it transcends taxonomy, can be applied across broad spatial scales and be easily integrated into current assessment programs. Therefore, it might be a promising tool for biomonitoring freshwater ecosystems. The application of this approach has yet some challenges do be surpassed namely the lack of universality by trait–habitat links; the availability, consistency, and applicability of existing trait data; low discriminatory power and poor mechanistic understanding. Adaptive river management can benefit from this approach by sustainably operating dams in the light of knowledge on how the functional structure of fish communities are altered, thus enabling essential habitats for fish to be maintained.
Keywords: biomonitoring, climate, damming, functional ecology, river management
2.1 Introduction
Riverine ecosystems have been altered by human development extensively in the last century (Nilsson et al., 2005; Ferrier & Jenkins 2009; Woodward et al., 2010). As a result, freshwater biodiversity is in sharp decline arising from increased human demands on limited water resources (Dudgeon et al., 2006; Moss et al., 2009; Kingsford et al., 2011). While growing human demands on water resources are placing increasing stress on freshwater systems, the corresponding
development and implementation of appropriate adaptive water management policies and programs have received limited attention (Walters, 1997; Ferrier & Jenkins, 2009). The impoundment or damming of lotic ecosystems is one of the major causes of ecological change in freshwaters associated with human development (Bunn & Arthington, 2002; Poff & Zimmerman, 2010; Webb et al., 2013).
A wide range of studies have shown that dams cause considerable ecological damage by creating, for example, impassable barriers to fish migrations, cause both habitat and water quality degradation, and through storage and altered discharge regimes, reduce the seasonality and variability of instream flows (e.g., Poff et al., 2007; Olden & Naiman, 2010; Liermann et al., 2012). The alteration of the natural flow regime is considered to be a major cause of ecological change in freshwater systems (Bunn & Arthington, 2002; Poff & Zimmerman, 2010). Increasing evidence also indicates the negative ecological effects of riverine impoundments is also likely to be exacerbated by climate variability and change (Vorosmarty, 2000; Chu et al. 2005; Moss et al., 2009; Palmer et al., 2009). Temperature, precipitation and runoff patterns are expected to be altered, consequently affecting water dynamics in already impacted rivers (Kundzewicz et al., 2007). For example, in the Arctic, climate warming has increased the effects of dams by contributing to thinner ice cover and weaker spring flows, greatly decreasing the incidence of ice jams, and leading to the changes in the community structure or loss of periodic inundation-dependent species (Schindler, 2001; Wrona et al., 2006; Prowse et al., 2006b; Prowse et al., 2009; Prowse et al., 2012). Moreover, the distribution and migration of rare species and cold water fish are likely to be even more limited by warming and the low availability of water caused by climate change and the barriers imposed by impoundments (Chu et al., 2005). These conditions also favor the survival of non-native species worldwide that can lead to the loss of local endemic populations. Overall, impoundments and other anthropogenic stressors have reduced the ability of rivers to adjust to environmental disturbances that will be exasperated by increased flooding or water shortages resulting from climate change (Palmer et al., 2009).
33 Given the scenario of increased water demand, climate change and increasing anthropogenic and environmental stressors arising from the development and use of river basins, improved bioassessment approaches need to be developed to better monitor, evaluate and predict how species assemblages will adapt or cope with the cumulative effects of environmental change.
Bioassessment examines the state of the biological community of rivers and streams by using essentially taxonomic metrics (i.e., species richness, abundance and biological indexes; Barbour et al., 1999). It is applied in conjunction with other factors such as water quality, in-stream habitat, stream flows and riparian condition to assess the overall health of aquatic ecosystems. A potentially valuable bioassessment approach that could be used to better inform management decisions addressing the conservation and protection of aquatic life involves the analysis of species biological traits. The functional relationship between species biological traits and environmental stressors have been explored previously (Statzner et al., 2001). Nevertheless, the application of trait-based approaches has evolved over time, the focus changing from simple descriptions of general life-history tactics and related evolutionary mechanisms to more detailed analyses of habitat pressures that determine the patterns of associated species traits (Menezes et al., 2010). Examples of the trait-based approaches include: the prediction of fish distributions and invasion success in relation to hydrologic alterations from impoundments (Olden et al., 2006); the prediction of fish reproductive success (Craven et al., 2010); and the application in managing impacted rivers by introduced species (García-Berthou, 2007). Certain biological traits can also be used as predictive measures of community functional diversity (Petchey & Gaston, 2006; Menezes et al., 2010).
The extensive research assessing the effects of dams on riverine systems have mostly often used fish along with macroinvertebrate communities to assess the ecological consequences of damming (Menezes et al., 2010; Liermann et al., 2012). Fish are probably more diverse at all taxonomic levels and have more species than all other groups of vertebrates (Nelson, 1994). The functional role fish have in freshwater systems is often coupled tightly to trophic cascades (Hargrave, 2009), ecosystem connectivity and resource subsidies (e.g., migration of pacific salmon; Schindler et al., 2003). Additionally, fish constitute one of the most valuable
wild foods and recreation sources provided by freshwater ecosystems. Consequently, an analysis of the changes in patterns of biological traits in fish communities in response to environmental stressors such dams may provide insights into how fish species are coping with or adapting to altered environmental conditions. Fish are well-suited for such analysis since populations are usually isolated in watersheds where they have adapted to their environment (Lamouroux et al., 2002), the behavior of individual fish is influenced by local habitat characteristics (Helfman et al., 2009), and their biological traits are relatively well documented (Doledec et al., 1999).
Studies utilizing trait-based approaches to assess aquatic community response to river impoundment are rare and their application to establishing instream ecological flow relationships is largely untested (Mims & Olden, 2013). Also, knowledge on the flow requirements for the maintenance of fish communities that are resistant and resilient to environmental stressors and related perturbations is limited (Bunn & Arthington, 2002).
In this paper we show how a species trait-based approach can be useful in predicting fish community responses to direct and indirect environmental stressors and perturbations, such as river impoundments and climate change. We use data sets from different hydroclimatic regimes to demonstrate how this approach might be an effective biomonitoring tool.
2.2 Climate change and dams – Compounding environmental effects
Climate change brings uncertainties, meaning that historic return frequencies of extreme hydrological and weather conditions can no longer be relied on in water management. The past is no longer the key to the future (Milly et al., 2008). Also, it may compound the negative impact of river impoundments and related flow regulation on freshwater communities. Palmer et al. (2009), suggest that within 50 years, river basins that are impacted by dams or by extensive development will experience greater changes in discharge and water stress than unimpacted, free-flowing rivers.
35 Some of the effects in hydrological processes related to climate change are expected to result from the reduction of stream flows (e.g., projected to be more pronounced in Temperate areas), changes in the amount and form of winter precipitation and the timing of snowmelt (e.g., Northern areas), intensification of hydrological fluxes as a result of the increase in atmospheric temperature and moisture (e.g., Tropical areas) and increases in the magnitude or frequency of extreme events (flood and droughts; IPCC, 2007). Additionally, rivers already impacted by anthropogenic stressors are likely to be less resistant (i.e., able to withstand change) and resilient (i.e., able to recover from change) than free-flowing systems once the ability to absorb disturbances through dynamic movements and flow adjustments, is severely limited (Palmer et al., 2009). For example, in regions expected to experience increased precipitation or early snowmelt in addition to rain, flooding problems may increase (Palmer et al., 2009). Higher flows may lead to unusually high releases of water into downstream areas of dammed rivers. In contrast, in areas where less precipitation and higher temperatures are expected, drawdown of reservoirs may occur, with less water available to sustain environmental flows in the downstream rivers (Palmer et al., 2009).
Compounding interactions between climate change and anthropogenic modification to rivers are difficult to predict because of the multiplicity of human impacts and the need for long-term integrated monitoring and research studies (Daufresne et al., 2004). Table 2.1 provides examples of the potential impacts of climate change and their effect on river flow and possible interactive impacts with the presence of dams under different climates. Dams and climate change are considered disturbances to the river ecosystem, where disturbance, as defined by Lake (2000), occurs when potentially damaging forces are applied to habitat space occupied by a population, community or ecosystem. Hydropower schemes could be defined as press disturbances (Bender et al., 1984) which arise sharply and then reach a constant level that is maintained usually at a constant level. Such press disturbance causes taxa richness and abundance of species to be permanently changed. In contrast climate warming is referred to as a ramp disturbance (Lake, 2000), which may steadily increase in time without an endpoint (and often
simultaneously in spatial scale), resulting in gradual changes in biological community structure.
In a meta-analysis study of French temperate rivers Daufresne & Boët (2007), showed that species composition, diversity, global abundance and size structure of fish communities exhibited important trends related to water warming in large rivers. These changes were mostly linked to temperature effects during reproductive periods. When hydropower schemes were also considered, the resulting effects of nonclimatic anthropogenic disturbances and climate change on fish communities was generally additive. In the tropics, Freitas et al. (2012), suggested that despite of the scarcity of data on the basic ecology of Amazon species, the available information could be used to project the combined effects of climate change and the presence of dams. A decrease in precipitation during the dry season is probably the most severe effect of climate change for fish community in tropical areas (IPCC, 2007). The reduction in the aquatic habitat area like floodplains can push resident species to their limit and cause local extinctions (Humphries & Baldwin, 2003). Also, an increase in the temperature regimes arising from climate change can further exacerbate hypoxic or anoxic conditions naturally observed in some lentic habitats like reservoirs (Freitas et al., 2012).