CARACTERIZAÇÃO E ANÁLISE DE
SELFIES
E
FLÁVIO GONÇALVES HENRIQUES DE SOUZA
CARACTERIZAÇÃO E ANÁLISE DE
SELFIES
E
FOTOS COM FACES NO INSTAGRAM
Dissertação apresentada ao Programa de Pós-Graduação em Ciência da Computação do Instituto de Ciências Exatas da Univer-sidade Federal de Minas Gerais como req-uisito parcial para a obtenção do grau de Mestre em Ciência da Computação.
Orientador: Virgílio Augusto Fernandes Almeida
FLÁVIO GONÇALVES HENRIQUES DE SOUZA
CHARACTERIZATION AND ANALYSIS OF
SELFIES AND PHOTOS WITH FACES ON
Dissertation presented to the Graduate Program in Computer Science of the Fed-eral University of Minas Gerais in partial fulfillment of the requirements for the de-gree of Master in Computer Science.
Advisor: Virgílio Augusto Fernandes Almeida
c
2015, Flávio Gonçalves Henriques de Souza. Todos os direitos reservados.
Souza, Flávio Gonçalves Henriques de
S729c Characterization and analysis of selfies and photos with faces on Instagram / Flávio Gonçalves Henriques de Souza. — Belo Horizonte, 2015
xxiv, 74 f. : il. ; 29cm
Dissertação (mestrado) — Universidade Federal de Minas Gerais – Departamento de Ciência da
Computação
Orientador: Virgílio Augusto Fernandes Almeida
1. Computação – Teses. 2. Redes sociais online – Teses. 3. Instagram. 4. Selfies. 5. Análise espacial (Estatística). I. Orientador. II. Título.
For those who believe that a better world is made of better people.
Agradecimentos
Agradeço à minha família pelo suporte constante e imprescindível, que me fez chegar até aqui.
Agradeço à Priscilla pelo apoio incondicional, pelo carinho e pela paciência, em todos os momentos.
Agradeço ao meu orientador, Prof. Virgílio, que acompanhou o trabalho e sempre buscou viabilizar todos os recursos necessários, nos âmbitos técnico e pessoal, para a concretização deste estudo.
Agradeço aos meu colegas de laboratório e aos parceiros de pesquisa pelas inúmeras ideias, pelas empreitadas em conjunto e pelas trocas de experiências, as quais contribuíram de forma significativa para a minha formação.
Agradeço à CAPES e ao CNPq pelo fundamental auxílio financeiro.
Agradeço à Deus, sem o qual nada disso teria sido possível.
“Oh, now. How you know how I can see ‘less you can look out my eyes?” (Hoke, from the movieDriving Miss Daisy)
Resumo
A rede social Instagram tem crescido continuamente desde seu lançamento em 2010. Um tipo particular de foto postada na rede que tem atraído atenção nos últimos anos é o selfie, um autorretrato tirado com um dispositivo digital e publicado em um web-site de mídia social. Apesar da existência de alguns trabalhos que exploram certas características do Instagram, poucas pesquisas foram realizadas a respeito dos fatores associados à presença de selfies online. Esta dissertação busca preencher essa lacuna apresentando um estudo sobre as características de selfies, fotos com faces e imagens em geral postadas no Instagram. Um conjunto de dados com mais de 150 milhões de mídias do Instagram, bem como metadados dos usuários, foi coletado usando uma versão modificada de uma ferramenta de coleta especialmente desenvolvida como parte desta dissertação. Diferentes amostras foram cuidadosamente extraídas do conjunto de dados original a fim de executar três tipos de investigação: caracterização, análise temporal e análise espacial. Os resultados mostram, coletivamente, que selfies são muito populares e que são diferentes de outros tipos de conteúdo. Ao capturar quan-titativamente essas diferenças, este trabalho contribui para uma melhor compreensão do fenômeno dos selfies, servindo como ponto de partida para outras pesquisas a re-speito de importantes tópicos relacionados, como normas culturais digitais e design de plataformas sociais online.
Palavras-chave: Instagram, Selfies, Fotos com Faces, Computação Social.
Abstract
Instagram use is continuously raising since it was launched in 2010. One particular kind of photo posted on Instagram that has attracted attention in the last few years is the selfie, a self-portrait taken with a digital device and uploaded to a social media website. Despite the existence of some efforts in exploring Instagram social network characteristics, there has been little research on the factors associated with the pres-ence of selfies online. This thesis tries to fill this gap presenting a study about the characteristics of selfies, photos with faces and general pictures posted on Instagram. A dataset of more than 150 million Instagram media, as well as users metadata, has been crawled using a modified version of a data collection tool specially developed as part of this thesis. Different samples were carefully extracted from this dataset in or-der to perform three kinds of investigations: characterization, temporal analyses, and spatial analyses. The results collectively show that selfies are very popular and are different from other types of contents. In quantitatively capturing those differences, this work contributes to a better comprehension of the selfie phenomenon, serving as a starting point for other researches about important related topics, such as digital cultural norms and design of social-networking platforms.
Keywords: Instagram, Selfies, Photos with Faces, Social Computing.
List of Figures
2.1 Two different selfies. (a) A single person “true selfie”. (b) A multiple person
selfie. . . 6
3.1 Two example screens of Instagram mobile application. . . 14
3.2 Example of different filters applied to the same photo on Instagram. . . 15
3.3 Examples of some information returned the by the Face++ API face detec-tion service. . . 17
3.4 CAMPS Data Collection Tool architecture. . . 22
3.5 Distribution of IDs throughout Instagram user IDs space. Batches are num-bered from 1 to 200. . . 24
3.6 Description of the data collection process. . . 24
4.1 ECDF and boxplot for number of media by user in each dataset. . . 28
4.2 ECDF and boxplot for number of followers by user in each dataset. . . 29
4.3 ECDF and boxplot for number of followees by user in each dataset. . . 30
4.4 ECDF and boxplot for number of likes in each dataset. . . 32
4.5 ECDF and boxplot for number comments in each dataset. . . 33
4.6 ECDF and boxplot for the number of hashtags in each dataset. . . 34
4.7 Top-10 most used filters in each dataset. . . 35
4.8 Proportion of pictures with a single face, multiple faces, no faces and un-known number of faces. . . 36
4.9 ECDF and boxplot for the number of faces in each dataset. . . 37
4.10 Relationship between the number of users in photo, as indicated in images metadata, and the number of faces detected by Face++. . . 38
4.11 Density plot of ages per gender. Median values are indicated by dashed lines. 38 4.12 Smiling values per gender and age. . . 39
5.1 Variation in the number of media of users in each dataset. . . 42
5.2 Variation in the number of followers of users in each dataset. . . 43
5.3 Variations in the number of followees of users in each dataset. . . 44
5.4 Evolution of number of posts and number of users in each dataset relative to the first quarter of 2012. . . 46
5.5 Evolution of geometric mean number of likes and comments in each dataset. 48 5.6 Evolution of geometric mean number of hashtags and proportion of filtered photos in each dataset. . . 49
5.7 Evolution of average number of faces in each dataset. . . 50
5.8 Evolution of proportion of female faces in each dataset. . . 51
5.9 Evolution of proportion of age bands in each dataset. . . 52
5.10 Evolution of average smiling values in each dataset. . . 53
6.1 Distribution of Instagram pictures (alldataset) around the world. . . . 55
6.2 Distribution of faces and selfies relative to all. Countries with no data available are colored in grey. . . 57
6.3 Gender ratio per country. Countries with no data available are colored in grey. . . 59
6.4 Average smiling value per country. Countries with no data available are colored in grey. . . 60
List of Tables
3.1 List of all information collected and used in this thesis. . . 25 3.2 Description of the datasets built from the data collected. . . 26
4.1 Proportions of users with full name, bio, and website fields filled. Differences between datasets are significant atα = 0.05(p <10−15). . . 31
6.1 Top-10 prevalent countries. faces and selfieslists are relative toall. . . . 56 6.2 Bottom-10 prevalent countries. faces and selfies lists are relative to all.
Countries in allhave a prevalence smaller than 0.0001%. . . . 58
Contents
Agradecimentos xi
Resumo xv
Abstract xvii
List of Figures xix
List of Tables xxi
1 Introduction 1
2 Background 5
2.1 The Meaning of Selfies . . . 5 2.2 Advocates and Opponents . . . 7 2.3 Researches on Selfies . . . 8 2.4 Related Work . . . 9 2.4.1 Photos With Faces . . . 9 2.4.2 Instagram . . . 10 2.4.3 Online Photo Sharing . . . 10
3 Data Collection 13
3.1 Face++ Overview . . . 16 3.2 Challenges and Solutions . . . 16 3.3 CAMPS Data Collection Tool . . . 18 3.3.1 Usage Overview . . . 19 3.3.2 Architecture Overview . . . 19 3.4 Methodology . . . 23 3.5 Final Datasets . . . 25
4 Characterization 27
4.1 Users . . . 27 4.2 Photos . . . 31
5 Temporal Analyses 41
5.1 Users . . . 41 5.2 Photos . . . 45 5.2.1 Number of Posts and Users . . . 45 5.2.2 Interactions . . . 47 5.2.3 Hashtags and Filters . . . 47 5.2.4 Number of Faces . . . 50 5.2.5 Demographics . . . 51 5.2.6 Smiling Values . . . 54
6 Spatial Analyses 55
6.1 Gender Prevalence . . . 58 6.2 Smiling Tendency . . . 61 6.3 Implications . . . 61
7 Conclusion 63
7.1 Contributions . . . 64 7.2 Limitations . . . 65 7.3 Future Directions . . . 65
Bibliography 67
Appendix A Complementary Work 73
Chapter 1
Introduction
Instagram1
use is continuously raising since it was launched in 2010 [Duggan et al., 2015]. As a social network focused primarily on interactions via images, Instagram receives millions of photos every day, posted by users from many places around the world [Instagram Press, 2016].
Recent research has shown that photos with faces are 38% more likely to receive likes and 32% more likely to receive comments on Instagram, even after controlling for social network reach and activity [Bakhshi et al., 2014]. Among photos containing faces, one particular kind that has attracted attention in the last few years is the selfie, a self-portrait taken with a digital device and uploaded to a social media website. The use of the word “selfie” on the Internet has increased so fast that the term was unanimously elected the Word of the Year 2013 by The Oxford Dictionaries [OxfordWords blog, 2013].
Nonetheless, despite the existence of some efforts in exploring Instagram social network characteristics [Jang et al., 2015; Hosseinmardi et al., 2015; Araújo et al., 2014; Silva et al., 2013], there has been little research on the factors associated with the presence of selfies online [Qiu et al., 2015; Tifentale and Manovich, 2015]. This thesis tries to fill this gap presenting a study about the characteristics of selfies, photos with faces and general pictures posted on Instagram, verifying differences and similarities among these groups of media and among the behaviors of users who post them. The results demonstrate that selfies can be a new window to study collective user behaviors, providing important insights into subjects like digital cultural norms and design of social-networking platforms.
1
http://www.instagram.com
2 Chapter 1. Introduction
The main contributions of this work are summarized next:
• Development of a data collection tool for use in OSNs researches;
• A methodology for collecting Instagram data and extracting faces and selfies information;
• A characterization of selfies and users who post them, capturing the current aspects of these subjects;
• A longitudinal analyses presenting how the selfie phenomenon evolved over time, compared to other types of photos;
• A spatial analyses highlighting some characteristics of selfies at a country level;
• New insights about Instagram users and publications in general, which can be used in another researches about this OSN, beyond selfies;
• The starting point for the execution of a complementary project about selfies, which resulted in a publication.
A dataset of more than 150 million Instagram media, as well as users metadata, has been crawled using a modified version of CAMPS Data Collection Tool, a data collection program specially developed as part of this thesis. A second specialized version of the tool was used for Face++ data crawling. This tool, whose source code and documentation is available online, can be modified to suit yet another different data collection scenarios in OSNs researches.
Different samples were carefully extracted from the whole dataset of collected media in order to perform three kinds of investigations: characterization, temporal analyses, and spatial analyses. Photos with faces were identified using the Face++ API [Megvii Inc., 2013] and selfies were identified by the use of hashtags containing the word “selfie”.
3
Temporal analyses demonstrate how selfies presented a rapid growth in the thriv-ing period of 2012 and 2013, both in the number of posts and in the number of users. In these early years, young females dominated the presence in selfies, but today a more diverse community of users in terms of gender and age can be seen in the photos. Ad-ditionally, temporal analyses confirm that selfies tend to receive more attention than other types of contents on the network, allowing to explore in more detail how their popularity has changed over time.
Finally, spatial analyses give an overview about the distribution of selfies, photos with faces and general Instagram pictures around the world. When considering the relative expected amount of pictures per country, there are some countries which show a higher number of selfies, but low number of photos with faces, while for other countries the opposite is true. Together with the patterns found for gender distribution and smiling tendency, this result indicates that factors such as demography and culture should be taken into account in deeper investigations about selfies.
Some of these cultural factors associated with selfies were explored in a comple-mentary project developed using part of the data collected for this thesis. This project resulted in a paper which was accepted at the ACM Conference on Online Social Net-works 2015 (COSN’15) [Souza et al., 2015]. Besides culture, the paper also includes the analysis of photos containing alternative hashtags related to selfies (e.g., #selca
and #me), and the study of selfies as an interaction medium, analyzing gender and age homophily between users who post and like/comment selfies.
Chapter 2
Background
Selfies are a ubiquitous phenomenon of digital culture. The term was named Oxford Dictionaries Word of The Year 2013 [OxfordWords blog, 2013] and included in the online version of the dictionary with the following definition: “a photograph that one has taken of oneself, typically one taken with a smartphone or webcam and shared via social media”1
. This definition gives room for many variations in the content of selfies. In fact, although the classical concept of a selfie generally refers to a single person self-portrait, like the one in Figure 2.1(a), it is common today to find selfies that include other people as well, as exemplified in Figure 2.1(b), and even selfies of body parts other than the face (like arms, legs and thorax) .
Self-portraiture, of course, is not new, and sharing self-portraits likewise pre-dates the Internet [BBC, 2013; Tifentale and Manovich, 2015; Tifentale, 2014]. The rise of selfies, however, is a recent trend in the visual Web, assisted by new technological tools (such as smartphones, webcams and digital cameras) and services (like Flickr, Pinterest, and Instagram) that allow people to better express themselves visually.
2.1
The Meaning of Selfies
Different theories have emerged to explain why people take selfies. Some consider selfies are a mean of self-exploration. As one takes multiple selfies and combine them with different filters, one can re-see herself [Crook, 2014]. A slightly different view is self embellishment, which is grounded in psychological experiments that show people, when exposed to slightly modified pictures of themselves, tend to identify a more attractive version as the original picture [Kilner, 2014]. For others, yet, selfies are a better way of communicating feelings and emotions than text, because they convey facial expressions
1
6 Chapter 2. Background
(a) American actor James Franco, a defender of the selfie culture, and a very active user of Instagram.
(b) Ellen DeGeneres’s 2014 famous Oscar selfie at-tracted so much attention that was worth between $800 million and $1 billion according to an advertising firm working for Samsung2
.
Figure 2.1. Two different selfies. (a) A single person “true selfie”. (b) A multiple person selfie.
and place the person into the message [Wortham, 2013]. With the ability to control picture’s aesthetics, selfies are a perfect tool for showing the world one’s subjective self-image (or a constructed self-image one wants the world to see) [Day, 2013].
A sociological framing recognizes technological possibility to be a necessary con-dition and also highlights other behavioral factors to be important for selfies [Cole, 2015c]. One is a culture of sharing and belonging fostered by the online environment and transmitted through memes. Another is the constant work of shaping and reaf-firming self-identity through social actions. In this perspective, selfies are more than a mere collection of individual pictures but a convention governed by culture and society.
Moving forward, selfies are being interpreted by some as an emerging sub-genre of self-portraiture [Tifentale, 2014]. In fact, others already recognize them as an art form, like the curators of the National#Selfie Portrait Gallery launched at the contemporary video art fair Moving Image London 20133
, and the creators of Selfeed4
, a website which shows an endless stream of selfies posted on Instagram in real-time. As an art form, selfies pose a stylistic structure, where a face is normally in the foreground and details are in the background to transmit elements of a rhetorical scene. In many selfies, the equipment that captures the photo is present within the frame (see Figure 2.1(a)), which confers credibility by evincing the technological mediation [Losh, 2014].
2
http://www.nbcnews.com/tech/social-media/ellens-oscar-selfie-worth-1-billion-n75821
3
http://www.moving-image.info/national-selfie-portrait-gallery
4
2.2. Advocates and Opponents 7
2.2
Advocates and Opponents
Selfies are a prominent online culture that have been both criticized and advocated by different parties. Some critics say selfies are vain, narcissistic, and attention-seeking; they argue a wide adoption of selfies by women reflects self-objectification and male gaze [Cole, 2015a]. Self-objectification is also known to be positively correlated with increasing photo sharing activities on Facebook among young women [Meier and Gray, 2014].
Others argue selfies increase demand for plastic surgery. The American Academy of Facial Plastic and Reconstructive Surgery reports that 33% of surgeons have seen an increase in requests for plastic surgery as a result of patients being more self aware of their looks because of social media [Winneberger, 2014]. Another research also demon-strates that adults who own personality traits known as the Dark Triad (narcissism, psychopathy and Machiavellianism) have a higher chance of posting selfies and edited images on social networks [Fox and Rooney, 2015]. This leads to a worry about the loss of control over one’s self-image in an increasingly sharing and hackable culture, where the mere presence of a person’s picture in a photo collection can reveal a large amount of information about that person [Dey et al., 2014]. This kind of worry takes on special relevance given recent news related to the use of facial recognition technol-ogy in surveillance operations, raising concerns over privacy issues [Risen and Poitras, 2014].
Defenders of the selfie culture not only deny the previous claims but argue selfies are the pinnacle of control and self-expression; selfies allow people to take control over how they and their peers are represented in the public, which mobilizes the power dynamics of representations and promotes empowerment [Cole, 2015b]. One study in-terviewed 20 participants who had posted sexual self-portraits and showed how the exchange of such self-portraits can be a transformative experience, increasing their self-awareness in a positive manner [Tiidenberg, 2014]. Being able to reclaim the rep-resentation of their bodies, people can rethink their concepts of beauty and dissociates what advertisers want them to believe a beautiful photography is from what they believe a beautiful photography should be [Gervais, 2013].
8 Chapter 2. Background
2.3
Researches on Selfies
In contrast to the rich body of works on sociological interpretation of selfies, relatively little attention has been given to data-driven analysis of the subject.
In the intersection of computer science and psychology, Qiu et al. [2015] examine the association between selfies and personality, as well as zero-acquaintance personality judgment, by measuring participant’s personality traits (agreeableness, conscientious-ness, neuroticism, and openness) and coding their selfies using a series of cues. The results show that selfies reflect their owner’s personality traits, but observers could only accurately judge selfie owner’s degree of openness, which differs from findings of pre-vious researches. The authors discuss the possible relationship between this difference and the impression management carried out by social media users. In a subsequent study, Chandra et al. [2015] enhances the previous framework for selfie owners person-ality analysis by constructing an automatic personperson-ality prediction model. They employ visual features as low-level cues and personality cues as mid-level cues. Low-level cues are extracted from selfies and used to train mid-level cue detectors, which are then used to predict users’ personality.
Exploring the content of pictures, Joshi et al. [2014] proposes a method to find clusters of selfies on Twitter. After extracting faces, the photos are clustered using visual similarity and them ranked based on average visual similarity among faces and average size of faces. Yeh and Lin [2014] aim at helping users to take aesthetic better selfies, focusing on angle to evaluate visual quality. They compute patterns from a dataset of profile pictures and combine then with head pose estimation and camera orientation, building an algorithm able to recommend a good look before the photo is captured.
A report by eBay Deals Blog describes the top 25 celebrity accounts on Twitter and Instagram by number of selfies posted. Among the most famous Twitter users, women dominate the field when it comes to selfies. Instagram selfies, however, show a much more even spread of men and women. According to the report, Instagram is used for vastly more celebrities who post selfies than Twitter [eBay Deals Blog, 2013]. A research conduced by TIME looked at how many “selfies per capita” were produced in 459 cities by dividing the amount of users posting selfies by the population of each city. They noticed that it was difficult to find a proper local translation for the hashtag #selfie, as different variations were used everywhere [Wilson, 2014].
The largest scale analysis of selfies to date, however, probably was a data vi-sualization project called Selfiecity5
. As described by Tifentale and Manovich [2015],
5
2.4. Related Work 9
the data collection for the project happened in 2013, gathering Instagram photos from different locations. After sampling and manually filtering the original data, the fi-nal dataset comprised 3,200 single person self-portraits from five big cities around the world. Aiming at showing that no single interpretation of the selfie phenomenon is cor-rect by itself, they extracted over 20 measurements using computer analysis and built a series of data visualizations upon them. Among the main results, they found people take less selfies than often assumed (only 3–5% of the images in their dataset were actually selfies), females take significantly more selfies than males, and most people in the photos are pretty young (23.7 estimated median age).
Nonetheless, many aspects of selfies have not yet been studied under the perspec-tive of data analysis, remaining as open topics for new researches. This thesis tries to fill this gap presenting a study about the characteristics of selfies, photos with faces and general pictures posted on Instagram. The differences and similarities among these groups of media are explored, as well as differences and similarities in the behaviors of the users who post them.
2.4
Related Work
This section describes several findings from researches on three topics related to this work: photos with faces, Instagram, and online photo sharing.
2.4.1
Photos With Faces
One source of inspiration for this thesis was the research of Bakhshi et al. [2014]. In their study they also use a sample of Instagram photos in conjunction with Face++ to identify photos with faces. They investigate how the presence of a face, it’s age and gender might impact social engagement on the photo. They find that photos with faces are 38% more likely to be liked and 32% more likely to be commented on, but that the number of faces, their age and gender do not have significant impact.
10 Chapter 2. Background
Changing the classification subject to ambiance instead of beauty, Redi et al. [2015a] try to determine what kind of visual cues can be used to infer a place’s ambiance, clientele and activities by observing the profile pictures of its visitors. They propose predictors based on aesthetics, colors, emotions, demographics and self-presentation, comparing people classifications with algorithmic classifications. People and algorithm does not always agree in the use of predictors, but while the machine is more accurate at times, humans perform better in other occasions.
2.4.2
Previous works have explored Instagram at multiple levels, from a comparative study of differences between teens and adults [Jang et al., 2015] and an investigation of general users practices [Araújo et al., 2014] to a broad analysis of users activities, demographics, social network structure, and user-generated content [Manikonda et al., 2014]. In particular, Hu et al. [2014] adopt a mixed approach, categorizing photos posted on the network and then verifying how do users differ based on the types of images they post. Two of the proposed categories are Selfies and Friends, which remarkably represent nearly half of the photos in their dataset, with slightly more self-portraits.
Instagram can also be viewed as a proxy to study online user behaviors. For in-stance, media comments can be examined to detect cyberbullying and cyberaggression incidents [Hosseinmardi et al., 2015], Instagram photos shared on Twitter can be used as sensors to study users characteristics in different cultures [Silva et al., 2013], and the mobile application itself can serve as a tool to investigate how users communicate their experiences while visiting a museum and work to construct their own narratives from their visits. Using the Cultural Analytics framework , Hochman and Schwartz [2012] and Hochman and Manovich [2013] also show how the spatio-temporal visualization of large sets of Instagram images can offer social, cultural and political insights about people’s activities in particular locations and time periods.
2.4.3
Online Photo Sharing
2.4. Related Work 11
visual features (aesthetical properties and semantical content) on photos popularity, comparing with the predictive power of social cues.
Profile pictures on Facebook are examined by Huang and Park [2013] to demon-strate self-presentation differences between East Asians and Westerns, thus confirming previous findings of social psychology about cultural variations. Kim and Gweon [2014] interview Facebook users in order to uncover privacy preferences of a person in a photo (subject) according to her relationship with the person sharing the information (owner) and the person receiving the information (viewer). Interviews are executed by Miller and Edwards [2007] too, this time with Flickr users, to explore several practices that have evolved around online sharing websites, and how those practices contrast with more traditional digital photo sharing. Flickr photos provide yet the base for Schi-fanella et al. [2015] in the task of find beautiful pictures from the immense pool of unpopular items aided by computer vision methods, and for Crandall et al. [2009] in their approach to automatically identify places that people find interesting (both at city and landmark scales) and predict these locations from visual, textual and temporal features.
Chapter 3
Data Collection
Instagram is a free online social network (OSN) for photo and video sharing, whose main functionalities are available through its mobile application. It was launched on October 2010 for iPhone only and rapidly gained popularity, reaching 10 million users less than a year after. It was named “iPhone app of the year” by Apple on December 2011 and was bought by Facebook 4 months later, right after launching a version for Android. Today, Instagram is also available for Windows Phone and enables its users to share contents on a variety of other social networking platforms, such as Facebook, Twitter and Tumblr. Instagram has recently reached 400 million monthly active users, with more than 40 billion pictures shared on the network [Instagram Press, 2016].
The OSN offers the possibility to view public user profiles on the web, as well as to execute some actions using a web browser after logging in on its website. However, the full range of features is available exclusively in the mobile application, and, likewise, new accounts can be created solely through the app. This enforces Instagram’s focus on mobile devices and its nature as an OSN to capture and share moments of life on the go.
Figure 3.1 shows two of the screens that can be accessed on Instagram mobile application. The app lets the user to take a picture or a short video (3 to 15 seconds long), edit its visual and metadata properties and post it on the network, with the option to share it on other OSNs too. In the case of metadata properties, users can add, for instance, hashtags, geolocation information, and a caption for the picture. Among visual properties, Instagram is particularly famous for its rich gallery of filters. Filters are pre-defined modifications a user can apply to a photo when posting it on Instagram. Each filter represents a different set of modifications, changing aspects of the picture like color, tint, shade, exposure, contrast, and saturation, among others. Figure 3.2 shows the result of some filters applied to the same photo.
14 Chapter 3. Data Collection
(a) User profile information. (b) Photo information.
Figure 3.1. Two example screens of Instagram mobile application.
Social interactions in the network can occur at user level or at post level. At user level, it is possible to “follow” or be “followed by” another users. The relationship is not symmetric, meaning that it is possible to follow someone and not be followed back, and vice-versa. Posts, followers and follows counts can be seen at the top of Figure 3.1(a).
15
(a) Normal (original picture, no filter applied) (b) Valencia
(c) Amaro (d) X-Pro II
Figure 3.2. Example of different filters applied to the same photo on Instagram.
All user accounts are public by default, which means that every content published by a user can be viewed by anyone, including people from outside the OSN, because all user’s publications are available on Instagram website as well as on the mobile application. In addition, public users can’t prevent other users to follow them (although followers can be blocked later). This setting can just be altered through the app, where a user can configure its account as private. Private users’ publications are only visible to their followers, and they cannot be followed without their consent.1
Instagram offers an Application Programming Interface (API) that allows devel-opers to access many of the data published on the network. By making requests to Representational State Transfer (REST) endpoints, it is possible to obtain information of users, media (photos and videos), relationships and comments, among other data types.
1
16 Chapter 3. Data Collection
To use the API it is necessary to log in on Instagram developer’s web page2
using the credentials of a valid user created through Instagram mobile application. Once logged in, it is possible to create a new API client, which receives a client ID and client secret from the system. The ID and secret are required to authenticate the client when connecting to the API.
3.1
Face++ Overview
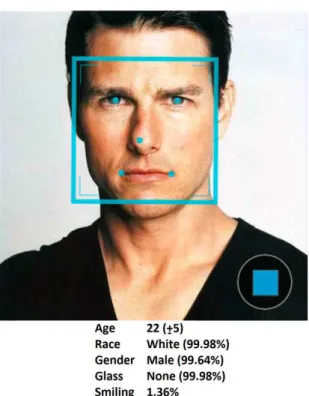
Face++ is a platform that uses computer vision and data mining to provide 3 core vision services (detection, recognition, and analysis), available through an online API. Face++ can detect faces in photos along with some information about each person in the photo, such as age, gender, and smiling, as can be seen in Figure 3.3. Age is given in years along with a confidence range; gender is given as “Male” or “Female”, with a confidence value between 0% and 100%; smiling is given as a percentage, where 100% means a large smile and 0% means no smile at all. The high accuracy of Face++’s detection algorithm has been demonstrated by Bakhshi et al. [2014].
Face++ has a similar infrastructure for developers as that of Instagram. After create an account on Face++ website3
, it is possible to set up newapplications to have access to the API. A Face++ API application is analogous to an Instagram API client and receives anAPI key and anAPI secret that are also used for authentication. All Face++ services are available through requests to specific REST endpoints defined in the API.
3.2
Challenges and Solutions
To make the data collection process as fast as possible, the ideal strategy is to collect each independent data unit in parallel. This requires, however, some kind of coordina-tion to avoid both data duplicacoordina-tion and data loss, guaranteeing that every data unit is collected once and only once. Taking this into consideration, a simple client-server program was initially used for the first Instagram crawling attempts. This program was an adaptation of other ones developed in previous works [Magno et al., 2012; Ot-toni et al., 2013] of our research group. It consisted basically of a crawler script (client side) responsible for collecting the data, and a server script (server side) responsible for distributing data units among crawlers.
2
http://www.instagram.com/developer
3
3.2. Challenges and Solutions 17
(a) Male face with low smiling value.
(b) Female face with high smiling value.
18 Chapter 3. Data Collection
Although that program solved the main problems of data collection distribution, it soon proved to be too restrictive to help with other difficulties that were found along the way. One of these difficulties was related to limitations of Instagram API. For all endpoints, the API establishes a maximum of 5,000 requests per client ID per hour. Each Instagram account can create a maximum of 5 client IDs, giving thus a total of 25,000 requests per hour per account. So, to increase the limit of number of requests per hour it was necessary to create more accounts and more client IDs. But it them brought a new challenge: how to distribute client IDs among crawlers such that the number of available requests was maximized? And, specially, how to do this distribution considering that the number of crawlers was usually greater than the number of client IDs? The best approach seemed to be to centralize this task on the server side, but the current server script at the time was not prepared for that.
A second challenge was the collection of Face++ data. When the adaptation of the data collection program was made, it was intended for Instagram, so the program was entirely customized to the particularities of Instagram API. It was not possible, then, to simply reuse it to crawl Face++ data in a distributed manner, as was desired, without doing a great number of modifications.
These kinds of difficulties led to the consideration that it would be beneficial to spend some time improving the collection program and creating a generic version of it that could be more easily adjusted to different crawling setups. Hence, a step back was taken and a new distributed (client-server) data collection program was developed: the CAMPS Data Collection Tool.
The tool not only solved the previously mentioned issues but also improved the control over the entire crawling process. Besides, other data collection possibilities could be further explored as, for instance, different alternatives for data persistence. Because of its flexible and simple nature, the tool can be very useful for other projects in the future as well, what makes it one of the contributions of this thesis.
3.3
CAMPS Data Collection Tool
Although performance was always a concern during the development of the tool, the main goals were (re)usability, flexibility and extensibility, what explains many of the design and implementation decisions.
3.3. CAMPS Data Collection Tool 19
be written by the user, as this task varies according to resource type, resource origin and other details related to the data in hand. The tool manages the distribution of resources to be collected among multiple clients, enabling and coordinating the crawling of various resources simultaneously.
CAMPS Data Collection Tool source code is available on the Internet, along with usage instructions and modules documentation4
. Sections 3.3.1 and 3.3.2 present an overview of some aspects of the tool as the time of writing of this thesis.
3.3.1
Usage Overview
To set up the collection program, the first step is to write the crawler code to perform the collection of a resource. After that, it is necessary to adjust the appropriate settings inside a XML configuration file. The XML file holds the values for all configuration options used, both for server and client sides.
The next step is to initialize the server, and, when it is running, start as many clients as needed. A manager program comes with the tool, allowing to monitor the data collection process, as well as to perform some actions upon the server (like remove clients or shut it down).
From a high level point of view, the necessary steps to set up and use the tool could be summarized as follows:
1. Implement the crawling code
2. Create a XML configuration file and adjust the appropriate settings inside it 3. Run the server on the desired machine
4. Run as many clients as needed on the desired machines
5. Monitor and manage the collection process using the manager program 6. Wait for the collection to finish
Usage instructions and details about the set up process can be found in the project’s online wiki5
.
3.3.2
Architecture Overview
The program was written in Python 2.7.5 and tested under Linux and Windows. The code is divided in 8 modules: server,client,manager,serverlib,crawler,filters,
persistenceandcommon. The first 3 are executable modules, while the remaining ones are importable modules.
4
http://www.github.com/fghso/camps-dct
5
20 Chapter 3. Data Collection
3.3.2.1 Modules
The 8 modules that comprise the tool can be splitted into 2 different categories: core modules and customizable modules.
Core modules include the server’s library (serverlib) and the executable files to run the services provided by the tool (server, client and manager). These modules should not be modified, unless some special requirement is needed that could not be obtained through modifications of the customizable modules.
The customizable modules, on the other hand, hold the most flexible parts of the tool, which can be adapted or extended to suit user needs. Thecrawlermodule must be modified in order to the program to be useful. Modifications in the other modules (filters, persistence and common) depends on specific details related to the data collection scenario.
A brief description of each module follows:
server
Executable module that just do some initialization procedures before passing control to the serverlib module. The procedures include parse command line arguments and load the XML configuration file.
client
Executable module that holds the client side logic of the tool. Besides also parse command line arguments and load the XML configuration file, this module makes all contacts with the server to request a resource and return the collection results. The data collection itself, however, is done by the crawler module.
manager
An independent executable module that permits to monitor the collection process and execute some management actions upon the server. This module is not necessary to run the tool, but is nevertheless included in the category of core modules because it is not intended, at first, to be modified in an ordinary use of the program.
serverlib
The central module of the tool. The server’s main loop resides in this module and is where all the work is coordinated.
crawler
3.3. CAMPS Data Collection Tool 21
filters
The module that stores all filter classes. Filters are segments of code that can be executed in the server side before a resource is sent to a client and/or after a resource has been crawled. Filters are not essential to the regular work of the server though. They were implemented as a way to easily allow pre- and post-processing of resources when the scenario requires it.
persistence
All persistence handlers classes resides in this module. The main purpose of persistence handlers is to load and save information about the resources being processed. The handlers in this module provide a common interface to persistence operations, freeing the server of the duty to know if the resources are being stored in a file or in a database and how to deal with the particular details of each persistence alternative.
common
This module contains shared code. Functions and classes stored within it are meant to be reused in different parts of the program. Some of them were built just for internal use, but others can also be incorporated in user code as well, and that is why it is included in the category of customizable modules.
Classes and functions of customizable modules are extensively documented in the project’s website6
, with explanations aimed towards developers who want to modify or extended the tool.
3.3.2.2 Workflow
Figure 3.4 shows how the tool’s modules are organized around each other (the common
module is not depicted because it is used by many of the other modules). Blue boxes indicate executable modules. The main server and client libraries appear in green boxes. Filters and persistence modules are represented by yellow and red boxes, respectively. The arrows indicate communication between modules, what happens either when a module import another one or when the modules exchange network messages.
To give a better idea about how the modules work together, one request round of the program is described next:
6
22 Chapter 3. Data Collection
Figure 3.4. CAMPS Data Collection Tool architecture.
1. Server starts 2. Client starts
3. Server receives a client request for connection. It starts a new thread to handle requests for this new client
4. Client requests a new resource ID to crawl
5. Server communicates with persistence handler to obtain a resource ID not yet crawled
6. Having a resource ID to send, server first applies filters (if there are any filters to apply)
7. Server sends the resource ID and filters results to client
8. Client calls user code to do the actual crawling of the resource 9. Client sends the results of the crawling process to server 10. Server calls back filters (if there are any filters to call back)
11. Server communicates with persistence handler to save the status of the crawling process for that resource
12. Back to step 4
In a regular use of the tool, the first module that should be run is the server
executable module. After the initialization procedures, this module transfers control to theserverlib module, where resides the code to handle clients requests. For each new client a new thread is started encapsulating a loop where all transactions between the server and this new client are dealt with.
3.4. Methodology 23
the user code stored in the crawler module. The communication link between the
client module and theserverlib module is the backbone of the client-server model employed in the construction of the tool.
When filters are specified in the XML configuration file, serverlib is also re-sponsible for applying them before a resource is sent to a client and calling them back after a resource is crawled.
At the bottom level of the architecture is the persistence module, containing persistence handlers. Theserverlibmodule always uses a persistence handler to load and save resources. However, the persistencemodule could also be used by filters or even by the crawler if the user wants to (this optional use of the persistence module is indicated in Figure 3.4 by the dashed arrows).
Finally, management operations are performed by the serverlib module in re-sponse to requests made by the managermodule.
3.4
Methodology
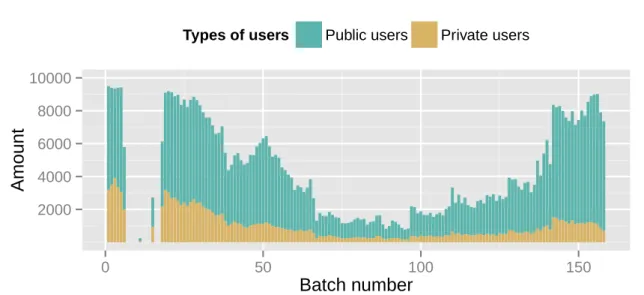
The data collection process started by inferring the range of the space of integer iden-tification numbers (IDs) assigned to Instagram users, as well as the distribution of the IDs throughout this space. The IDs space was sampled with batches of 10 thousand random numbers for every contiguous interval of 10 million IDs, starting from ID zero. Although the process was carried out until reach the ID 2 billion, no valid user could be found after the batch 158. This way, it was possible to conclude that user IDs space on Instagram have a range of approximately 1.58 billion. The distribution of IDs in the IDs space can be seen in Figure 3.5. The IDs do not follow a uniform distribution, but it was not possible to find out why. Anyway, no correlation was found between the distribution of IDs and the users information analyzed in this thesis.
Once the user IDs space was identified, a random sample of 16 million IDs (∼1% of the IDs space) was taken as an initial users set, which was inspected at two points in time: once in December 2014 and once in June 2015. In both occasions, 42% of the initial set corresponded to IDs of valid Instagram users. Valid users are further divided into public and private users. Besides, privacy settings can be changed at any time. So, considering the two inspections made, 30% of the 16 million IDs corresponded to public users (users whose accounts were public both in December and June).
24 Chapter 3. Data Collection
2000 4000 6000 8000 10000
0 50 100 150
Batch number
Amount
Types of users Public users Private users
Figure 3.5. Distribution of IDs throughout Instagram user IDs space. Batches are numbered from 1 to 200.
Selfies
Photos with faces Users and feeds
IDs space
Collected information for each user.
Instagram Face++
Randomly sampled 2M user IDs between
0 and 2 billion.
No valid user found for IDs above 1.58 billion.
Randomly sampled 16M user IDs between
0 and 1.58 billion.
Collected information for each user.
For all public users, collected profiles infor-mation and feeds from 01/2012 to 06/2015.
Extracted all pictures with hashtags containing the
word selfie.
Collected face, age, gender, and smiling
information.
Collected face, age, gender, and smiling
information.
Retained only pictures with at least one face.
Randomly sampled 15M pictures.
3.5. Final Datasets 25
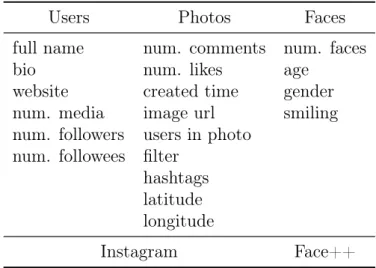
Table 3.1. List of all information collected and used in this thesis.
Users Photos Faces
full name num. comments num. faces
bio num. likes age
website created time gender num. media image url smiling num. followers users in photo
num. followees filter hashtags latitude longitude
Instagram Face++
resulted in 169,030,032 media objects, which include photos and videos metadata. For this study, only photos (the majority of the media objects: 164,114,868) were considered.
Selfies were extracted based on hashtags: all pictures with at least one hashtag containing the word “selfie” (for instance, #selfie,#selfietime, and#selfiesunday) were considered as selfies. Face++ API was used to identify photos with faces and to detect faces in selfies, as well as to obtain age, gender and smiling information about each face found. Figure 3.6 summarizes the whole data collection process and Table 3.1 presents details about the data collected and used in this thesis.
3.5
Final Datasets
Three datasets were built from the data collected:
• all: pictures randomly sampled from the set of all photos collected.
• faces: pictures with at least one face, randomly sampled from the set of all photos collected.
• selfies: all photos with at least one hashtag containing the word “selfie”.
26 Chapter 3. Data Collection
Table 3.2. Description of the datasets built from the data collected.
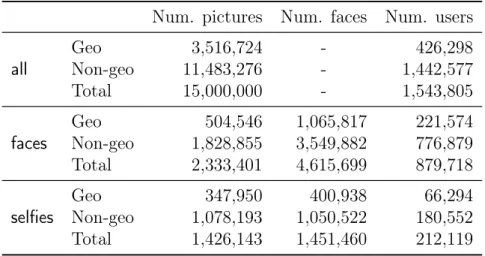
Num. pictures Num. faces Num. users
all
Geo 3,516,724 - 426,298
Non-geo 11,483,276 - 1,442,577
Total 15,000,000 - 1,543,805
faces
Geo 504,546 1,065,817 221,574
Non-geo 1,828,855 3,549,882 776,879 Total 2,333,401 4,615,699 879,718
selfies
Geo 347,950 400,938 66,294
Non-geo 1,078,193 1,050,522 180,552 Total 1,426,143 1,451,460 212,119
the total is not equal the sum of geo and non-geo because the sets of users who posted geotagged photos and non-geotagged photos overlap.
Chapter 4
Characterization
To study differences and similarities between selfies, photos with faces and general Instagram pictures, a characterization is conducted in this chapter taking into account all data available in each of the three datasets. The characterization of users explores the number of media they published, the number of followers and followees they have, and the proportion of users who shared some personal information. In the case of photos, the characterization includes interactions (likes and comments), hashtags and filters usage, and faces information (number of faces, age, gender, and smiling values).
4.1
Users
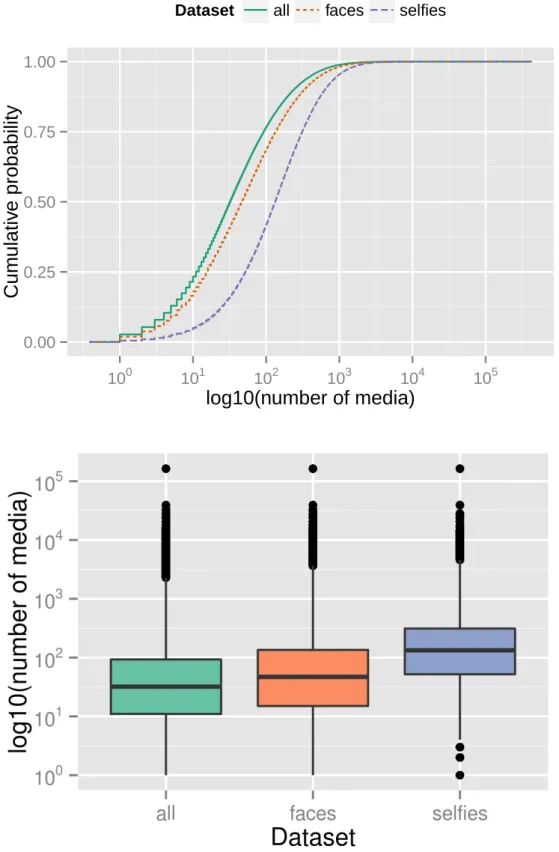
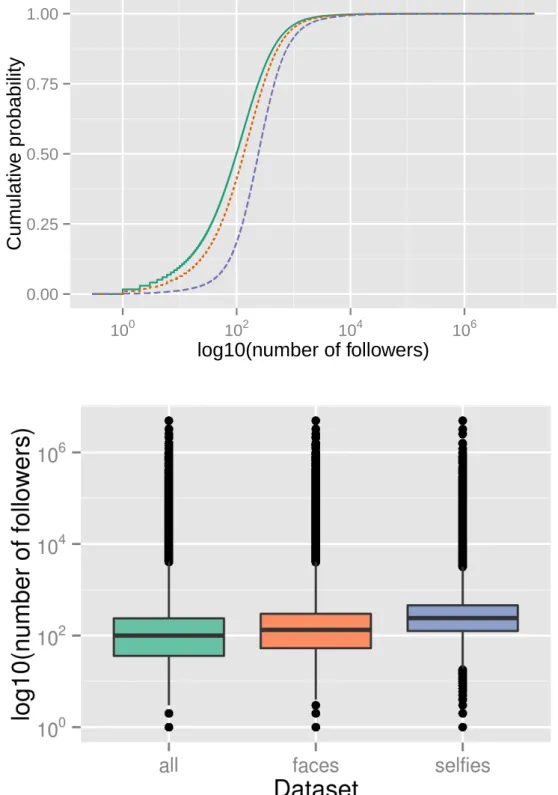
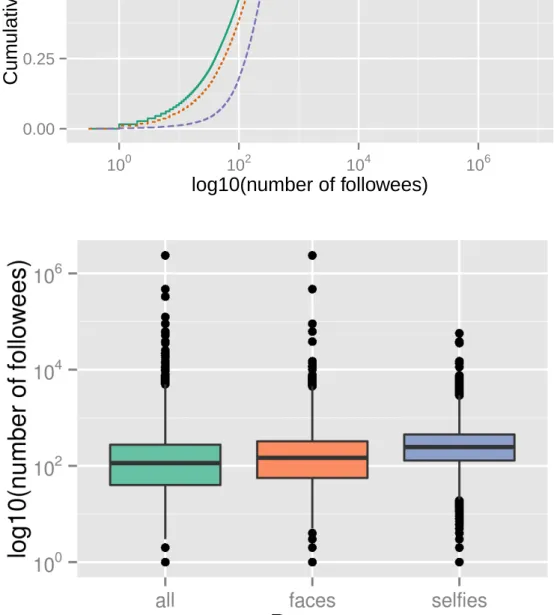
Instagram API provides counts for number of media (photos and videos), number of followers, and number of followees of each user. Figures 4.1, 4.2 and 4.3 show ECDFs and boxplots for these counts, plotted in log10 scale given the skewed nature of the data. Users with no followees and/or followers are not included in the plots, but in both cases they represent less than 3.6% of all users in the three datasets.
It is possible to see that users who post photos with faces have a slightly higher tendency to publish more photos and have more followers and followees than users who post any type of content on the network. For selfies users, however, this tendency is more pronounced. For example, while 77% of users in all have at most 100 published media, this number drops to 42% for users in selfies; and while 50% of users in allhave at most 100 followers, this proportion in selfiesdrops to 19%.
Users can optionally fill some personal information in their Instagram profiles, and these information can be retrieved as part of users metadata. There are 3 available free text fields which users can complete as they wish: full name, bio, and website. Table 4.1 shows the proportion of users in each dataset who have put any kind of information
28 Chapter 4. Characterization
0.00 0.25 0.50 0.75 1.00
100 101 102 103 104 105
log10(number of media)
Cum
ulativ
e probability
Dataset all faces selfies
4.1. Users 29
0.00 0.25 0.50 0.75 1.00
100 102 104 106
log10(number of followers)
Cum
ulativ
e probability
Dataset all faces selfies
30 Chapter 4. Characterization
0.00 0.25 0.50 0.75 1.00
100 102 104 106
log10(number of followees)
Cum
ulativ
e probability
Dataset all faces selfies
4.2. Photos 31
Table 4.1. Proportions of users with full name, bio, and website fields filled. Differences between datasets are significant atα= 0.05 (p <10−15).
Full name Bio Website
all 84% 44% 10%
faces 87% 46% 11%
selfies 90% 74% 19%
in these fields. There is no remarkable difference between users in faces and inall, but users in selfies generally provide more information in their profiles than users in the other datasets.
The comparison of users characteristics in each dataset contributes to a view of selfie users as more active, more connected and more prone to share information than common Instagram users, including those who post general photos with faces.
4.2
Photos
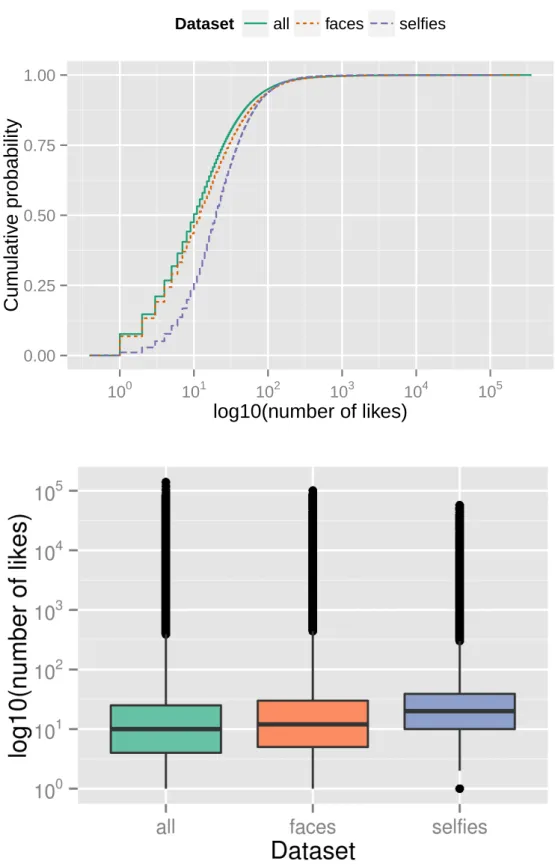
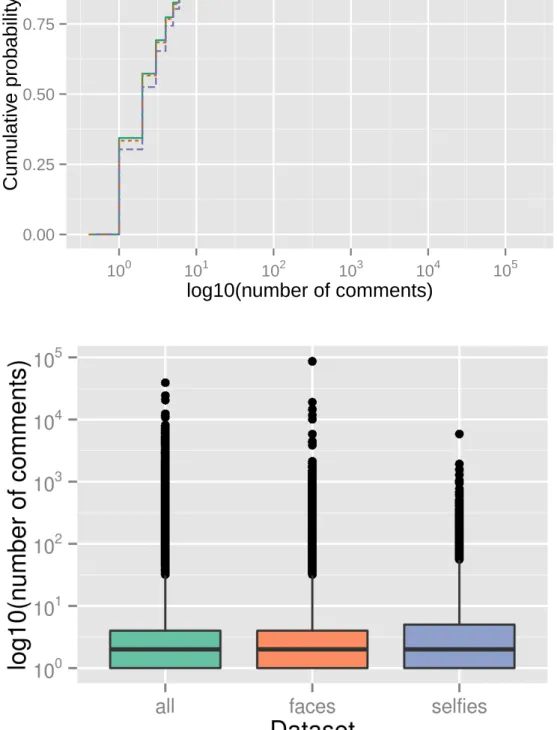
Three categories of data are explored in the characterization of photos. The first one is the interactions category, composed of likes and comments. Figures 4.4 and 4.5 show ECDFs and boxplots for log10 number of likes/comments in each dataset, considering photos with at least 1 like/comment.
The pattern for the number of comments is almost the same in the three datasets. In the case of number of likes, though, the curves indicate that selfies tend to receive more attention: 51% of photos in all (and 46% infaces) have 10 likes or less, but only 26% do so in selfies.
Another important contrast is related to the proportion of pictures with no com-ments or likes in each dataset. 7.7% of photos in all have no likes. The proportion is similar for faces(6.6%), but much smaller forselfies: just 0.6%. As for comments, 62% of pictures in alland 60% of pictures infaceshaven’t received any comment, while this proportion is 44% in selfies.
32 Chapter 4. Characterization
0.00 0.25 0.50 0.75 1.00
100 101 102 103 104 105
log10(number of likes)
Cum
ulativ
e probability
Dataset all faces selfies
4.2. Photos 33
0.00 0.25 0.50 0.75 1.00
100 101 102 103 104 105
log10(number of comments)
Cum
ulativ
e probability
Dataset all faces selfies
34 Chapter 4. Characterization
0.00 0.25 0.50 0.75 1.00
0 20 40 60
Number of hashtags
Cum
ulativ
e probability
Dataset all faces selfies
4.2. Photos 35
all faces selfies
0% 5% 10%
Amaro
X−Pro II Valencia Rise Lo−fi Ma yf air Hudson Unkno wn Ear lybird Sierr a Amaro V
alencia X−Pro II Rise Lo−fi Nashville Sierr a Hudson Ear lybird Ma yf air V
alencia Amaro X−Pro II
Rise Sierr a Lo−fi Ma yf air Nashville W alden Hudson Filter Use
Figure 4.7. Top-10 most used filters in each dataset.
The second category of data studied comprises hashtags and filters. The ECDF and boxplot shown in Figure 4.6 for pictures with at least 1 hashtag reveals a similar pattern for all and faces, with more than 80% of the pictures containing up to 10 hashtags, but a different trend for selfies, where 64% of the photos have 10 hashtags or less. The selfies dataset was generated based on the use of selfie-related hashtags and this way all photos in this dataset have at least one hashtag. For all and faces it was found that the majority of the pictures actually does not contain any hashtag (60% in the former and 63% in the latter).
The three datasets do not seem to vary from each other with respect to filters, except in the order of the most used filters, as exhibited in Figure 4.7. Approximately 50-60% of all pictures in the datasets are not filtered. Among the filtered ones, the two most used filters appear in 10% to 15% of the photos, with other filters appearing in decreasing proportions bellow 10%.
36 Chapter 4. Characterization
58.39
41.63
41.61
17.87
34.57
5.93
0%
25%
50%
75%
100%
faces
selfies
Dataset
Propor
tion
Type
Unknown
No Face
Multiple
Single
Figure 4.8. Proportion of pictures with a single face, multiple faces, no faces and unknown number of faces.
Considering just the subset of pictures with faces inselfies(∼60%), a comparison withfaces dataset shows that selfies are still more connected to the concept of a single person self-portrait, as 69.97% of photos have a single face, in contrast with 58.39% in faces(difference significant atα = 0.05, p <10−15). For multiple faces, however,selfies
presents a similar pattern with respect tofaces, which is observable in the ECDF and in the boxplot of Figure 4.9.
4.2. Photos 37
0.00 0.25 0.50 0.75 1.00
100 101 102
log10(number of faces)
Cum
ulativ
e probability
Dataset faces selfies
38 Chapter 4. Characterization
Figure 4.10. Relationship between the number of users in photo, as indicated in images metadata, and the number of faces detected by Face++.
faces selfies
0.00 0.01 0.02 0.03 0.04
0 20 40 60 0 20 40 60
Age
Density
Gender Female Male
4.2. Photos 39 faces selfies 0 1 2 3
0% 25% 50% 75% 100% 0% 25% 50% 75% 100%
Smiling value
Density
Gender Female Male
(a) Density plot of smiling values per gender. Median values are indicated by dashed lines.
● ● ● ● ●● ●● ●● ● ● ● ● ●● ● ● ●● ●● ● ● ● ● ● ● ● ● ●● ● ●● ● ●●●●●● ●● ●● ● ● ●●● ●●● ●●● ● ● ● ● ● ● ● ● ●● ● ● ●● ● ●●●●●● ● ● ●● ● ● ●●● ●● ● ● ● ● ● ●● ● ●● ●●●●● ● ●●●● ●●● ● ● ● ● ●●●●● ● ●● ●● ● ● ● ● ● ● ●● ● ●● ● ● ●●● ●● ● ● ● ● ● ●● ● ● ● ●● ● ● ● ● ● ● ● ● ● ● ●● ●● ● ● ● ●●●●●● ● ● ● ● ● ●● ● ● ● ● ● ● ● ● ●● ● ● ●●● ● ●●●● ● ●● ●●● ● ● ●● ● ● ●●● ●● ● ● ● ● ● ● ● ● ● ● ●●●●● ● ● ●●● ● ●●● ● ●● ● ● ● ● ●●●● ●● ● ● ●●● ●● ● faces selfies 20% 30% 40% 50% 60% 70%
0 20 40 60 0 20 40 60
Age
A
v
er
age smiling v
alue
Gender ● Female ● Male
(b) Average smiling values per age with 95% confidence intervals.
40 Chapter 4. Characterization
Neither faces nor selfies present a clear relationship between the two variables. Assuming Face++ is likely to give the right number of faces in a picture, due to its high precision face detection algorithm, this lack of relationship with the number of users in photo can be explained either by a low propensity of Instagram users in marking another users when publishing pictures or by the fact that many people who appear in Instagram photos are not current Instagram users and, consequently, cannot be marked. Unfortunately, it is not possible to distinguish these two scenarios without additional data.
Along with face detection, Face++ also provides age and gender information for each face. This information can be used to explore demographics of all people present in the photos of faces and selfies datasets.
In both datasets, the proportion of females is higher than that of males: 58% in faces and 65% in selfies. In Figure 4.11, age and gender are shown together, revealing also that people in the photos tend to be young, specially women. This goes in line with results of other researches showing a prevalence of young females on Instagram [Duggan et al., 2015; Tifentale and Manovich, 2015], and agrees even with information about selfies on another OSN as well [Qiu et al., 2015].
Chapter 5
Temporal Analyses
Social networks are naturally very dynamic, so a static view of the network, although informative, possibly only has the power to represent the state of its entities in a short range of time. Fortunately, all media on Instagram have a timestamp associated with them, giving the day and time in UTC of when media objects have been posted. Besides, users metadata were collected on two points in time, apart six months from each other. This longitudinal data provides a unique opportunity to examine trends for users and photos from 2012 to 2015. Some measures are presented using the geometric mean, instead of the arithmetic mean , because of the highly skewed nature of the data.
5.1
Users
To asses how much do users information in each dataset change over time, a com-parison is made in this section between some users counters provided by Instagram API. Number of media, number of followers, and number of followees are investigated considering their values in December 2014 and June 2015. The results are shown in Figure 5.1.
The variation in number of media published by each user indicates that selfie users worked more on their feeds (either publishing more photos or deleting existing ones) than general users and users who post photos with faces. The geometric mean of number of added or deleted pictures, displayed in the figure along with 95% confidence intervals, allows to observe that the amount of variation is greater for users in selfies than in the other datasets.
A similar pattern is found for number of followers and number of followees, except that the proportion of users who increased their number of followers is almost the same for users in faces and selfies, both being higher than the proportion found for users in
42 Chapter 5. Temporal Analyses
6.36 5.85 11.25
37.52 28.23
8.98
56.12 65.92
79.77
0% 20% 40% 60% 80%
Decrease Equal Increase
Variation
Users
Dataset
all
faces
selfies
15
20
25
30
all
faces
selfies
Dataset
Geometr
ic mean
Variation
Increase
Decrease
5.1. Users 43
17.70 14.67 18.47
9.67 6.26
1.45
72.64
79.07 80.08
0% 20% 40% 60% 80%
Decrease Equal Increase
Variation
Users
Dataset
all
faces
selfies
10
20
30
40
50
all
faces
selfies
Dataset
Geometr
ic mean
Variation
Increase
Decrease
44 Chapter 5. Temporal Analyses
22.2
19.2 20.0 18.9
14.1
3.0
58.9 66.7
77.0
0% 20% 40% 60% 80%
Decrease Equal Increase
Variation
Users
Dataset
all
faces
selfies
10
20
30
40
all
faces
selfies
Dataset
Geometr
ic mean
Variation
Increase
Decrease
5.2. Photos 45
all. This contributes to a view of selfies and photos with faces as more engaging than the ordinary content published on the network, although the geometric mean of number of added followers favours selfies as even more engaging than general photos with faces.
5.2
Photos
In this section a wide range of photo features are studied over time: number of posts and users, interactions (likes and comments), hashtags and filters, number of faces, demographics (gender and age), and smiling values. Number of faces, demographics and smiling values depend on Face++ data, thus the all dataset was excluded from these analyses. Data are grouped in quarters (i.e., three-month periods) in every case.
5.2.1
Number of Posts and Users
Figure 5.4 shows the variation in number of posts and number of users in each dataset over time, where the x-axis represents time in quarters and the y-axis represents the
relative increment or decrement compared to the initial quarter (i.e., the first quarter of 2012). Therefore, a value of 1.0 in this figure means an amount identical to what was measured in the initial quarter and a value of 10.0 means an increment by 10 times.
While the number of posts in all increased 13 times (from 124,473 in the first quarter of 2012 to 1,622,694 in the second quarter of 2015), the number of posts in selfiesincreased rapidly by 846 times (from 245 to 207,204) over the same time period. faces also became popular compared to all, yet not at the same degree asselfies. When comparing the speed, all and faces show a relatively steady growth in the volume of publications, whereas the volume of selfiesgrows fast at first and then becomes stagnant by the middle of 2014.
46 Chapter 5. Temporal Analyses ● ● ● ● ● ● ● ● ● ● ● ● ● ● ● ● ● ● ● ● ● ● ● ● ● ● ● ● ● ● ● ● ● ● ● ● ● ● ● ● ● ● 100 101 102 103
2012 Q12012 Q22012 Q32012 Q42013 Q12013 Q22013 Q32013 Q42014 Q12014 Q22014 Q32014 Q42015 Q12015 Q2
Time (quarters)
Ratio to 2012 Q1
Dataset ● all ● faces ● selfies
(a) Posts ● ● ● ● ● ● ● ● ● ● ● ● ● ● ● ● ● ● ● ● ● ● ● ● ● ● ● ● ● ● ● ● ● ● ● ● ● ● ● ● ● ● 100 101 102 103
2012 Q12012 Q22012 Q32012 Q42013 Q12013 Q22013 Q32013 Q42014 Q12014 Q22014 Q32014 Q42015 Q12015 Q2
Time (quarters)
Ratio to 2012 Q1
Dataset ● all ● faces ● selfies
(b) Users