Trust and power as determinants of tax compliance across 44
nations
Larissa Batrancea
a,, Anca Nichita
a,b, Jerome Olsen
c, Christoph Kogler
c,d,
Erich Kirchler
c, Erik Hoelzl
e, Avi Weiss
f,g,h, Benno Torgler
i,j, Jonas Fooken
k,
Joanne Fuller
l, Markus Schaffner
i, Sheheryar Banuri
m, Medhat Hassanein
n,
Gloria Alarcón-García
o,p, Ceyhan Aldemir
q, Oana Apostol
r, Diana Bank Weinberg
s,
Ioan Batrancea
t, Alexis Belianin
u,v, Felipe de Jesús Bello Gómez
w, Marie Briguglio
x,
Valerij Dermol
y, Elaine Doyle
z, Rebone Gcabo
aa,ab, Binglin Gong
ac, Sara Ennya
ad,
Anthony Essel-Anderson
ae, Jane Frecknall-Hughes
af, Ali Hasanain
ag, Yoichi Hizen
ah,
Odilo Huber
ai,1, Georgia Kaplanoglou
aj, Janusz Kudła
ak, Jérémy E. Lemoine
al,am,
Supanika Leurcharusmee
an, Thorolfur Matthiasson
ao, Sanjeev Mehta
ap, Sejin Min
aq,
George Naufal
h,ar, Mervi Niskanen
as, Katarina Nordblom
at,au,av, Engin Bağış Öztürk
q,
Luis Pacheco
aw, József Pántya
ax,ay, Vassilis Rapanos
aj,az, Christine Roland-Lévy
ba,
Ana Maria Roux-Cesar
bb, Aidin Salamzadeh
bc, Lucia Savadori
bd, Vidar Schei
be,
Manoj Sharma
bf, Barbara Summers
bg, Komsan Suriya
an,bh, Quoc Tran
bi,
Clara Villegas-Palacio
bj, Martine Visser
bk, Chun Xia
bl,bm, Sunghwan Yi
bn,
Sarunas Zukauskas
boa Faculty of Business, Babes-Bolyai University, 7 Horea Street, 400174 Cluj-Napoca, Romania
b Faculty of Economic Sciences, “1 Decembrie 1918” University of Alba Iulia, 15-17 Unirii Street, 510009 Alba Iulia, Romania c
Department of Applied Psychology: Work, Education and Economy, Faculty of Psychology, University of Vienna, Universitaetsstrasse 7, A-1010 Vienna, Austria
d
Department of Social Psychology, Tilburg University, Warandelaan 2, 5037AB Tilburg, the Netherlands
e
Institute of Sociology and Social Psychology, Faculty of Management, Economics and Social Sciences, University of Cologne, Albertus-Magnus-Platz, 50932 Cologne, Germany
f Department of Economics, Bar-Ilan University, 52900 Ramat Gan, Israel
g Taub Center for Social Policy Studies in Israel, 15 Ha’ari Street, POB 3489, 9103401 Jerusalem, Israel h
Institute for the Study of Labor Economics (IZA), Schaumburg-Lippe-Strasse 5-9, 53113 Bonn, Germany
i
School of Economics and Finance and Centre for Behavioural Economics, Society and Technology (BEST), Queensland University of Technology, 2 George St., Brisbane, QLD 4000, Australia
j
CREMA, Center for Research in Economics, Management and the Arts, Südstrasse 11, CH-8008 Zürich, Switzerland
k
Centre for the Business and Economics of Health, University of Queensland, 20 Cornwall Street, Woolloongabba, QLD 4102, Australia
l Eliiza, Level 2, 452 Flinders St., VIC 3000, Melbourne, Australia
m School of Economics, University of East Anglia, NR4 7TJ Norwich, United Kingdom n
Department of Management, School of Business, American University in Cairo, AUC Avenue, P.O. Box 74, New Cairo 11835, Cairo, Egypt
o
Department of Political Science, Social Anthropology and Public Finance, Faculty of Economics and Business Administration, University of Murcia, Campus de Espinardo, 30100 Murcia, Spain
p
Fiscal Observatory of Spain, University of Murcia, Campus de Espinardo, 30100 Murcia, Spain
q Business Faculty, Dokuz Eylül University, Tınaztepe Campus, 35390 Izmir, Turkey r Turku School of Economics, University of Turku, Rehtorinpellonkatu 3, 20014, Turku, Finland
s Department of Business and Economics, Berlin School of Economics and Law, Badenschestrasse 95, 10825 Berlin, Germany t
u National Research University Higher School of Economics, Shabolovka Street 26, 109048 Moscow, Russian Federation v
IMEMO RAS, Profsoyouznaya Street 23, 117997 Moscow, Russian Federation
w
Department of Banking and Investments, University of Las Américas Puebla, Ex.-Hac. Sta. Catarina Martir S/N, San Andres, Cholula 72810, Puebla, Mexico
x
Department of Economics, Faculty of Economics, Management & Accountancy, University of Malta, MSD 2080 Msida, Malta
y International School for Social and Business Studies, Mariborska Cesta 7, 3000 Celje, Slovenia z Department of Accounting and Finance, Kemmy Business School, University of Limerick, Limerick, Ireland
aa Department of Psychology, Faculty of Humanities, University of Pretoria, Lynnwood Road, Hatfield, Pretoria 0002, Gauteng, South Africa ab 570 Ferhesen Street, Brooklyn Bridge, Brooklyn 0181, Pretoria, South Africa
ac
Faculty of Economics and Management, East China Normal University, 3663 North Zhongshan Road, 200062 Shanghai, China
ad
Faculty of Law, Economics and Social Sciences, Ibn Zohr University of Agadir, BP S/1234, 80000 Agadir, Morocco
ae Department of Business Administration, Ashesi University, 1 University Avenue, Berekuso, PMB CT 3, Cantonments, Accra, Ghana af Business School, Jubilee Campus, Nottingham University, Wollaton Road, NG81BB Nottingham, United Kingdom
ag Department of Economics, Lahore University of Management Sciences, Sector U, DHA, 54792 Lahore, Pakistan ah School of Economics and Management, Kochi University of Technology, 2-22 Eikokuji-cho, Kochi 780-8515, Kochi, Japan ai
Department of Psychology, University of Fribourg, Rue de Faucigny 2, CH-1701 Fribourg, Switzerland
aj
Department of Economics, National and Kapodistrian University of Athens, Sofokleous 1, 10559 Athens, Greece
ak
Faculty of Economic Sciences, University of Warsaw, Długa Str. 44/50, 00-241 Warsaw, Poland
al School of Psychology, University of East London, Water Lane, E154LZ London, United Kingdom am ESCP Europe Business School, 527 Finchley Road, NW3 7 BG London, United Kingdom
an Faculty of Economics, Chiang Mai University, 239 Huay Kaew Road, Muang District, 50200 Chiang Mai, Thailand ao
Department of Economics, Faculty of Social Sciences, University of Iceland, Gimli, IS-101 Reykjavik, Iceland
ap
Royal Thimphu College, Faculty of Social Sciences, 1122, Ngabiphu, Thimphu, Bhutan
aq
Department of Economics, Dongguk University-Seoul, 30 Pildong-ro 1-gil, Jung-gu, 04620 Seoul, Republic of Korea
ar
Public Policy Research Institute, Texas A&M University, 4476 TAMU, College Station, TX 77843-4476, USA
as Business School, University of Eastern Finland, PL 1627, 70211 Kuopio, Finland
at Department of Economics, University of Gothenburg, Box 640, SE 40530 Gothenburg, Sweden au Centre for Collective Action Research, University of Gothenburg, Box 711, SE 40530 Gothenburg, Sweden av
Uppsala Center for Fiscal Studies, Uppsala University, Box 256, SE 75105 Uppsala, Sweden
aw
Department of Economics and Management/REMIT, Portucalense University, Rua Dr. António Bernardino de Almeida, 541-619, 4200-072 Porto, Portugal
ax
Department of Social Psychology, Institute of Psychology, ELTE Eötvös Loránd University, Egyetem tér 1-3, 1053 Budapest, Hungary
ay Department of Social and Work Psychology, Institute of Psychology, Faculty of Humanities, University of Debrecen, Egyetem tér 1, 4010 Debrecen,
Hungary
az
Academy of Athens, Panepistimiou 28, 10679 Athens, Greece
ba
Université de Reims Champagne Ardenne, C2S EA 6291, 51097 Reims, France
bb
Applied Social Sciences Center, Graduate School of Accounting, Mackenzie Presbyterian University, Rua da Consolação, 896-Prédio 45, 01302-907 São Paulo, Brazil
bc
Faculty of Entrepreneurship, University of Tehran, 16th Street, North Kargar Avenue, 1439813141 Tehran, Iran
bd Department of Economics and Management, University of Trento, Via Inama 5, 38122 Trento, Italy be
Department of Strategy and Management, NHH Norwegian School of Economics, Helleveien 30, 5045 Bergen, Norway
bf
Department of Humanities and Social Sciences, National Institute of Technology, Hamirpur 177005, Himachal Pradesh, India
bg
Centre for Decision Research, Leeds University Business School, University of Leeds, LS2 9JT Leeds, United Kingdom
bh
Social Research Institute, Chiang Mai University, 239 Huay Kaew Road, Muang District, 50200 Chiang Mai, Thailand
bi Department of Economics, Bridgewater State University, 95 Burrill Avenue, RM 100E, Bridgewater, MA 02324, USA
bj Departamento de Geociencias y Medio Ambiente, Facultad de Minas, Universidad Nacional de Colombia – Sede Medellín, Carrera 80 No. 65-223,
Bloque M2-301, Medellin, Colombia
bk
School of Economics, Faculty of Commerce, University of Cape Town, Middle Campus, Private Bag, Rondebosch, 7701 Cape Town, South Africa
bl
Faculty of Business and Economics, University of Hong Kong, Pokfulam Road, Hong Kong
bm
Noah Holdings Limited, 1687 Changyang Road, Yangpu District, Shanghai, China
bn
Department of Marketing and Consumer Studies, Lang School of Business and Economics, University of Guelph, 50 Stone Road East, N1G2W1 Guelph, Ontario, Canada
bo Department of Psychology, Mykolas Romeris University, 20 Ateities Street, LT-08303 Vilnius, Lithuania
A R T I C L E I N F O Keywords:
Trust Power
Slippery slope framework Tax compliance Tax evasion JEL classification: H10 H20 A B S T R A C T
The slippery slope framework of tax compliance emphasizes the importance of trust in authorities as a substantial determinant of tax compliance alongside traditional enforcement tools like audits and fines. Using data from an experimental scenario study in 44 nations from five continents (N = 14,509), we find that trust in authorities and power of authorities, as defined in the slippery slope framework, increase tax compliance intentions and mitigate intended tax evasion across societies that differ in economic, sociodemographic, political, and cultural backgrounds. We also show that trust and power foster compliance through different channels: trusted authorities (those perceived as benevolent and enhancing the common good) register the highest voluntary compliance, while powerful authorities (those perceived as effectively controlling evasion) reg- ister the highest enforced compliance. In contrast to some previous studies, the results suggest
PsycINFO classification: 2960
that trust and power are not fully complementary, as indicated by a negative interaction effect. Despite some between-country variations, trust and power are identified as important determi- nants of tax compliance across all nations. These findings have clear implications for authorities across the globe that need to choose best practices for tax collection.
1. Introduction
Throughout the history of human civilization, the collection of taxes has been a characteristic of almost all societies that create and share public goods (Adams, 2001). Accordingly, explaining tax noncompliance and identifying determinants of compliance in order to ensure citizens’ contribution to the public good are of utmost importance (Andreoni, Erard, & Feinstein, 1998). Research on tax behavior can be approached from many substantially different perspectives. For instance, from a classical economic perspective that focuses on profit maximization, a social dilemma view where individual interests are in conflict with community interests, or a purely ethical perspective, to name just a few (see for instance, Alm et al., 2012; Andreoni et al., 1998; Hasseldine & Li, 1999; Kirchler, 2007).
During the past decades, empirical research has repeatedly shown that citizens’ perceptions of authorities’ monitoring and ad- ministration actions influence tax behavior (Australian Taxation Office, 2000; Baldry, 1987; Cowell, 1992). Traditionally, policy makers have based their tax collection strategies on enforcement and deterrence (Seligman, 2012), as formalized in the most in- fluential economic models of tax compliance and criminal behavior in general (Allingham & Sandmo, 1972; Becker, 1968; Yitzhaki, 1974). However, institutional deterrence entails higher costs of administration, is susceptible to corruption (Muthukrishna, Francois, Pourahmadi, & Henrich, 2017), and may even reduce tax compliance (Bergman & Nevarez, 2006; Slemrod, Blumenthal, & Christian, 2001) when citizens perceive a violation of their general fairness concerns (Fehr & Rockenbach, 2003). As a result, alternative determinants of tax behavior, as, for instance, fairness considerations, social norms, attitudes, and trust in authorities have gained increased attention in recent years (e.g., Alm & Torgler, 2011; Feld & Frey, 2002; van Dijke & Verboon, 2010; Wenzel, 2004).
The slippery slope framework of tax compliance (Kirchler, 2007; Kirchler, Hoelzl, & Wahl, 2008) serves as a conceptual tool in tax research that allows an integration of different perspectives on tax behavior. The key assumption of this framework is that tax compliance is influenced by two major determinants, i.e., trust in authorities and power of authorities. Trust in authorities represents taxpayers’ perception that tax authorities act benevolently and work for the common good. Power of authorities represents taxpayers’ perception of tax authorities’ capacity to detect and sanction tax evasion. Accordingly, a high level of tax compliance can be achieved either by (1) high trust in the authorities or (2) high perceived power of the authorities (Kirchler et al., 2008).
With regard to compliance behavior, the slippery slope framework differentiates between voluntary and enforced tax compliance as different qualities of cooperation with the authorities. Accordingly, increasing trust in authorities results in voluntary compliance, whereas enhancing the power of authorities yields enforced compliance. Importantly, citizens’ voluntary tax compliance – on the basis that it is dutiful, right, and moral to pay taxes – may provide tax systems with wide-ranging long-term benefits: taxpayers register with authorities for tax purposes, due dates for tax return filing and taxpaying are met, and tax liabilities are accurately disclosed (OECD, 2014). As a consequence, administrative costs incurred by monitoring compliance and auditing honest taxpayers are notably decreased. Consequently, authorities can support voluntary compliance by building a good reputation for delivering on promises, assisting citizens in tax related matters by providing efficient services, treating them with respect, making legislation transparent, and spending tax money wisely (Alm, Cherry, Jones, & McKee, 2010; Braithwaite, 2003). In contrast, enhancing the power of authorities may serve as an alternative means to raise revenues through enforcement (Clark, Friesen, & Muller, 2004). However, in a climate with prevailing high power, most taxpayers defer to the law out of fear of detection or due to a perceived risk of high fines despite motives for noncompliance (Fischer, Wartick, & Mark, 1992). Leveraging enforced compliance requires the pre- sence of a powerful authority that ensures equitable tax regulation, conformity with the law, and effective levying by curtailing noncompliance and tax cheating.
Existing empirical studies testing the assumptions of the slippery slope framework support the assumed impact of trust in au- thorities and power of authorities on tax behavior in experimental studies applying hypothetical scenarios (Kaplanoglou & Rapanos, 2015; Kogler et al., 2013; Wahl, Kastlunger, & Kirchler, 2010), in studies based on large cross-sectional data sets (Lisi, 2012), as well as in representative samples of self-employed taxpayers (Kogler, Muehlbacher, & Kirchler, 2015).
Despite this support for the main assumptions of the slippery slope framework, one important aspect of the relation between trust and power seems unclear given both the theoretical assumptions, as well as the existing empirical evidence. The original version of the framework sketches trust and power as two independent factors, but the authors acknowledge that trust and power might influence and reinforce each other in different ways. For instance, increasing the power of authorities through hiring qualified tax inspectors, setting higher audit rates, and imposing steeper penalties may be interpreted as an efficient and justifiable way to mitigate tax evasion by compliant taxpayers, leading them to trust and comply to a greater degree (e.g., Bergman, 2003; Wenzel, 2003). However, relying too much on power, especially if not used properly to identify free riders, may be perceived as unjustifiable or even as a sign of distrust, resulting in resistance to the tax system and ultimately in noncompliance (e.g., Cialdini, 1996; Frey, 2003). On the other hand, when citizens exhibit higher trust, their support of tax officers (e.g., through whistleblowing) enables authorities to intensify auditing and heighten sanctions. In this vein, a meta-analysis on the effects of deterrence finds specifically that punishment is more effective when trust levels are high (Balliet & Van Lange, 2013), so that trust acts as a moderator when it comes to the effectiveness of authorities’ power.
The results from empirical studies on potential interaction effects of trust and power do not provide conclusive evidence. Studies that empirically tested the assumptions of the slippery slope framework did not find evidence for an interaction effect of trust and power with respect to tax compliance (Kogler et al., 2013; Kogler et al., 2015; Wahl et al., 2010).
The present study provides empirical evidence from a large-scale scenario-based experiment by testing the slippery slope fra- mework in 44 nations from five continents. To test the predictions of the framework across varying environments, the countries were chosen to cover the broadest range of economic, sociodemographic, political, and cultural characteristics (see Tables S1 and S2). As a result, we illustrate the impact of trust and power and their dynamics on four central dimensions of taxpaying: intended tax com- pliance in general, voluntary tax compliance, enforced tax compliance, and intended tax evasion.
In line with the slippery slope framework, we formulate two main hypotheses: (1) high trust in the tax authorities induces a higher level of intended compliance, stronger voluntary compliance intentions, and a lower level of tax evasion than low trust in the tax au- thorities; and (2) high power of authorities induces a higher level of intended compliance, stronger enforced compliance intentions, and a lower level of tax evasion than low power of authorities. Furthermore, the large-scale setting allows us to investigate the potential interaction of trust and power in great detail by comparing different patterns between countries. Based on related previous research, we expect that (3) trust moderates the role of power, namely that the effect of high power versus low power is stronger under the condition of high trust compared to a situation of low trust. Besides the experimental manipulations of trust in authorities and the power of authorities,
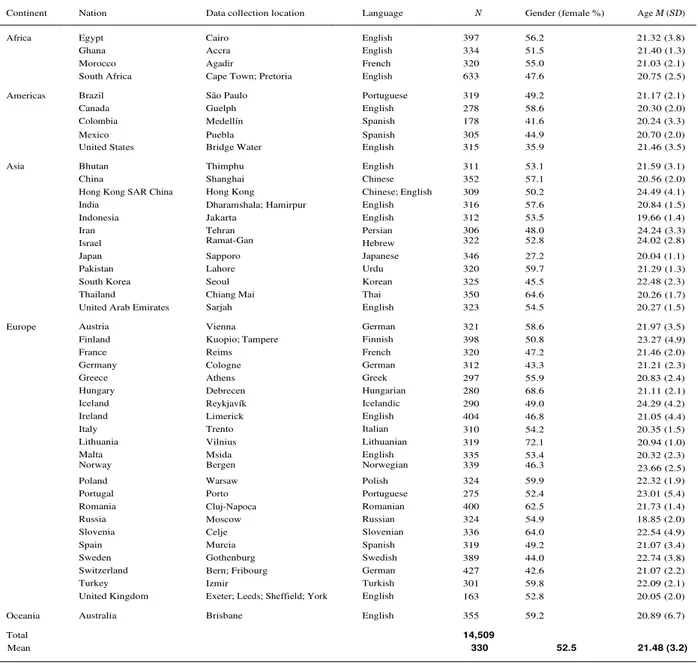
Table 1 Sample characteristics. 21.40 (1.3) 20.75 (2.5) 20.30 (2.0) 21.46 (3.5) 20.56 (2.0) 20.84 (1.5) 24.24 (3.3) 21.29 (1.3) 20.26 (1.7) 23.27 (4.9) 21.21 (2.3) 21.11 (2.1) 21.05 (4.4) 20.94 (1.0) 23.66 (2.5) Total 14,509 Mean 330 52.5 21.48 (3.2)
Continent Nation Data collection location Language N Gender (female %) Age M (SD)
Africa Americas Egypt Ghana Morocco South Africa Brazil Canada Colombia Cairo Accra Agadir
Cape Town; Pretoria São Paulo Guelph Medellín English English French English Portuguese English Spanish 397 334 320 633 319 278 178 56.2 51.5 55.0 47.6 49.2 58.6 41.6 21.32 (3.8) 21.03 (2.1) 21.17 (2.1) 20.24 (3.3) Asia Mexico United States Bhutan China
Hong Kong SAR China India Indonesia Iran Israel Puebla Bridge Water Thimphu Shanghai Hong Kong Dharamshala; Hamirpur Jakarta Tehran Ramat-Gan Spanish English English Chinese Chinese; English English English Persian Hebrew 305 315 311 352 309 316 312 306 322 44.9 35.9 53.1 57.1 50.2 57.6 53.5 48.0 52.8 20.70 (2.0) 21.59 (3.1) 24.49 (4.1) 19.66 (1.4) 24.02 (2.8) Europe Japan Pakistan South Korea Thailand
United Arab Emirates Austria Finland France Germany Greece Hungary Iceland Ireland Italy Lithuania Malta Norway Sapporo Lahore Seoul Chiang Mai Sarjah Vienna Kuopio; Tampere Reims Cologne Athens Debrecen Reykjavík Limerick Trento Vilnius Msida Bergen Japanese Urdu Korean Thai English German Finnish French German Greek Hungarian Icelandic English Italian Lithuanian English Norwegian 346 320 325 350 323 321 398 320 312 297 280 290 404 310 319 335 339 27.2 59.7 45.5 64.6 54.5 58.6 50.8 47.2 43.3 55.9 68.6 49.0 46.8 54.2 72.1 53.4 46.3 20.04 (1.1) 22.48 (2.3) 20.27 (1.5) 21.97 (3.5) 21.46 (2.0) 20.83 (2.4) 24.29 (4.2) 20.35 (1.5) 20.32 (2.3) Oceania Poland Portugal Romania Russia Slovenia Spain Sweden Switzerland Turkey United Kingdom Australia Warsaw Porto Cluj-Napoca Moscow Celje Murcia Gothenburg Bern; Fribourg Izmir
Exeter; Leeds; Sheffield; York Brisbane Polish Portuguese Romanian Russian Slovenian Spanish Swedish German Turkish English English 324 275 400 324 336 319 389 427 301 163 355 59.9 52.4 62.5 54.9 64.0 49.2 44.0 42.6 59.8 52.8 59.2 22.32 (1.9) 23.01 (5.4) 21.73 (1.4) 18.85 (2.0) 22.54 (4.9) 21.07 (3.4) 22.74 (3.8) 21.07 (2.2) 22.09 (2.1) 20.05 (2.0) 20.89 (6.7)
and their effects on different measures of tax compliance intentions, we consider country differences in exploratory analyses.
2. Method
2.1. Participants
The sample included 14,509 undergraduate and graduate students in 44 nations from five continents. Sample homogeneity regarding demographics within and between countries increases the comparability of results in multi-country research studies (Barker Bausell, 2015; Čutura, 2013; Herrmann, Thöni, & Gächter, 2008). We therefore aimed at achieving a homogeneous re- spondent sample pool with regard to demographics and exposure to the topic of taxation, irrespective of the nature of the tax systems implemented in participants’ home countries. The vast majority of the sample (87.5%) consisted of students majoring in Economics and Business Administration. To further promote the homogeneity of the sample, we targeted students aged 18–25 (92.5% of the sample), resulting in a mean age of 21.48 (SD = 3.2). Women account for 52.5% of the participants. The sample attributes by country are presented in Table 1.
2.2. Materials
Participants were randomly assigned to one of four scenarios, developed to manipulate trust and power in a hypothetical country named Varosia, resulting in the following combinations: low trust and low power; low trust and high power; high trust and low power; high trust and high power. All scenarios started with general information about Varosia. Furthermore, Varosia’s size and population were matched with the official statistics of each participating country. A hypothetical country was used to avoid the influence of general perceptions and consequent attitudes toward the home country on the experimental manipulations of trust and power. At the same time, it was important that participants could relate to Varosia and perceptions should be caused by the ma- nipulation alone, which is why described country size and population were matched to the respective home country (see also Kogler et al., 2013).
Every scenario comprised a combination of trust-related and power-related information. In the first part, authorities in Varosia were described either as highly trusted by citizens, transparent, providing free counseling on taxation matters, service-oriented, and concerned about citizens’ opinion (high trust condition) or not trusted by citizens, lacking transparency, not providing free counseling on taxation matters, little service-oriented, and not concerned about citizens’ opinion (low trust condition). In the second part, au- thorities were described as being either highly effective in prosecuting tax crimes, having a large budget to fight tax evasion, and imposing substantial monetary penalties for detected evasion (high power condition) or highly ineffective in prosecuting tax crimes, having a low budget to fight tax evasion and imposing low monetary penalties for detected evasion (low power condition).
After being asked to imagine living and paying taxes in this country as a self-employed business owner, participants filled in a 27- item questionnaire comprising manipulation checks for perceived trust and perceived power, scales on four different types of tax compliance intentions and motivations, items measuring perceived similarity between experimental scenarios and participants’ home countries, and socio-demographics. All rating items used a nine-point Likert-type scale where low values denoted strong disagreement with statements and high values strong agreement.
The first items comprised the manipulation check scales regarding perceived trust in authorities (three items; e.g., “The gov- ernmental authorities in Varosia act fairly towards their citizens”; α = 0.82) and perceived power of authorities (three items; e.g., “The governmental institutions in Varosia are very effective in the suppression of tax criminality”; α = 0.85). The two check scales were adapted from the literature (Wahl et al., 2010).
Subsequently, several items constituting four measures of tax compliance intentions and motivations were administered. The scale for estimating intended tax compliance consisting of three items (e.g., “How likely would you be to pay your tax completely honestly?”; α = 0.77) was also adapted (Wahl et al., 2010). Its reliability was increased to α = 0.86 when leaving out one of the three items. Thus, the scale used for calculating the intended tax compliance models was based on two items only (including the example item above). It can be defined as individuals’ general intentions to pay taxes. Voluntary tax compliance (e.g., “When I pay my taxes in Varosia as required by the regulations, I do so to support the state and other citizens.”; α = 0.84) was assessed with a five-item scale introduced in the literature by a tax compliance inventory termed TAX-I (Kirchler & Wahl, 2010). This scale measures to what extent individuals feel it is their moral obligation to pay taxes. The five items measuring enforced tax compliance (e.g., “When I pay my taxes in Varosia as required by the regulations, I do so because the punishments for tax evasion are very severe”; α = 0.89) were also from the TAX-I. They measure to what extent individuals self-report to pay taxes out of fear of punishment. The voluntary tax compliance and enforced tax compliance scales should be interpreted as different self-stated motivations to comply with tax laws. Finally, five vignettes presenting instances of tax noncompliance appraised respondents’ propensity for tax evasion (e.g., “A customer paid in cash and did not require an invoice. You could intentionally omit this income on your tax return. How likely is it that you would omit this income?”; α = 0.85). This scale can be seen as the opposite of the intended tax compliance scale, but measures intentions through realistic vignettes, rather than attitudinal questions.
In addition, perceived similarity between the scenario and the situation in home countries was measured with three items (e.g., “How similar do you perceive the country of Varosia to be in comparison to your own country?”; α = 0.87). These items were not used in the present paper. Demographics concluded the questionnaire.
The exact wording of the scenarios and items can be found in the supplementary materials. The material originates from the literature (Wahl et al., 2010) and the reported study design was previously used in a four-country comparison (Kogler et al., 2013).
The same design was later applied in three other countries (Carvalho Wilks & Pacheco, 2014; Kaplanoglou & Rapanos, 2015; Lemoine & Roland-Lévy, 2013). The data from these seven countries were incorporated in this extension to reach a total of 44 countries.
The following OSF repository contains the data file and supplementary materials: https://osf.io/2zqnp/.
2.3. Procedure
The study entailed the use of 25 languages in applying the instrument. 19 of these represented official languages spoken in as many distinct countries, as follows: Finnish (Finland), Greek (Greece), Hebrew (Israel), Hungarian (Hungary), Icelandic (Iceland), Italian (Italy), Japanese (Japan), Korean (South Korea), Lithuanian (Lithuania), Norwegian (Norway), Persian (Iran), Polish (Poland), Romanian (Romania), Russian (Russia), Slovenian (Slovenia), Swedish (Sweden), Thai (Thailand), Turkish (Turkey), and Urdu (Pakistan). Chinese was employed for the sub-samples in China (Simplified Chinese) and Hong Kong SAR (Traditional Chinese), Portuguese for respondents from Brazil and Portugal, while sub-samples from France and Morocco were surveyed in French. In the cases of participants from Austria, Germany, and Switzerland we used German, while for participants from Colombia, Mexico, and Spain the working language was Spanish, with some adjustments required by the specificity of the country vernacular. English was employed both for countries listing it as an official language (Australia, Canada, Ireland, Malta, South Africa, United Kingdom, United States) and for countries represented by participants enrolled in English-teaching university programs (Bhutan, Egypt, Ghana, Hong Kong, India, Indonesia, United Arab Emirates). Successful translation was secured through the standard translation-back translation procedure, designed to eliminate potential inconsistencies. Furthermore, collaborators received guidelines to change country-specific information in the material (i.e., population and area description of the fictitious country Varosia).
A standard research protocol was developed to ensure the use of standardized instructions by experimenters in all countries, targeted sample size and composition, as well as sampling method. In some countries (Australia, Brazil, Canada, Egypt, Ireland, Pakistan, South Africa, UK, United Arab Emirates, USA) it was mandatory for co-authors to obtain their own research ethics com- mittee clearance prior to data collection.
The data collection time span was summer 2011 through winter 2013. The average task completion time for participants was roughly 15 min. The vast majority of observations (95%) were collected in paper-pencil format, and the remaining online (Hong Kong, partially Norway and UK). Respondents took part in the study on a voluntary basis and anonymity was guaranteed. With a few exceptions (i.e., course credit in Canada; small lottery in Norway and the UK), respondents did not benefit from any incentives to complete the study.
3. Results
The data of the current study are structured on two different hierarchical levels, therefore multilevel analyses were appropriate to test our hypotheses (Finch, Bolin, & Kelley, 2014). Individuals were randomly assigned to one of four conditions, which, in addition to demographics, represent the individual level (level 1, individual). Furthermore, each participant is a member of a country sub- sample and thereby nested within a class level (level 2, country). On level 1, predictors (trust, power, interaction of trust and power, and demographics) were treated as fixed effects, expressing the average effect of an independent variable over all countries. Ad- ditionally, random effects of trust, power, and their interaction provided the possibility to explore country specific differences with regard to the experimental manipulation. We could thereby quantify the manipulation’s variation across the 44 countries. There were no predictors on level 2.
Prior to running the multilevel models, it was essential to check which proportion of the total variance could be observed on the two separate levels, by examining intraclass correlations (ICC). In order to compute the ICC, the variance between the classes was divided by the sum of variance between and within the classes for each dependent variable. A high ICC (maximum value of 1) indicates little variance within the class level and high variance between classes, denoting more homogenous groups within each class. In return, a low ICC (minimum value of 0) reveals high variance within each class, while different classes are similar, thus indicating heterogeneous classes which are comparable with each other. Table 2 displays the variance components by levels and the ICCs for the two manipulation check scores and the four tax-related dependent variables. The table demonstrates that, as a result of a successful experimental manipulation, the proportion of total variance accounted for by the countries alone is small in the case of all dependent variables, with large variance within each country and little variance between countries. Thus, based on variance com- ponents, one could expect similar patterns of responses across the participating countries.
Correlations between the four tax-related dependent variables are depicted in Table 3. The four dependent measures were moderately correlated, ranging from r = 0.45, p < .001, between intended and voluntary tax compliance to r = −0.38, p < .001,
Table 2
Variance components and ICC coefficients.
Level 2 – Country 0.04 0.02 0.25 0.16 0.11 0.26
ICC 0.007 0.003 0.047 0.045 0.019 0.061
Note. N = 14,509.
Variance components Check trust Check power Intended tax compliance Voluntary tax compliance Enforced tax compliance Tax evasion
Table 3
Intercorrelations between all four dependent variables.
1 2 3
1. Intended tax compliance
2. Voluntary tax compliance 0.450
3. Enforced tax compliance 0.242 −0.037
4. Tax evasion −0.377 −0.338 0.089
Note. N = 14,509. p < .001.
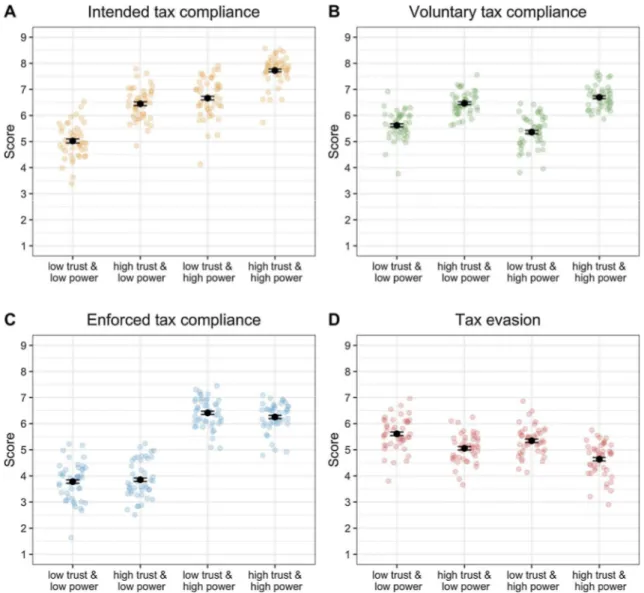
between intended tax compliance and tax evasion. Overall unadjusted means by condition are presented in Fig. 1.
Each of the four dependent variables measuring different aspects of tax compliance was analyzed with three multilevel models. In the first model, the demographic variables gender and age were considered as predictors on level 1, while income was excluded from the main analyses because of country-specific scales used that were not directly comparable. Age was the only continuous variable and was group-centered (Enders & Tofighi, 2007).
In the second model, trust, power, and their interaction were added as fixed effects on level 1, which represent the effect of the experimental manipulations over all countries. Trust and power were dummy coded with 0 = low and 1 = high. Thus, the simple effects express the effect of one variable (e.g., high trust) at the zero-coded level of the other variable (e.g., low power). The interaction term tests the combination of both trust and power described as high.
Fig. 1. Means of tax compliance measures by condition. Note. Black dots represent overall unadjusted means. Error bars indicate 95% confidence
We opted for dummy coding for two reasons: First, using dummy coding, the regression coefficients describe what happens when moving from one of the four conditions to the next one. This is in line with Fig. 1 and makes it easier to understand the pattern of results. Second, it is in line with the theoretical assumptions of the slippery slope framework, where a minimum of trust and power represent the initial starting point (intercept) and an increase in either trust or power leads to voluntary or enforced compliance, respectively.
Finally, in the third model, random effects of trust, power, and their interaction were added to the model, expressing the extent of an effect’s variation between countries. Random effects are reported as effect variance. This means that we still estimate a fixed effect over all countries, but at the same time estimate how much this effect varies between countries (i.e., random slope). Additional tables and figures for each dependent variable illustrate country-specific results that underlie the random effects. An extended explanation of how to interpret random effects is provided in the supplementary materials (see the manipulation check trust section).
For each series of models, we present the Akaike information criterion (AIC), which is an indicator of statistical model quality for given data. In model comparison, a lower AIC evidences a better fit of a model to the data.
A measure of total variance explained (R2) is reported for level 1, because our models only include variance explaining variables
on this level. The proportion of explained variance refers to 1-ICC, which constitutes the total variance observed on the individual level.
3.1. Manipulation checks
The first and second sequence of models with perceived trust and power scale scores as dependent variables serve to confirm that our manipulations of trust in authorities and power of authorities were successful. Here we only report model 3 for both manipulation check scales. See Tables S3–S6 and Figures S1 and S2 of the supplementary materials for details, including an explanation of how to interpret random effects.
3.1.1. Manipulation check trust
Describing authorities as untrustworthy versus trustworthy under conditions of low power was found to be a significant predictor for participants’ level of perceived trust, B = 3.04, p < .001. Increasing power under conditions of low trust also influenced per- ceived trust positively, B = 0.25, p < .001. Additionally, there was a significant positive interaction term, B = 0.79, p < .001, implying that a combination of high trust and high power led to higher perceived trust than the additive effect of the two single effects. With respect to random effects, the highest variation was observed for trust, σ2 = 0.35, χ2(4) = 189.10, p < .001, indicating
that the effect of the trust manipulation, which was the strongest fixed effect, had the largest effect variation regarding between- country comparisons. Irrespective of these variations in effect size, the manipulation of trust was successful in all 44 countries. The random effect of power, σ2 = 0.09, χ2(4) = 28.60, p < .001, and of the interaction, σ2 = 0.18, χ2(4) = 35.80, p < .001, were
significant, but less pronounced.
3.1.2. Manipulation check power
Perceived power was most strongly predicted by portraying the authorities as powerful, B = 3.66, p < .001, under conditions of low trust. Both trust under conditions of low power, B = 0.29, p < .001, and the interaction of power and trust, B = 0.31, p < .001, were positive predictors of perceived power, but had less impact.
There was a relatively high variation for the effect of power, σ2 = 1.28, χ2(4) = 792.20, p < .001. While the effect was sig-
nificant in the same direction in all 44 countries, the most prominent deviations were the UAE on the low end, where the change from low power to high power increased perceived power only by 1.17 units; and Germany on the high end, where the same manipulation impacted on perceived power by 5.68 units, whereas the overall fixed effect was B = 3.66. The random effect of trust was not significant, σ2 = 0.04, χ2(4) = 8.80, p = .070). With respect to the interaction effect, σ2 = 0.28, χ2(4) = 68.10, p < .001, the
variation was significant, although rather small in relative comparison with the random effect of power. Hence, despite evident deviations in impact, these results clearly show that the manipulation of power was successful in all countries.
3.2. Compliance measures 3.2.1. Intended tax compliance
For intended tax compliance (Table 4), model 1 revealed that women had higher intended tax compliance, B = 0.29, p < .001. Age had no significant effect, B = 0.01, p = .091.
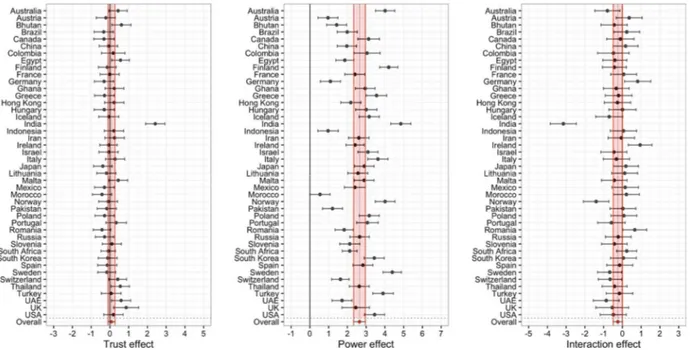
In Model 2, the experimental manipulations were added. Results show significant positive effects of the trust dummy and the power dummy, qualified by a significant negative interaction term (B = −0.37, p < .001). The pattern indicates that high versus low trust increased intended tax compliance under conditions of low power, B = 1.43, p < .001. The effect of trust was smaller, but still significant in the high power condition, B = 1.06, p < .001. High versus low power increased intended tax compliance under conditions of low trust (B = 1.64, p < .001). Again, the effect of power was smaller but still significant under conditions of high trust (B = 1.28, p < .001). This pattern shows that, as hypothesized, both trust and power increased intended tax compliance. However, the combination of high trust and high power was less effective in increasing intended tax compliance than the summation of both simple effects would predict.
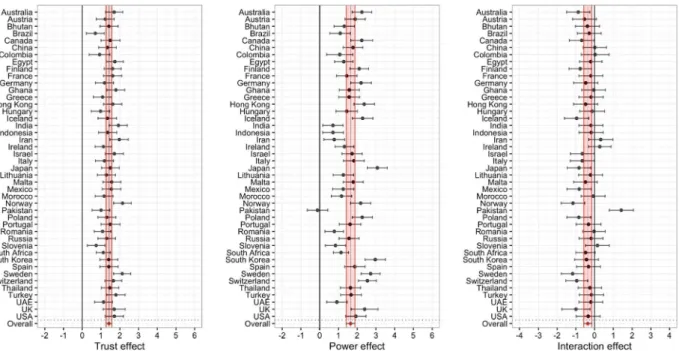
Model 3 introduced random effects of trust, power, and their interaction. The most pronounced random effect was observed for power with σ2 = 0.51, χ2(4) = 164.10, p < .001. However, as depicted in Fig. 2 (also see Table S7), the conditional effect of power
Table 4
Multilevel model for the dependent variable intended tax compliance.
Gender 0.29 0.04 0.30 0.03 0.29 0.03 Age 0.01 0.01 0.01 0.01 0.01 0.01 Trust 1.43 0.05 1.43 0.08 Power 1.64 0.05 1.65 0.12 Interaction −0.37 0.07 −0.36 0.11 Random effects σ2 σ2 σ2 Intercept 0.25 0.25 0.37 Trust 0.17 Power 0.51 Interaction 0.31 Residual 5.08 4.13 4.00 Variance explained Level 1 0.00 of 0.953 0.19 of 0.953 0.21 of 0.953 AIC 64,831 61,892 61,634
Note. N = 14,509. Trust and power were coded with 0 = low and 1 = high. The variable gender was coded with 0 = male and 1 = female. p < .05. p < .01. p < .001.
Japan. Thus, the range of effects was large, but in all significant cases the conditional effect of power was positive. The pattern of effect deviations was more stable for trust, σ2 = 0.17, χ2(4) = 36.50, p < .001. Without exception, coefficients for all countries were
positive and significant, with only four countries deviating from the overall fixed conditional effect. The interaction random effect, σ2 = 0.31, χ2(4) = 36.90, p < .001, revealed that in 13 cases the country-specific results followed the negative overall fixed effect,
in 30 cases the effect can be regarded as non-significant, and in one case (i.e., Pakistan) as positively significant.
Overall, power was the strongest predictor of intended tax compliance, although with relatively large deviations between countries. The effect of trust was similarly pronounced but more stable. AIC indicated best model fit for the third model. The explained variance of the model on level 1 was 21%.
3.2.2. Voluntary tax compliance
With regard to voluntary tax compliance (Table 5), model 1 suggested significant effects of gender, B = 0.25, p < .001, and age,
B = 0.01, p = .027, indicating higher voluntary tax compliance for women. The impact of age was positive, but negligibly small. Model 2 revealed significant results for all fixed effects, with the conditional effect of trust being most prominent, B = 0.85,
p < .001. The conditional effect of power was also significant, with a negative effect of B = −0.26, p < .001, while the interaction term was significant, with B = 0.48, p < .001. Together this means that a combination of high power with low trust lowered voluntary contributions, but when combined with high trust it increased voluntary compliance levels. Numerically, power decreased voluntary compliance by B = −0.26, p < .001, when trust was low, but led to an increase of B = 0.22, p < .001, when trust was high. Furthermore, the simple effect of trust was smaller when power was low, B = 0.85, p < .001, compared to when power was high, B = 1.33, p < .001. As hypothesized, the description of trustworthy authorities generally increased voluntary compliance.
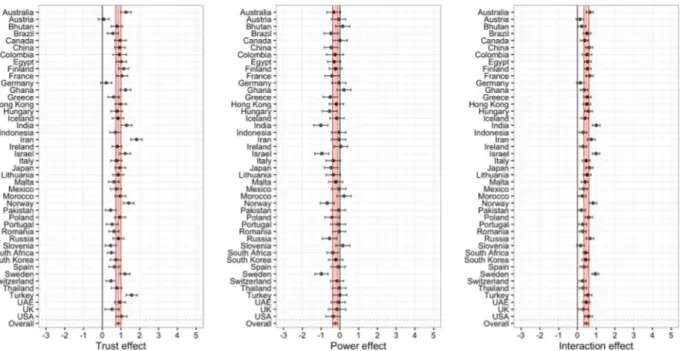
In model 3, the random effect of trust, σ2 = 0.14, χ2(4) = 69.30, p < .001, revealed that trust increased voluntary compliance in
a total of 42 countries (Fig. 3; also see Table S8). The two countries without a significant conditional simple effect of trust were Austria and Germany. Among the 42 countries, effects ranged from B = 0.45 in Pakistan and Slovenia to B = 1.82 in Iran. The variance of power, σ2 = 0.12, χ2(4) = 46.10, p < .001, resulted from 13 countries with significant negative conditional effects of
power, as expressed by the overall fixed effect, and 31 countries with no significant effect. The interaction random effect, σ2 = 0.06,
χ2(4) = 14.30, p = .006, was negligible, expressing a relatively stable positive interaction effect for the majority of countries. Summing up, trust had the largest influence on voluntary tax compliance. High power paired with low trust decreased voluntary contributions, while a combination of high power and high trust led to an increase in voluntary compliance. The best model fit was observed for model 3 with an explained variance of 12% on the individual level.
3.2.3. Enforced tax compliance
As for enforced tax compliance (Table 6), model 1 revealed that men, B = 0.16, p < .001, and older participants, B = −0.01,
p = .039, felt slightly less forced to comply.
In Model 2, the experimental manipulations were added. The results show a significant positive effect of the power dummy but no effect of the trust dummy. Additionally, there was a significant negative interaction, B = −0.22, p < .001. The pattern indicates that high versus low power increased enforced tax compliance under conditions of low trust, B = 2.63, p < . 001. The effect of power was similarly strong in the high trust condition where it increased enforced compliance by B = 2.41, p < .001. High versus low trust had
Model 1 Model 2 Model 3
Fixed effects B SE B SE B SE
1
Fig. 2. Regression coefficients of conditional effects of trust and power, and their interaction for intended tax compliance by country. Note. For each
subfigure, the black vertical line represents a null effect. The thin vertical line illustrates the overall fixed effect parameter, which is augmented by two red lines representing the limits of the 95% confidence interval of the fixed effect, further highlighted by red shading. Black dots indicate country-specific effects, with 95% confidence intervals. If a country-country-specific interval does not include the null effect line, the country-country-specific effect is significant. If a country-specific interval does not overlap with the red shaded area, the country-specific effect significantly deviates from the overall fixed effect. (For interpretation of the references to colour in this figure legend, the reader is referred to the web version of this article.)
no effect on enforced tax compliance under conditions of low power, B = 0.07, p = .128. However, there was a significant negative effect of trust under conditions of high power, B = −0.15, p < .001. This pattern shows that, as hypothesized, power generally increased enforced tax compliance. Trust, on the other hand, had no influence on enforced compliance under conditions of low trust, but lowered such motivations under conditions of high power.
The random effects suggested relatively large effect variations, especially for the conditional effect of power, σ2 = 1.02,
χ2(4) = 442.80, p < .001 (Fig. 4; also see Table S9). While all country-specific effects were positive and significant, the coefficients ranged from B = 0.54 in Morocco to B = 4.85 in India, suggesting that power increased enforced tax compliance in all countries,
Table 5
Multilevel model for the dependent variable voluntary tax compliance.
Gender 0.25 0.03 0.27 0.03 0.28 0.03 Age 0.01 0.01 0.01 0.00 0.01 0.00 Trust 0.85 0.04 0.86 0.07 Power −0.26 0.04 −0.25 0.07 Interaction 0.48 0.06 0.48 0.07 Random effects σ2 σ2 σ2 Intercept 0.15 0.15 0.24 Trust 0.14 Power 0.12 Interaction 0.06 Residual 3.32 3.01 2.93 Variance explained Level 1 0.00 of 0.955 0.10 of 0.955 0.12 of 0.955 AIC 58,710 57,282 57,080
Note. N = 14,509. Trust and power were coded with 0 = low and 1 = high. The variable gender was coded with 0 = male and 1 = female. p < .05. p < .01. p < .001.
Model 1 Model 2 Model 3
Fixed effects B SE B SE B SE
1
Fig. 3. Regression coefficients of conditional effects of trust and power, and their interaction for voluntary tax compliance by country. Note. For
each subfigure, the black vertical line represents a null effect. The thin vertical line illustrates the overall fixed effect parameter, which is augmented by two red lines representing the limits of the 95% confidence interval of the fixed effect, further highlighted by red shading. Black dots indicate country-specific effects, with 95% confidence intervals. If a country-specific interval does not include the null effect line, the country-specific effect is significant. If a country-specific interval does not overlap with the red shaded area, the country-specific effect significantly deviates from the overall fixed effect. (For interpretation of the references to colour in this figure legend, the reader is referred to the web version of this article.)
Table 6
Multilevel model for the dependent variable enforced tax compliance.
Gender 0.16 0.04 0.15 0.03 0.15 0.03 Age −0.01 0.01 −0.02 0.01 −0.02 0.01 Trust 0.07 0.05 0.09 0.09 Power 2.63 0.05 2.65 0.16 Interaction −0.22 0.06 −0.25 0.13 Random effects σ2 σ2 σ2 Intercept 0.10 0.11 0.47 Trust 0.30 Power 1.02 Interaction 0.52 Residual 5.36 3.76 3.51 Variance explained Level 1 0.00 of 0.981 0.30 of 0.981 0.34 of 0.981 AIC 65,619 60,528 59,781
Note. N = 14,509. Trust and power were coded with 0 = low and 1 = high. The variable gender was coded with 0 = male and 1 = female. p < .05. p < .01. p < .001.
though to a differing extent. The random effect of trust was smaller, σ2 = 0.30, χ2(4) = 82.60, p < .001. The underlying pattern
shows that while the overall fixed effect of trust was not significant, there were six countries where trust positively influenced enforced compliance. The random effect of the interaction term, σ2 = 0.52, χ2(4) = 79.60, p < .001, was largely influenced by
results from the Indian sub-sample, where the interaction coefficient was B = −3.15 compared to a fixed effect of B = −0.25. After addressing this variation in terms of a random effect, the overall interaction effect of trust and power was no longer significant,
B = −0.25, p = .056.
Model 1 Model 2 Model 3
Fixed effects B SE B SE B SE
1
Fig. 4. Regression coefficients of conditional effects of trust and power, and their interaction for enforced tax compliance by country. Note. For each
subfigure, the black vertical line represents a null effect. The thin vertical line illustrates the overall fixed effect parameter, which is augmented by two red lines representing the limits of the 95% confidence interval of the fixed effect, further highlighted by red shading. Black dots indicate country-specific effects, with 95% confidence intervals. If a country-country-specific interval does not include the null effect line, the country-country-specific effect is significant. If a country-specific interval does not overlap with the red shaded area, the country-specific effect significantly deviates from the overall fixed effect. (For interpretation of the references to colour in this figure legend, the reader is referred to the web version of this article.)
Overall, power was the main determinant of enforced tax compliance in all countries. The final model explained 34% of total variance on level 1 and had the best model fit based on AIC.
3.2.4. Tax evasion
Tax evasion (Table 7) was significantly influenced by participants’ gender, B = −0.45, p < .001, as suggested by model 1. Specifically, men reported higher intentions of evading taxes.
In Model 2, the experimental manipulations were added. The results show significant negative effects of the trust dummy and the
Table 7
Multilevel model for the dependent variable tax evasion.
Gender −0.45 0.03 −0.46 0.03 −0.45 0.03 Age 0.00 0.01 0.00 0.01 0.00 0.01 Trust −0.56 0.05 −0.56 0.07 Power −0.27 0.05 −0.27 0.07 Interaction −0.15 0.06 −0.16 0.08 Random effects σ2 σ2 σ2 Intercept 0.26 0.26 0.33 Trust 0.15 Power 0.09 Interaction 0.09 Residual 3.95 3.82 3.77 Variance explained Level 1 0.01 of 0.938 0.05 of 0.938 0.06 of 0.938 AIC 61,264 60,778 60,708
Note. N = 14,509. Trust and power were coded with 0 = low and 1 = high. The variable gender was coded with 0 = male and 1 = female. p < .05. p < .01. p < .001.
Model 1 Model 2 Model 3
Fixed effects B SE B SE B SE
1
power dummy, further pronounced by a significant negative interaction term, B = −0.15, p < .001. The pattern indicates that high versus low trust decreased tax evasion intentions under conditions of low power, B = −0.56, p < . 001. The effect of trust was even slightly larger in the high power condition, B = −0.71, p < .001. High versus low power decreased tax evasion under conditions of low trust, B = −0.27, p < .001. Again, the effect of power was even larger under conditions of high trust, B = −0.42, p < .001. This pattern shows that, as hypothesized, both trust and power decreased tax evasion intentions. In the case of high trust combined with high power, evasion was even lower than the summation of the two single effects would predict.
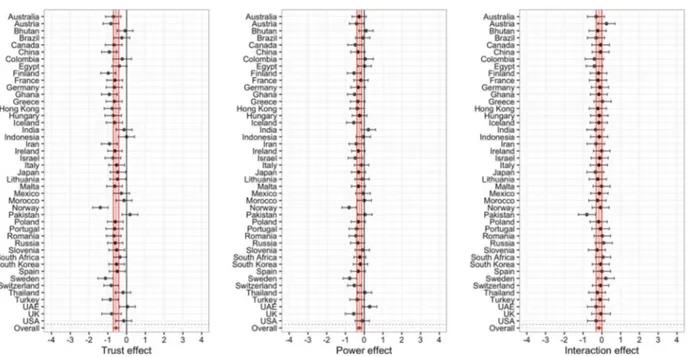
Concerning the random effects in model 3 (Fig. 5; also see Table S10), the analysis revealed a variation in the conditional trust effect of σ2 = 0.15, χ2(4) = 42.20, p < .001. Trust lowered tax evasion significantly in 32 countries, whereas there was no effect in
the remaining countries. The random effect of power was less pronounced, σ2 = 0.09, χ2(4) = 22.49, p < .001, and there was no
substantial variation in the interaction effect, σ2 = 0.09, χ2(4) = 5.67, p = .200.
The best model fit was observed for model 3 and total explained variance on the individual level was 6%. Comparing all de- pendent variables measuring tax compliance intentions, this final model analyzing tax evasion explained the least variance.
4. Discussion
By providing results for 44 nations from five continents, our study is the first large-scale investigation of the slippery slope framework. Our results provide support for its main assumptions in a vast range of countries. Both trust in authorities and power of authorities were identified as important determinants of tax compliance intentions around the world, irrespective of demographic coordinates, economic systems, social climates, political regimes, or cultural backgrounds.
The multilevel analyses confirmed the assumptions of the slippery slope framework about intended tax compliance. As postulated in Hypothesis 1, increasing trust led to higher intended tax compliance in all 44 countries. As postulated in Hypothesis 2, higher power had a positive effect on intended compliance in all but one country (i.e., Pakistan). However, these two effects are not fully complementary, as there was a (small) negative interaction effect. This is the exact opposite of what we postulated in Hypothesis 3 and is especially interesting in comparison to previous studies that found no significant interaction effect (e.g., Kogler et al., 2013, Wahl et al., 2010) or a positive one (e.g., Balliet & Van Lange, 2013). Given that the interaction of trust and power had the most pronounced negative effect on compliance intentions in countries with a generally rather high level of trust in authorities and well- organized tax administrations (i.e., Australia, Sweden, Switzerland; see, for instance, Kirchler, 2007), this finding can be interpreted as a sign that too strict enforcement under the form of high audit rates and severe fines may in fact result in reactance and resistance provoking noncompliance, and might be problematic within a system where high compliance is already established. Nevertheless, intended tax compliance was most pronounced when both trust and power were high, illustrating that the simple effects are not offset by the described substitution effect. This implies that revenue bodies should combine the predominantly applied deterrence approach
Fig. 5. Regression coefficients of conditional effects of trust and power, and their interaction for tax evasion by country. Note. For each subfigure,
the black vertical line represents a null effect. The thin vertical line illustrates the overall fixed effect parameter, which is augmented by two red lines representing the limits of the 95% confidence interval of the fixed effect, further highlighted by red shading. Black dots indicate country- specific effects, with 95% confidence intervals. If a country-specific interval does not include the null effect line, the country-specific effect is significant. If a country-specific interval does not overlap with the red shaded area, the country-specific effect significantly deviates from the overall fixed effect. (For interpretation of the references to colour in this figure legend, the reader is referred to the web version of this article.)
1
with services that increase trust in the authorities in order to increase general tax compliance.
As assumed in Hypothesis 1, voluntary tax compliance was dependent on trust in authorities. The effect was observable in all but two countries (i.e., Austria and Germany). While the overall effect of power was negative, the underlying country-pattern was rather mixed. In 13 countries power reduced voluntary compliance, whereas in the remaining 31 countries power showed no significant effect. If, however, high power was paired with high trust, the effect of both trust and power on voluntary compliance was positive in the majority of countries (41 out of 44) (see Fig. 3 and Table S8). Thus, authorities should consider increasing power together with trust if they aim to raise levels of voluntary compliance among taxpayers.
In line with our Hypothesis 2, high power increased enforced tax compliance. We observed the effect in all participating countries, although to clearly different extents. As a general result, trust had no significant influence on enforced tax compliance, apart from six countries where trust showed an effect. The overall results implied that, in the case of both high trust and high power, the feeling of being forced to pay taxes decreased in comparison with high power alone. In general, authorities can presume that increased de- terrence measures will impact upon taxpayers’ enforced compliance within the tax system. However, as we observed high variance in this effect, our results suggest that revenue bodies should carefully adjust deterrence measures so that they target prevalent problems in the respective country.
Regarding tax evasion, the assumptions of the slippery slope framework were confirmed. Supporting Hypotheses 1 and 2, high trust and power both reduced tax evasion. The significant negative interaction indicates that the level of tax evasion was reduced even further when high trust and high power were combined, in this case providing support for Hypothesis 3. However, the overall explained variance was relatively low in comparison with the other reported models. As stated before, the results imply that gov- ernments should aim at increasing both trust and power in order to increase tax compliance and reduce tax evasion.
The magnitude of effect variance was rather heterogenous between predictor variables and dependent variables. From the per- spective of predictors, the effect variance of the conditional effect of trust was quite stable (σ2 of 0.17, 0.14, 0.30, 0.15), whereas in
the case of power there was much more variation (σ2 of 0.51, 0.12, 1.02, 0.09). At the same time, effect variations were rather low for
voluntary compliance and tax evasion, but larger for general tax compliance intentions, and clearly substantial in the case of enforced tax compliance. In terms of the two interaction climates that are postulated in the slippery slope framework, these differences could suggest that the mechanisms underlying voluntary compliance are more universal cross-culturally than those influencing compliance motivations through enforcement.
We are aware that the study comprised student samples, which are not representative of the countries in question and might have rather little real-life experience with paying taxes. Nevertheless, the literature shows that student and non-student participants (e.g., self-employed taxpayers) tend to reason and act similarly, both in representative and non-representative samples (Alm, Bloomquist, & McKee, 2011; Exadaktylos, Espín, & Brañas-Garza, 2013; Plott, 1987; Wahl et al., 2010). As our study referred to hypothetical scenarios of a fictitious country – and not explicitly to participants’ home countries – it is more likely that the rather low between- country variance is also informative for more representative samples.
Recalling results of the manipulation check scores, the manipulations of trust and power were both successful. However, we also observed that power influenced trust perceptions and trust influenced power perceptions. Such crossover effects could signal that the two manipulations were not achieved completely independent from another and could cause interaction effects of trust and power on the dependent variables. However, since these crossover effects were quite small in comparison to the interaction effects of interest, we are confident that our interpretations of the interaction effects are not caused by a non-independence of the trust and power manipulations, but represent meaningful effects.
Our results provide clear suggestions to governments in terms of appropriate strategies to improve compliance, while adapting them to national circumstances. In nations where trust and power are perceived as weak, disregarding taxpayers’ demands and expectations concerning assistance, equity, and welfare will result in evasion. However, providing support and services for taxpayers (e.g., fiscal incentives to run businesses, media facilities to monitor policy accountability and transparency, resources to voice a say in major decisions), while fighting free riders in a goal-directed manner may enhance compliance. In countries already registering high trust and power levels, maintaining business-friendly regulatory environments, streamlining taxpaying systems, and enhancing public dialogue when developing fiscal reforms will serve to maintain and propagate high levels of tax compliance.
Taken together, our findings call for a shift in the conversation about taxation, replacing one-sided deterrence approaches with multifaceted strategies encompassing economically based as well as socio-psychologically driven determinants. The central im- plication of our study is that at the base of a nation’s endeavors to enhance tax compliance there are two pervasive dimensions: citizens’ trust in authorities and their perceptions of authorities’ power. Considering both dimensions is vital, because facilitating enhanced tax compliance within the economy reverberates across many other societal areas like education, health care, social welfare, and the judiciary. On a broader scale, our study is in line with recent developments in the international arena suggesting that authorities should answer attempts to breach tax laws with both trust and power-based strategies rather than relying solely on power strategies to positively influence taxpayers’ compliance behavior (Australian Taxation Office, 2000; Balliet & Van Lange, 2013; OECD, 2014).
Appendix A. Supplementary material