WORKING PAPER SERIES
CEEAplA WP No. 03/2012
Migration in CIS in the Context of European
Integration and Changing Socio-political
Borders
Ainura Uzagalieva
Xavier Chojnicki
Randall K. Filer
António Gomes de Menezes
January 2012
Migration in CIS in the Context of European Integration
and Changing Socio-political Borders
Ainura Uzagalieva
Universidade dos Açores (CEEAplA e CERGE-EI)
Xavier Chojnicki
University of Lille 2 and CEPII
Randall K. Filer
City University of New York (Department of Economics,
Hunter College and the Graduate Center)
António Gomes de Menezes
Universidade dos Açores (DEG e CEEAplA)
CEEAplA Working Paper n.º 03/2012
Janeiro de 2012
RESUMO/ABSTRACT
Migration in CIS in the Context of European Integration and Changing
Socio-political Borders
Labor migration from Eastern Europe and Commonwealth of Independent
States (CIS) to Western countries became an important socio-economic issue
due to the large number of migrants. Since political systems and the nature of
border management in these regions change, migration flows turned out to be a
very complex and unpredictable issue. The purpose of this study is to analyze
possible scenarios and demographic consequences of migration flows, paying
particular attention to region specific factors and migration policies implemented
in recent years. The paper attempts to bridge a gap in literature on this
important topic, linking traditional labor market factors with uncertainty issues
and policies implemented in migrant receiving countries within the CIS. Our
findings suggest that economic and migration situation in the destination CIS
members became a very important determinant of migration flows. In this
respect, we employ a gravity model on the sample of 12 CIS members and
estimate the potential size of migration flows under three migratory scenarios.
Based on these scenarios, we further evaluate the demographic consequences
of migration in the largest members, including Russian Federation, Ukraine and
Uzbekistan which differ largely in terms demographic as well as economic and
geographic conditions. The study reveals that further demographic ageing is
inevitable over the next decades even if these three countries are not similarly
affected. Indeed, the dependency ratio, or the ratio of retirees to the working
population, should double. We conclude that reasonable migratory flows -
economically motivated - will have no significant impact on these trends unless
if they become substantial.
Key words: migration flows; demography; population
JEL classification: J01, J11
Ainura Uzagalieva
Universidade dos Açores
Departamento de Economia e Gestão
Rua da Mãe de Deus, 58
Xavier Chojnicki
Université de Lille 2,
Faculté des Sciences Juridiques, Politiques & Sociales
1, Place Déliot - BP 629
59024 LILLE Cedex
France
Randall K. Filer
City University of New York
Department of Economics
Hunter College and the Graduate Center
695 Park Avenue, New York
NY 10065 USA
António Gomes de Menezes
Universidade dos Açores
Departamento de Economia e Gestão
Rua da Mãe de Deus, 58
Migration in CIS in the Context of European Integration and Changing
Socio-political Borders*
Ainura Uzagalievaa, Xavier Chojnickib, Randall K. Filerc, António Menezesd
Abstract
Labor migration from Eastern Europe and Commonwealth of Independent States (CIS) to Western countries became an important socio-economic issue due to the large number of migrants. Since political systems and the nature of border management in these regions change, migration flows turned out to be a very complex and unpredictable issue. The purpose of this study is to analyze possible scenarios and demographic consequences of migration flows, paying particular attention to region specific factors and migration policies implemented in recent years. The paper attempts to bridge a gap in literature on this important topic, linking traditional labor market factors with uncertainty issues and policies implemented in migrant receiving countries within the CIS. Our findings suggest that economic and migration situation in the destination CIS members became a very important determinant of migration flows. In this respect, we employ a gravity model on the sample of 12 CIS members and estimate the potential size of migration flows under three migratory scenarios. Based on these scenarios, we further evaluate the demographic consequences of migration in the largest members, including Russian Federation, Ukraine and Uzbekistan which differ largely in terms demographic as well as economic and geographic conditions. The study reveals that further demographic ageing is inevitable over the next decades even if these three countries are not similarly affected. Indeed, the dependency ratio, or the ratio of retirees to the working population, should double. We conclude that reasonable migratory flows - economically motivated - will have no significant impact on these trends unless if they become substantial.
Key words: migration flows; demography; population JEL classification: J01, J11
a CEEAplA, Centre of Applied Economics Studies of the Atlantic at the Department of Economics and Management, the University of the Azores, Rua da Mãe de Deus, 9501-801, Ponta Delgada, S. Miguel Azores, Portugal; CERGE-EI, Center for Economic Research and Graduate Education of Charles University and the Economics Institute of the Academy of Sciences of the Czech Republic; e-mail: [email protected], [email protected].
b CEPII, 9, rue Georges Pitard 75015 Paris, France; University of Lille 2, 42, rue Paul Duez, Lille, 59000, France; e-mail: [email protected].
c Department of Economics, Hunter College and the Graduate Center, City University of New York, 695 Park Avenue, New York, NY 10065; CERGE-EI, Charles University and the Academy of Sciences, Prague, Czech Republic, Politickych veznu 77, P.O. Box 882, 111 21 Prague, Czech Republic, , IZA, Bonn, CESifo, Munich, William Davidson Institute.. e-mail: [email protected]
d CEEAplA, Centre of Applied Economics Studies of the Atlantic at the Department of Economics and Management, the University of the Azores, Rua da Mãe de Deus, 9501-801, Ponta Delgada, S. Miguel Azores, Portugal.; e-mail: [email protected]
*) We are indebted to Vladimir Borgy from Banque de France for useful comments and suggestions enriching this research. While preparing this paper, Chojnicki and Uzagalieva benefited from the EU 6th framework project “EU Eastern
Neighbourhood: Economic Potential and Future Development (ENEPO)”. The first draft of this work was presented at the ENEPO workshop in Brussels on November 30, 2007. The opinions of the authors do not necessarily express the view of the institutions they are affiliated with. All usual disclaimers apply.
1. Introduction
The collapse of the iron curtain and breakup of the former Soviet Union set in motion vast migration flows. The implications of these flows for labor markets, housing markets and social disruption has created concern among policy-makers in both migrant sending and receiving countries. According to various estimates, migration from the Commonweath of Independent States (CIS) to the West may reach as many as 13.5 million individuals between 2000 to 2050 (Mansoor and Quillin 2007).
Most empirical studies based on traditional migration theories (see, for example, Barro and Sala-i-Martin 1991; Greenwood et al. 1991; Pissarides and McMaster 1990) focus on the relationship between net migration and various labor market and non-market variables. The most important labor market variables in these studies are wages and unemployment rates. Other factors studied include a wide range of variables such as geographic distance, satisfaction with the location of origin, attachment to local labor markets, institutional and legal conditions, family ties, customs and cultural differences between immigrants and natives (Enchautegui 1997; Fertig and Schmidt 2000; Konya 2007; Lazear 1999). As mentioned by Gallin (2004), the forward looking nature of migration, a crucially important factor, is ignored in many of these studies, leading very often to identification problems and biased estimation results. Other studies performed within the framework of neoclassical tradition, known as “the new economics of labor migration”, add market uncertainty and risks in evaluating family migration decisions (Chen et al. 2003; Stark 1991). With uncertainty, migration doesn’t flow automatically in response to expected wage differentials, but also depends on risks such as variance of income, and economic and political uncertainty as well as the correlation of these risks between source and destination countries.
Prior empirical studies of the determinants and future potential of migration flows between and within the CIS countries include Andrienko and Guriev (2004, 2005), Fertig (2001), Gerber (2006), Korobkov and Zaionchkovskaia (2004), Korobkov (2007), Memedovic et al. (1997), Patzwaldt (2004), and Weiss et al. (2003).
These studies have identified ethnicity, quality of life, population composition, and political and economic factors as important determinants of migration ( Cao and Nee 2000; Fassmann and Munz 1994). In particular, population composition and the quality of life are important determinants of migration within these countries (e.g. out-migration from the North and East part of Russia), while ethnic aspects are the main force for migration between successor countries of the former Soviet Union (fSU) with minority nationalities leaving newly formed states to relocate to their newly independent national homelands, including Russians returning to the Russian Republic. Most earlier work has downplayed the impact of traditional labor market factors on immigration flows within the CIS, especially given that wage arrears and extensive bartering meant that standard market signals did not function or were not captured in the data (e.g. Cao and Nee 2000). According to Gerber (2005), a relatively small fraction of migration (about 25%) within Russia was motivated by economic incentives in the 90s, while various non-economic factors such as educational opportunities, re-unification with family members, political reasons, climate and quality of life were stronger determinants of internal migration flows. Other studies, however, argued that the labor market variables considered in the neoclassical approach operated in post-Soviet countries exactly as theory predicts (Andrienko and Guriev 2004, 2005; Heleniak 2009). Lazareva (2007) stresses that immigration to Russia, for example, played an equilibrating role in Russian regional labor markets.
In the current study we extend the investigation of the determinants of migration flows within the CIS to take into account region-specific factors. We then develop possible scenarios for future migration flows for three regions: Russia and the European portion of the CIS, the Caucases, and Central Asia. We thus fill a lacuna in the literature, linking traditional labor market factors with uncertainty and specific policies implemented by the major receiving countries within the CIS.
2. Earlier Patterns of Migration within the CIS
As a vast region with few geographic barriers, especially east of the Ural mountains, the territory of the fSU has long been subject to waves of human movement including those of inhabitants of the Kievan Rus region towards Moscow in the twelfth century and of the Mongols into the Russian heartland in the thirteenth century. Modern migration flows in the CIS are heavily influenced by prior movements dating back to the 19th century when
Russian territorial borders sharply extended towards Caucasus and Central Asia. In this period, under Alexander II, the Russian Empire initiated substantial reforms in education, government, and the judiciary and military including a policy of agricultural colonization. Following the Crimean War of 1854, Russia gained control of the Caucasus region although it was forced to deal with subsequent revolts of Muslim tribes under the leadership of the Chechen rebel, Shamil.1 Following pacification of the Caucasus region, the empire expanded into Central
Asia. By 1868 Russian forces had occupied the territory of Turkestan. Later, in the 1870s, Russian troops incorporated the remaining Central Asian emirates into the empire and in 1881 the Turkmen lands on the Persian and Afghan border were occupied.
In the 20th century, the Russian territory expanded further. Between 1920 and 1945, the former Bukhara and
Khiva Emirates,2 Western Ukraine, Western Byelorussia, Bessarabia, Northern Bukovina, the Baltic States,
Tuva and Konigsberg [i.e. Kaliningrad]) were incorporated into the Soviet Union. Migration in these regions as well as other economic and geographic peripheries of the former Empire was intensified by urbanization and emphasized in Soviet planning between 1917 and 1941 for core republics such as Russia and the Ukraine. After World War II, urbanization spread to other regions including Belarus, Moldova, Central Asia and several eastern autonomous republics of Russia3. With the goal to urbanize and develop virgin lands with rich natural resources,
the authorities of the former SU intensively relocated citizens from the European regions towards East,
1This example demonstrates that some of the current ethnic conflicts in the CIS have very old roots.
2The Bukhara Emirate and the Khiva Khanat, which were located in Central Asia, were included to the former SU in 1920
as parts of present Uzbekistan, Tajikistan and Turkmenistan.
3Between the 1940s through the 1980s the fSU exhibited one of the fastest rate of urbanization in the world (Gang and
East and South. Pockney (1991) reports that many civilians were taken forcibly from their homelands and scattered to newly incorporated territories in the eastern and southern regions of the former SU.
These massive forced or induced population flows have largely been ignored in the economic literature since they were planned according to political priorities rather than responding to economic incentives. The studies that do exist (e.g. Lewis and Rowland 1979; Santalov and Segal 1927) are largely descriptive. The first wave of population movement took place between 1917 and 1938. Santalov and Segal (1927) report that about a quarter of population in the former Russian Empire left the country immediately after the revolution of 1917. During the following years, i.e. between 1921 and 1933, which are marked by severe famine, about 4-5.5 million emigrated (Pockney 1991). Emigration was almost impossible between 1937 and 1941, but there was an unprecedented migration within the country, primarily, from European territory towards the East and South caused by the collectivization policies of the early 1930s, and repressions largely victimizing intellectual elites during the late 1930s, followed by fleeing from advancing German forces during early World Way II.
After World War II, there was a second large wave of emigration during which 8-10 million people left the Soviet Union followed by a repressive period from the 1950s to the 1970s when emigration was almost impossible. A third wave of emigration started in 1988 when legislation allowing all citizens of the former SU to travel abroad by private invitation was passed. As a result of this law, emigration increased by 2.5 fold from 1987 to 1988, mainly consisting of individuals of various nationalities returning to their historical homelands or joining powerful foreign diasporas (Fassmann and Munz 1994). According to Fassmann and Munz, more than a third of these emigrants were ethnic Germans, whose emigration was supported by the Federal Republic of Germany. Table 1 (Appendix 1) demonstrates the consequences of this ethnic-based migration by showing the decline in the size of particular ethnic groups between 1959 to 2002.
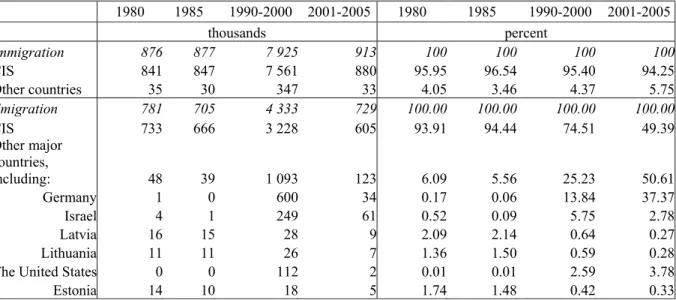
According to the Census of 2002, CIS migration showed distinct geographic patterns, with the main source countries to Western Europe being the European part of the CIS (84%). The total number of emigrants from
Russia to outside the CIS is estimated to have been approximately at 1.2 million between 1989 and 2002, of which 59% went to Germany, 25% to Israel, and 11% to the USA (Andrienko and Guriev 2005). During the same period, the number of ethnic Germans in the CIS overall decreased by about 50%, most due to emigration from Central Asia. Further evidence suggests that the largest part of CIS emigrants was from capitals and large cities. About 40% of emigrants from Russia previously resided in Moscow and St. Petersburg, emigrants from Ukraine were inhabitants of Kiev and Odessa, people from Belarus used to live previously in Minsk and the Gomel province, and those from Kazakhstan came from Alma-Ata and Karaganda province.
Ethnic factors also played an important role in internal migration flows in the CIS (Korobkov 2004; Korobkov and Zaionchkovskaja 2007). So far, two main trends of such migration flows have been observed. The first is the migration of ethnic groups to the states in which they form a titular nation, referred as “return migration.” The second trend is migration to Russia by the members of all nationalities that have been assimilated to Russian culture (e.g. Locher 2002). Table 2 (Appendix 1) demonstrates that the process of Russian emigration from the Caucasian republics began by the 1960s. In recent years, the pace of this process has been intensified by social and political developments following the collapse of the SU. With the transformation of the SU to the CIS, about 73 million people became members of “minority” ethnic groups in their country of residence. The largest fraction of these were ethnic Russian (26 million) living outside Russia. There has been a relatively recent phenomenon of an increase in the number of ethnic Russian refugees and accompanying groups (e.g. Russian speaking small ethnicities) due to ethnic and religious conflicts in the CIS4 resulting from controversies
over political power, ownership, and citizenship created by a revival of nationalism.
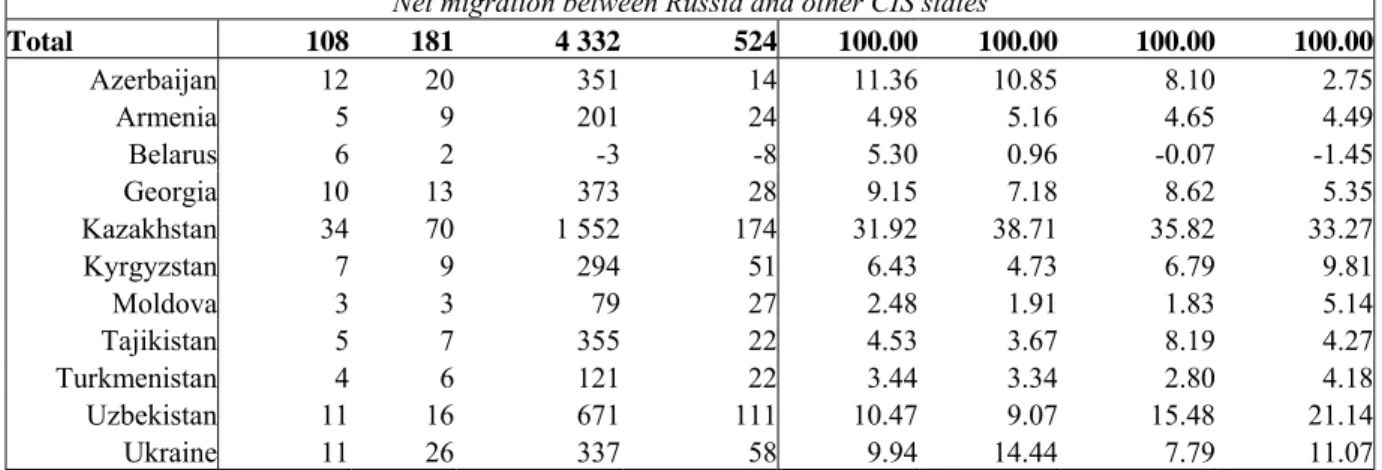
Table 3 (Appendix 1) demonstrates that the inflow of migrants to Russia from other CIS states was large, with net immigration roughly equal to 4.8 million between 1990 and 2005. About 35% of the total left Kazakhstan,
24% were from Uzbekistan, 16% from Tajikistan and Georgia and Azerbaijan, and 8% - from Ukraine. Table 4
4The example of these conflicts includes the Nagorno-Karabakh conflict in Azerbajan, conflicts between Kyrgyz and
Uzbeks in Osh region in Kyrgyzstan, between Uzbeks and Meskhetian Turks in the Fergana Valley of Uzbekistan, between Chechens and Ingushis in the Northern Caucasus, and the civil war in Moldova and Georgia.
(Appendix 1) further indicates that most emigration occurred during violent ethnic conflicts or from states where ethnic Russians are few in numbers (e.g. Georgia, Tajikistan and Uzbekistan) or dispersed over large areas (Kazakhstan), suggesting the role of the push factors of political instability and ethnic tensions in inducing migration flows. In many newly established states, domestic policies focused on reviving domestic culture and languages, disadvantaging previously dominant Russian minorities. Consequently, ethnic Russians and many other small ethnicities that had been assimilated to Russian culture and language often desired to emigrate.
a) The European part of the CIS
The European core of the CIS contains Belarus, Moldova, Russia and Ukraine, with a total population of about
203 million. Here Russia is the center of migration in the fSU, both receiving and sending a large fraction of
migrants. According to the State Committee of the Russian Federation on Statistics (SCRFS), about 4.8 million people emigrated from Russia during the period from 1990 to 2005 (SCRFS 2006). The majority left for other CIS states (78%), including Ukraine (33.9%), Kazakhstan (13.6%), Belarus (8.1%) and Uzbekistan (3.8%). Outside the CIS, Germany (16.1%) and Israel (5.5%) were the largest recipients of migrants from Russia. As for the number of immigrants during this period, the SCRFS reports that approximately 8.7 million entered Russia, mostly from Kazakhstan (27.2%), Ukraine (23.2%), Uzbekistan (11.1%), the Caucasus (14.3%), and other CIS countries (19.7%). One key concern for Russia is the large size of irregular immigration. According to the International Organization for Migration (IOM, 2005), for example, official estimates of irregular immigrants residing permanently in the Russian Federation in 2005 ranged from 3 to 5 million people. Moreover, about 12 to 15 million immigrants enter Russia every year for seasonal work, although the number of work permits obtained for foreigners by Russian employers annually is much fewer (300 thousand). Thus, the majority of foreigners are working illegally in Russia, mainly in shadow and informal parts of the economy (International Labor Organization [ILO] 2005, Andrienko and Guriev 2005).
Ukraine, with a population of about 47 million, was even more affected by emigration than Russia. Between from 1991 to 2004, about 4.5 million left, mostly for US, Canada, Argentina and Europe, while the number of immigrants coming permanently from other CIS states to the Ukraine is estimated to have been about 2 million (Cipko in Rios 2006). When combined with falling birth rates (the country has the highest rate of natural population decrease in the world [-0.8%]), net out-migration contributed to an actual decline in Ukraine’s population in recent years.
In response to the large number of Ukrainian emigrants, the government of Ukraine has recently signed a number of bilateral labor agreements with a purpose of simplifying employment procedures for Ukrainian workers and protecting their rights.5 In 2005, Italy granted legal status to about 100 thousand workers coming
from Ukraine (Rios 2006). The EU and Switzerland announced that visa regimes for Ukrainian workers will be eased. According to Cipko (in Rios 2006), relatively well educated Ukrainian citizens living in these and other European countries are mostly engaged in sectors with low-skill requirements such as agriculture (harvesting fruits and vegetables), construction, care taking (taking care of seniors, children and sick) and service (hotels, cafeterias, restaurants, nightclubs).
Turning to Moldova, widespread poverty (with about 64.7% of the population living below the official poverty line) and the lack of job opportunities has caused many to emigrate. According to Labor Force Migration (LFM) Survey conducted by the National Bureau of Statistics (NBS) of the Republic of Moldova, about 10% of population (or 320 thousand people) has left abroad (NBS, 2008).6 For Belarus, the number of emigrants is
estimated by government sources at about 1.2 million people (or 12.2% of population) since the beginning of the 1990s.
5The list of these countries includes Belarus, Armenia, Moldova, Russia, Latvia, Lithuania, Poland, Portugal, Spain and
b) The Caucasus Region
The Caucasian countries, with a total population of 16 million, experienced a difficult state-building processes, accompanied by natural and human disasters with devastating effects on their economies. Areas of conflict include Nagorno-Karabakh or Karabagh between Armenia and Azerbajan, the invasion of Georgia by Russia, attempts by various Georgian regions to secede and secessionist conflict within Russia itself in the Northern Caucasus. As a result, ethnic and socio-economic tensions are a major push factor in creating emigrants. Between 1988 and 2005, for example, between 0.9 million and 1 million people permanently left Armenia (Yeganyan in Rios 2006), while about 2 million and 1.9 million emigrated from Azerbaijan and Georgia, respectively. Contributing factors include social and economic conditions in the region, enhanced by diaspora networks abroad, especially the large, and prosperous Armenian diaspora worldwide. Azerbaijan largely exports labor to the CIS, with about 75 percent of Azeri emigrants living in Moscow and other major Russian cities (Aliyev in Rios 2006).
c) Central Asia
The counties in the Central Asian part of the CIS, with a total population of 58 million people, diverged after the break-up of the fSU. Due to dynamic economic development and relatively high wages,7 Kazakhstan became a
major destination for labor migrants in the region. Some are temporary labor migrates for seasonal work, with about one million illegal migrants coming every year from poorer neighboring countries, while others are illegal migrants who use Kazakhstan as a transit country before moving on to Russia and Europe. These “transit” migrants include workers not only from Central Asian, but also from Eastern Russia, China, Turkey and Afghanistan (Rios 2006). As reported in Rios (2006), irregular immigrants are estimated to compose 80% of all
6
The survey was conducted by NBS in the framework of the project “Elimination of human trafficking from Moldova and Ukraine through labour market based measures”, implemented by International Labour Organization jointly with the International Centre for Migration Policy Development and in partnership with the Ministry of Economy and Trade.
7 A minimal threshold of wages in Kazakhstan was 250 USD while the average salary in Kyrgyzstan and Uzbekistan was
immigrants in the country. The Kazakh government has set annual quotas for foreign specialists in each industrial sector in order to protect the national labor markets.8 Many ethnic Russians and Germans, on the other
hand, have left Kazakhstan, while over 300 thousand ethnic Kazakhs have returned since the beginning of the 1990s especially under special immigration quotas for ethnic Kazakhs (or “oralmans”) from Russia, Uzbekistan, Turkmenistan and Mongolia. These immigrants were supported by the state with both housing and jobs. Other countries in the region - Kyrgyzstan, Tajikistan, Turkmenistan and Uzbekistan - are primarily migrant-sending countries. Various social studies (e.g. IOM 2005, Rios 2006) indicate that migration outflow from these countries amounted to 2-3 million from 1995 to 2005. While most of these people went to Russia and Kazakhstan, some emigrated to Turkey, the UAE, Iran and Arab countries with which Central Asia established various social networks through shuttle trade at the beginning of the 1990s. Some countries in the region (e.g. Turkmenistan) became transit countries for Afghans going to Russia and then to the West.
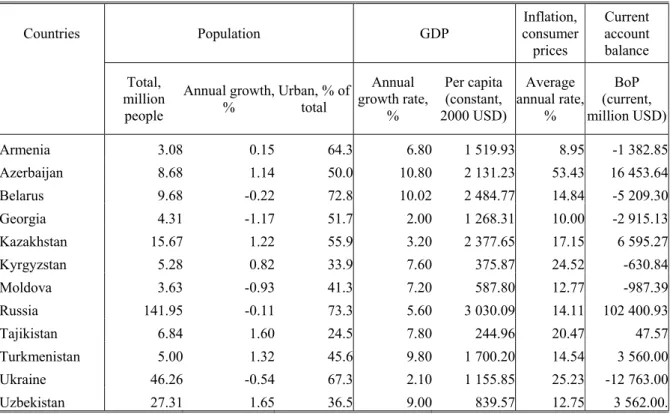
3. Region and Country-Specific Determinants of Migration
The discussion above suggests that socio-economic, ethnic and political factors have played important roles in migratory flows both from and within the CIS and suggests that these factors will also determine the direction, pattern and magnitude of future migration flows. In terms of economic and demographic factors, the CIS countries are characterized by large disparities. Table 4 (Appendix 1) contains selected economic and demographic indicators from the CIS countries in 2008. As can be seen in Table 4 (Appendix 1), the CIS countries differ greatly in terms of demographic factors. For example, the greatest annual population decrease is in Georgia (-1.17%), while in Uzbekistan, population increased by 1.65% a year. Generally, the European part of the CIS is characterized by a low ratio of children under 15 when compared to the Caucasus and Central Asia (Figure 1, Appendix 2). In terms of economic growth rates, Azerbaijan achieved the highest growth rate
8 In order to strengthen migration control over the temporary stay of foreigners in Kazakhstan, special migration cards were
introduced in 2003. The top sectors with the highest demand for foreign labor were the construction (58.4%), mining (15%) and agricultural (7.8%) sectors in 2005.
(10.80%) in 2008, while Georgia grew by only 2.0%. The wealthiest country in terms of GDP per capita is Russia (3030.09 USD) and the poorest one is Tajikistan (244.96 USD). As shown in Figure 2 (Appendix 2), GDP growth rates fluctuated in a wide range, between -44.9% and 34.5%, during the period from 1989 to 2008. Furthermore, although prior to 2004, the countries were converging in terms of GDP growth rates, after this date they largely diverged. One important reason for diverging trends in the GDP growth rates was political instability in a number of countries experienced revolutions between 2004 and 2005. For example, in the year following the rose revolution in Georgia, the growth rate of GDP declined by 6% compared to the previous year. In Ukraine it fell from 12.1% in 2004, the year when the country experienced the orange revolution, to 2.6% in 2005 and in Kyrgyzstan from 7.0% in 2004 to -0.2% in 2005 after the tulip revolution that took place in March 2005. Therefore, in terms of economic differentials, there is substantial impetus for increased migration flows.
Housing availability and job opportunities in potential destination countries are important, as shown e.g. in Brown (1997), Heleniak (1997) and Korel, Korel (1999). In particular, according to Brown (1997), both immigration and outmigration increased in Russia, in response to higher wages and higher rates of apartment privatization early in transition. In the survey of potential migrants conducted by Heleniak (1997), housing market imperfections and financial constraints are found to be the most important barriers to migration. A similar finding is reported in Korel and Korel (1999). At the same time, migrants’ ability to access information on various opportunities is also important (Layard et al. 1992). With respect to the absorptive capacity of potential destination countries (e.g. Russia and Kazakhstan), it seems that so far these countries are neither economically nor socially and psychologically prepared for receiving a large number of migrants from neighboring countries. Andrienko and Guriev ( 2004) claim that city restrictions, the lack of a real housing market and other policies undertaken by the policy-makers in Russia to curb the massive flow to major cities and regional centers are major obstacles in resettling immigrants. Therefore, many migrants, who left their former places of residence outside Russia lack stable accommodation in Russia. Such migrants may, therefore, start to look for onward destinations in third countries. Since Russia is one of the largest destination as well as
origin countries in the world, in terms of migration flows (Mansoor and Quillin 2007), the demographic and migration situation in Russia deserves special attention.
The demographic situation in Russia is characterized by an imbalance in the geographic distribution of migration flows and an unequal distribution of population in terms of age structure across regions (Andrienko and Guriev 2005). Namely, the large migration of young adults from rural areas to the central and southern parts of the country intensified in the 1990s and has resulted in the depopulation of economically and geopolitically important regions like Siberia and the Far East. Moreover, according to the forecasts of Russian ethno-demographers, the population of the country will decline by a further 10 million people between 2006 and 2025 (Voronina in Rios 2006). This will be translated to a stronger decline in working age population by more than
1% per year.
The migration policies prior 2005 in Russia, which are documented in detail in Voronina (in Rios 2006), can be summarized in the following few stages. The reforms initiated during the first stage (1991-1994) included enforcing the migration laws and establishing the main institutions governing the development and implementation of migration laws. At this stage, various funding programs were launched to support immigrants to Russia. Later, between 1995 and 1999, the importance of regulations was recognized and reflected in measures adopted at the presidential level. After 1999, key institutions responsible for migration policies plunged into multiple and ineffective reorganizations, which eventually caused the departure of qualified personnel and policy deterioration.9 Therefore, during the period from 1999 to 2002, institutions did not manage to resettle migrants. As a result, many immigrants who came to the big cities of Russia faced problems with housing, employment, and other aspects of resettlement. With a sharp increase in the various categories of migrants, especially irregular ones coming from the CIS as well as other regions (e.g. South-East Asia, Africa and the Middle East) to the big cities, the situation in the social sphere became difficult, leading in many cases
9 For example, the main agency responsible for managing the migration policy issues, named Federal Migration Service,
was terminated with the transfer of its functions to the Ministry of Federative Affairs, National and Migration Policy. Later, this ministry was also closed and the migration policy issues were largely ignored, as reported in Rios 2006.
to racial intolerance and ethnicity-based conflicts among the population. In response, Russian authorities introduced various restrictions on migrants between 2002 and 2004 (Voronina in Rios 2006).
Reforms in migration policies that started in 2005-2007 are aimed at reducing irregular immigration. These policies include actions focused on simplifying cumbersome procedures in migration policies (Schenk 2007). New rules have been imposed requiring the registration of foreign residents visiting or living temporarily in Russia, restricting the number of work permits10 extended to foreign workers and introducing various penalties
for illegal workers. Overall, Russian policy aims to decrease the number of work immigrants with non-Russian ethnicities, while encouraging Russian ethnicities currently living abroad to repatriate.11 The policy attempts,
therefore, to fill the growing labor gap with ethnic Russians as opposed to labor migrants. Return programs are implemented on a regional basis, depending on regional economic needs, which vary between industry and agriculture.12 At the initial stage of the program, which runs until 2012, about 700 thousand Russian compatriots
will be settled in twelve regions.13 Each returnee is promised first a temporary, and then a permanent residence
permit and with further assistance in finding a job. Housing and medical services will be provided on an interim basis.
President/ Prime Minister Putin has identified the demographic downturn and the loss of manpower as a main challenge facing Russia, and the demographic crisis and immigration were important issues in the elections of 2007. Russia has since developed immigration programmes, with an emphasis to bring people to the depopulating areas in Siberia and in the North, and a preference for ethnic Russians and former Russian citizens.
10According to Itar-Tass, the maximum number of work permits extended to immigrants from visa-free CIS states is 6 mln. 11 See e,g. the Concept of a Demographic Policy of the Russian Federation till 2025 adopted in October, 2007.
12 See. e.g. the decree “On the measures to aiding voluntary return of compatriots living abroad to the Russian Federation”
signed by the President of Russia in 2006 for stimulating the voluntary resettlement of Russian compatriots in the Russian Federation.
13These regions include: Krasnoyarsk, Primorsky Kray, Khabarovsk, Amur, Irkutsk, Kaliningrad, Kaluga, Lipetsk,
It is to be expected that these programmes will not be attractive since there is a strong trend among the existing population to move away from these places, towards prospering cities like Moscow and St. Petersburg and the climatically attractive Southern part of the country. Only tiny minorities among the emigrants to Germany and Israel are inclined to return to Russia. A local study in Berlin found that only one percent wished to do so (Haupt/ Wockenfuß 2007). However, there will be a need for follow-up programmes, to fill the essential positions in the Russian energy and resources industries and to develop the country‟ s infrastructure.
4. Possible Scenarios for Future Migration Flows
In this section we focus on the extent of potential migration in the CIS. Empirical studies focused on the future migration flows from the CIS to the EU and Russia are based only on economic and demographic factors (e.g. Mansoor and Quillin 2007). According to these authors, the net immigration flows to the EU and Russia have been estimated at 13.5 million and at 5.4 million, respectively, for the period from 2000 to 2050. The direction, pattern and size of migration flows from and within the CIS are determined by many aspects of migrants’ life, apart from demographic and economic differences including ethnic background, political situations and migration policies. Below, we incorporate these factors into projections of possible scenarios for future migration flows in the CIS. Since ethnicity based migration has been one of the main features of migration flows during the last decades in the CIS, the scenarios of future migration flows are determined for two population groups separately. The first group includes nationalities that have ethnic ties with other countries or large diasporas abroad. The second group includes the representatives of those ethnic minorities which appeared after the establishment of independent CIS members.
a) Potential Emigration for Ethnic Reasons
The potential migrants in the first population group exceeded 8 million in the population census of 1989 in the entire former SU. The most numerous among them were ethnic Germans (2 million), Jews (1.5 million), and
Poles (1.1 million). Other nationalities included Greeks, Koreans, Persians, Turks with the total number of about
3.4 million. In the 1990s, most ethnic Germans, Jews and Poles emigrated abroad so that the total number of
these groups decreased in the CIS by about 3.5 million. Presumably, other ethnicities were leaving as well. Thus, assuming that at least half of these ethnicities left the CIS, one can expect that the maximum potential of 8 million declined to about 2.9 million. This suggests that emigration for ethnic reasons will eventually decrease, but not disappear completely (Fassmann and Munz 1994). Most likely, according to Fassmann and Munz (1994), it will be sustained by the second group, i.e. new ethnic minorities or potential return migrants appeared with the establishment of the CIS states. This group includes about 46 million people of various nationalities and
26 million ethnic Russian in the CIS. Therefore, all CIS countries might face an increased potential for
migration flows. Namely, national and religious minorities dissatisfied with the domestic policies as well as their positions in the CIS states most likely will move. Migration of large ethnic groups, particularly Russians, who prefer to leave the CIS states with the new national majorities could also be large.
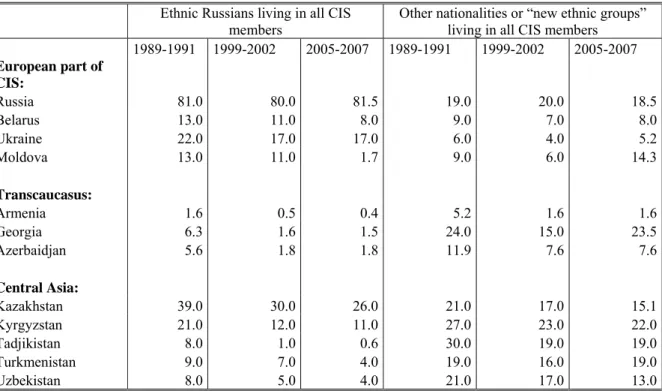
Table 1. Ethnic groups with Russian and other nationalities in the former SU republics, % in total population
Ethnic Russians living in all CIS members
Other nationalities or “new ethnic groups” living in all CIS members
1989-1991 1999-2002 2005-2007 1989-1991 1999-2002 2005-2007 European part of CIS: Russia 81.0 80.0 81.5 19.0 20.0 18.5 Belarus 13.0 11.0 8.0 9.0 7.0 8.0 Ukraine 22.0 17.0 17.0 6.0 4.0 5.2 Moldova 13.0 11.0 1.7 9.0 6.0 14.3 Transcaucasus: Armenia 1.6 0.5 0.4 5.2 1.6 1.6 Georgia 6.3 1.6 1.5 24.0 15.0 23.5 Azerbaidjan 5.6 1.8 1.8 11.9 7.6 7.6 Central Asia: Kazakhstan 39.0 30.0 26.0 21.0 17.0 15.1 Kyrgyzstan 21.0 12.0 11.0 27.0 23.0 22.0 Tadjikistan 8.0 1.0 0.6 30.0 19.0 19.0 Turkmenistan 9.0 7.0 4.0 19.0 16.0 19.0 Uzbekistan 8.0 5.0 4.0 21.0 17.0 13.0
The first group of potential emigrants will most likely move no matter what the socio-economic and political situation in the CIS becomes, if they are attracted by foreign countries. In other words, various shocks in the CIS members can be ignored in determining the future scenarios of emigration for this group. Layard et al. (1992) proposes three scenarios for migration flows under the absence of shocks. According to the first scenario, potential emigrants would move quickly once emigration becomes possible so that the rate of emigration flow is high initially, but later converges to a steady level. Under the second scenario, information channels available to potential emigrants matter because they need time for searching various opportunities related to housing, jobs, etc. in destination countries. Consequently, not many emigrate at the beginning. With the development of information channels, however, more people would be willing to move. The third scenario combines the first and second ones. Under this scenario, emigration increases steadily over time until it eventually tails off. According to Layard et al. (1992) the third case should be the most realistic one.
Visual inspection of actual emigration flows from Russia during the period from 1985 to 2005 suggests that the data approximate closely Layard’s first scenario (Figure 3, Appendix 2). The largest spike of emigration took place between 1985 and 1990, when major controls on migration were removed and travel abroad by private invitation was allowed. In this respect one can expect that the future emigration flow of the first population group will, most likely, follow the first scenario. Therefore, relative changes in the number of emigrants moving abroad from Russia between 1985 and 2005 were used for tracing the potential emigration flow from the CIS during the same period. Then based on the assumption that the formation of the expected emigration flows will follow a geometric series of the past values,14 the potential emigration is estimate to be about 1 million between
2006 and 2025. The actual and forecasted values are presented in Figure 4 (Appendix 2).
14When forming their expectations, potential emigrants give the most recent past the largest weight and that weight declines
b) Determinants of Return Migration
With respect to the second group (i.e., return migrants within the CIS), one can assume that migration potential will largely depend on the socio-economic and political situation in the CIS, as well as domestic migration policies. In particular, the situation in Russia and Kazakhstan, which are the major receivers of migrants among the CIS members, will be important. If these countries can sustain a high rate of economic growth and implement effective reforms in their migration policies, then a large number of potential migrants can be absorbed by their labor markets. If conditions for accepting a considerable number of return migrants remain unfavorable, however, then most migrants will naturally consider alternative options beyond the CIS. In order to estimate the size of potential migration to Russia, a standard gravity model with the following specification is used:
(1) ln(Mijt)=α1+α2ln (Yjt/Yit) + α3ln(Kij)+ α4 ln(Ujt/Uit)+ α5ln(Sit)+ α6D1+ α7D2+eit.
The dependent variable M in equation (1) denotes the gross migration flow from county i to country j at time t. The terms Y, K, U and S denote GDP per capita, distance (in kilometers) between the capital cities of the countries, unemployment rates, and the stock of previous migrants, respectively. All these variables are expressed in logarithms. The first term proxies wage differentials between the countries (Yjt/Yit). Large wage differentials between the pair of countries expect to result in large migration flows, that is, the hypothesis to be tested is α2>0. Costs that may affect migration decision (e.g. transportation and information costs) are captured by the physical distance variable (Kij). Distance is expected to have a negative effect on migration flows (α3<0). Differences in unemployment rate between the pair of countries are captured by (Ujt/Uit),with the hypothesis
α4>0. As has already been mentioned, one of the main priorities in the migration policy of migrant receiving
countries (e.g Kazakhstan and Russia) is to fill the growing labor gap by attracting Kazakh and Russian ethnicities, as opposed to labor migrants with non-Kazakh or non-Russian ethnicities. In this respect, we control the forward looking nature of migration to Russia by the size of population with Russian ethnicities outside
Russia, which is (Sit). The size of this population group is expected to have a positive effect on migration flows
(α5>0).
In addition to above-mentioned variables, we incorporate into our model dummy variables as proxies for the decision of migrants whether and when to move. For example, a variable with high variability across countries is likely to affect more the decision of migrants where to migrate, while a variable with high variability across time (within countries) is likely to affect more the decision of migrants whether or when to migrate. Therefore, the term D1 in our model represents a dummy variable that proxies uncertainty measure, indicating whether general economic and political situation in the CIS countries was stable during the period from 1995 to 2005. Since any sort of destabilization including political instability, which can vary from one country to another, causes GDP to fall, the standard deviation (SD) of GDP growth rates that is calculated across all the CIS countries at every t is used as a proxy for the uncertainty measure. Thus, the uncertainty dummy variable is defined as D1=1 if standard deviation of GDP growth rates across the member states exceeds the median level
(SD>SDmedian) and D1=0 if otherwise. Using this variable can account for differences in migration flows from
less stable to more stable countries. Uncertainty proxy is expected to have a positive and significant effect on migration flows (the hypothesis to be tested is α6>0). The second dummy variable, D2, is a policy restriction dummy equal to 1 if policies towards migration were restrictive in Russia and 0 otherwise. As discussed in Section 3, during the period from 2002 to 2004, Russian authorities imposed various restrictions towards immigrants in, for example, granting citizenship, residence and work permits. Therefore, the policy restriction dummy is defined as D2=1 for the years of 2002, 2003 and 2004, and D2=0 for the rest of the years included in the sample. Policy restrictions in destination countries expect to have a negative and significant effect on migration flows (the hypothesis test is α7<0).
Indexes i and j denote origin and destination countries such that I=1,..,11, J=115 and t stands for years such that
T=1,...,10. The parameters to be estimated by this model are α1,..., α7 with eit as an error term (the summary of hypothesis to be tested is: α2>0, α3<0, α4>0, α5>0, α6>0, and α7<0). The sample data covers the number of immigrants coming to Russia from the CIS states, constant GDP per capita in USD, the distance values in kilometers, unemployment rates and the stock of immigrants in Russia. The sources of the data for GDP and unemployment are the World Bank’s World Development Indicators and the International Monetary Fund’s World Economic Outlook databases. The data for migration flows come from the Russian Statistical Yearbook for 1995-2006. The distance values between the pairs of capital cities of countries are calculated using a software tool available on the website http://.indo.com/distance. Capital cities are used because they are assumed to be the main destination of migrants
The equation specified in expression (1) is estimated using Ordinary Lest Squares on a pooled data set for 1995-2005. The results of the estimations on the pooled data covering 99 observations are presented in Table 5 (Appendix 1). The basic model variables including GDP, population, unemployment and distance have the expected signs. An increase in the ratio of GDP per capita and the stock of migrants in receiving countries increases the migration flow between countries, while an increase in the distance between the countries decreases migration flows. Unemployment levels are not significant statistically, a finding that is in line with earlier results reporting no statistical relationship between migration and the level of unemployment (Memedovic et al. 1997). As for the impact of uncertainty, the sign is positive and highly significant suggesting that, under general uncertainty in the CIS, immigration to Russia increases by about 54% (the exponent of the coefficient on the dummy variable [0.43] is 1.54). On the contrary, restrictions towards immigration in Russia consistently decrease the inflow of immigrants by about 1.79-fold. The equation under this specification explains about 64% of the variation in the migration flows from other CIS countries to Russia.
c) Possible Future Migration Scenarios
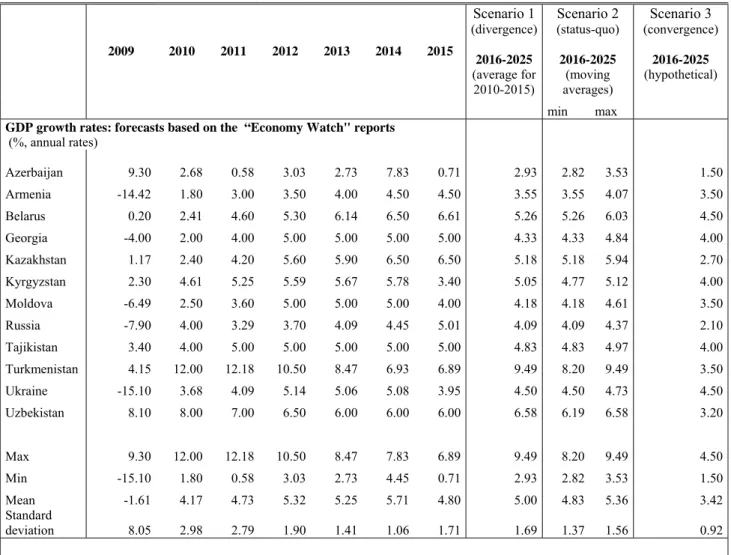
The assessment of the immigration potential to Russia from the CIS countries requires a number of assumptions to be made in order to reflect future differences in economic and political climate, policies and reform progress. Our assumptions about future differences in GDP per capita between countries are based on GDP forecasts that come from the reports of “Economy Watch”, available at http://www.economywatch.com, (Table 6)16 and population forecasts made by ILO17. Based on these projections and possible development of migration policies
in Russia, three scenarios are suggested below for the horizon from 2006 to 2025 (Table 7).
Scenario 1: Migration Pressure Persists Over Time
Since 1999 the president of Russia has repeatedly asserted that Russia needs to enter the group of strong, economically advanced and influential states of the world within the next 15 years and, therefore, regain the regional position of a great power. In 2005, the president of Kazakhstan also set a goal for the country to develop into one of the 50 most highly industrialized economies in the world. The optimistic scenario assumes that by 2025 the major receivers of migrants in the CIS (e.g. Russia and Kazakhstan) will catch up with the 50 most highly industrialized countries in the world. Furthermore, differences in the economic growth rates and incomes differentials among the CIS countries are assumed to increase, with the peripheral countries assumed to achieve a level of GDP per capita somewhat less than the average level of lower-middle income countries. This scenario, consequently, assumes a divergence in per capita incomes among the CIS countries, so that migration pressure will persist over time. This is captured by the standard deviation of GDP per capita across the countries considered.
16See “Econ Stats: Economic Indicators for Countries, 1980-2015” (Economy Watch) http://www.economywatch.com.
For assessing the migration potential under this scenario, GDP in all countries is assumed to grow at the rates provided in Table 6, that is: from 2010 to 2015 at the projected rates available at “Economy Watch”; from 2016 to 2025, at a constant 5-year average calculated for the period from 2010 to 2015. Therefore, in Russia, the annual GDP growth rates fluctuate within the range of 3.3%-5.0%, which would result in GDP per capita equivalent to 5623 USD in 2025, well above the average level of middle income countries (5339 USD).18 In
Kazakhstan, the GDP growth rate is assumed to grow within the range of 2.4%-6.5%, which would result in GDP per capita of about 5363 USD in 2025. The GDP growth rates in the rest of the countries are set within the range of 2.9% (Azerbaijan ) to 9.5% (Turkmenistan). Unemployment rates are assumed to stabilize at the level of 7% in 2010 and remain constant thereafter.19 The lowest GDP per capita in 2025, under these scenario, is
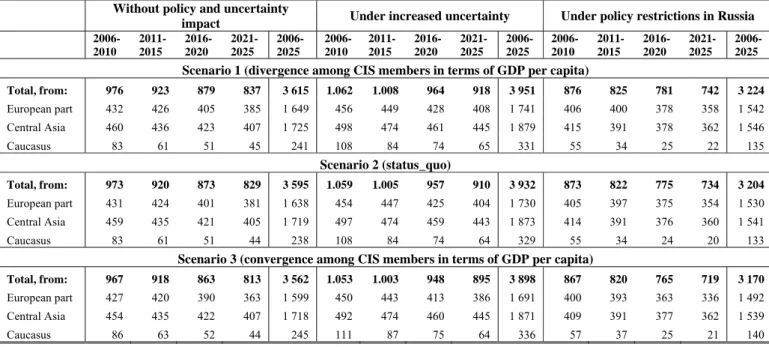
found for Tajikistan with about 445 USD, while its highest level is for Belarus with about 6889 USD. Correspondingly, the standard deviation (SD) of GDP per capita across the 12 countries is the largest under this scenario (2265 SD), which is in line with our “income diverging” assumption. The predicted migration from other CIS countries to Russia for the period from 2006 to 2025 is about 3615.74 thousand. Policy changes in Russia towards immigration would reduce the estimated potential to 3223.60 thousand, which means that roughly 391.14 thousand would look for alternative destinations, most likely, outside the CIS. Under the assumption of increased economic and political uncertainty in the CIS, the estimated migration to Russia would increase to 3951.40 thousand (Table 7).
Scenario 2: Status-quo Scenario
As an alternative, we assume that the political and economic situation in the CIS remains constant in terms of socio-economic and political development. GDP growth rates are assumed to grow from 2015 and onwards at their 5-year moving averages, calculated for the previous 5 years. This yields an assumed growth rate in Russia
18 The values of GDP per capita are expressed in constant USD (2000 prices).
19The unemployment forecasts are drawn from “Employment and Fiscal Policy Implications of Ageing in Eastern and
Southeastern Europe, Caucasus and Central Asia”, Background note by the UNECE secretariat. The International Labor Organization (http://laborsta.ilo.org).
within the range of 3.3%-4.4% , in Kazakhstan within the range of 2.4%-6.5%, and between 0.6% (Azerbaijan) and 8.5% (Turkmenistan) in the other countries. The highest GDP per capita projected for 2025 in Belarus (6188 USD) is 13 times larger than that of in Tajikistan (448 USD). The standard deviation of GDP per capita across 12 countries under this scenario is lower than in the previous scenario (1934 SD). Unemployment rates are assumed to stay constant at 2006 levels. The estimated migration potential under these assumptions is 3595.04 thousand. Under increased uncertainty, the potential migration flows increase to a total of 3931.70 thousand up through 2025, while restrictive policies towards migration reduce it to 3204.89 thousand (Table 7).
Scenario 3: Pessimistic Scenario
Under a pessimistic scenario, no catching up to the advanced economies takes place in Kazakhstan and Russia, which lack the advantages of competitive markets and service-oriented industrial structure found in the 50 most developed countries. Under this scenario, international oil prices and the real exchange rate would continue to play major roles in the Russian, Kazakh, Azeri and Turkmen economies. Due to high dependence on the basic exportable commodities, fluctuations in growth in these countries would be wide and they would be characterized by Dutch decease that would depress non-resource investment and growth, a problem intensified by their inherent political shortcomings. This scenario, therefore, implies convergence in per capita incomes among the CIS countries with its maximum in Belarus (4262 USD) and minimum in Tajikistan (371 USD). GDP growth rates fluctuate within the range of 1.5%-4.6% during 2010-2025 in this scenario. The standard deviation of GDP per capita is 1208 SD. Potential migration under this scenario is projected to be roughly
3561.64 thousand, decreasing to 3170.50 thousand under migration restrictions and increasing to 3898,30
thousand if there is increased uncertainty in the CIS (Table 7).
Potential destination countries in the CIS will almost certainly remain open for the return of their titular nationalities due to political considerations. Consequently, if the region remains volatile, which seems likely in light of recent political developments, somewhere between roughly 3898.30 thousand (with economic
convergence) and 3951.40 thousand (rapid core-country growth) people would immigrate to Russia between 2006 and 2025.
c) Emigration Potential from the CIS to Europe
The discussion above suggests that the most favorite destinations for residents of the fSU (current CIS) to relocate outside the region are Europe and US. With the enlargement of EU, Europe should be broadly defined to include Central Europe. According to official sources, about 400-450 thousand migrants from other CIS countries, mostly from its European part, worked legally and illegally in Central Europe, especially, in the Czech Republic and Poland in 2005.20 In this respect, the European Neighborhood Policy (ENP) implemented
with the enlargement of EU stresses the problem of illegal migration. In particular, the ENP emphasizes the importance of legitimate travel “for business, educational, tourism and official purposes” once the proper preconditions in the neighboring countries are met as well as increased cooperation with other countries in fighting against illegal migration.21 The core elements of the ENP would include, consequently, educational and
youth exchanges, mobility of researchers, civil society exchanges, business-to business contacts, etc.
The ENP action plans suggest that the level of skills and education will be major determinants of legal migration from the CIS to Europe, at least in intermediate term. Consequently, one can expect that migrants with higher skills and better education in the CIS would be most likely to legally emigrate, especially from the European part of the CIS where the concentration of scientific centers is higher than in other regions. In this respect, the potential migration outflows from the CIS obtained from basic gravity estimates should be adjusted by the size of population with tertiary education.
The assessment of potential emigration flows from CIS is based on long-run coefficients obtained from estimations reported in Fertig (2001). The underlying intuition behind this is that in the long-run, migration will be driven by economic factors. The approach used by Fertig (2001) allows determination of the driving forces of the past immigration flows to Europe using a well-established model22 that distinguishes between short-term and
long-term factors influencing migration flows. Using pooled data covering 17 countries for the period from 1960 to 1994, long-run coefficients for major determinants were used to forecast the immigration potential from Eastern Europe to Germany. The explanatory variables, long-run coefficients and t-values obtained in Fertig (2001) are presented in Table 8 (Appendix 1). Fertig (2001) used three sets of assumptions to predict the future migration flows for the period from 1994 to 2015 based on these coefficients. Under the first two assumptions, referred as “medium convergence scenario with and without free movement,” annual per-capita income in Germany grows at a constant rate of 2%, leading to a decrease in the income gap between Germany and EE at a rate of 2% per annum. The unemployment rate in Germany is set at 8.6%. Under the “no convergence with free movement” assumption, the rate of per capita income in Germany is set at 2%, while unemployment rate is 5%.
The potential for emigration from the CIS to Germany based on these coefficients and three set of assumptions is calculated for the period 2006 to 2025. Income differentials between Germany and the CIS members, taken as a ratio of GDP per capita, are assumed to fall in all scenarios, as demonstrated in Figure 6 (Appendix 2). Under the first scenario, in which GDP in all CIS countries is assumed to grow at a 5-year average (2010-2015), income gap between the CIS and Germany falls at its highest rate, from 1.68 in 2006 to 0.91 in 2025. The estimated emigration potential abroad is the lowest in this scenario, with about 1609.3 thousand people. Under the second scenario, in which the political and economic situation in the CIS remains constant in terms of socio-economic and political development, the income gap is slightly larger reduces to about 0.97 with the approximate GDP per capita of about 36.8 thousand in the CIS and 35.7 thousand in Germany. The predicted migration potential slightly decreases to 1609.2 thousand (by 60 thousand), under this assumption. The third 21“Communication from the commission to the council and the European Parliament: On strengthening the European
scenario, which implies convergence in per capita incomes among the CIS countries, gives roughly 1635.6 thousand of emigrants. In this case the income gap between the CIS and Germany is assumed to fall at a slower rate, from 1.7 in 2006 to 1.3 in 2025. These predicted numbers were used to obtain the approximate emigration potential of CIS to Western Europe using the average weighted size of past emigration flows (Table 9, Appendix 1).
Migration flows from the CIS to Western and Central Europe will include several components. The first is migration for ethnic reasons, consisting primarily of national and religious groups with roughly 1 million projected to move West during 2006 to 2025. Second, migration of large ethnic groups, particularly, Russians, who prefer to leave the CIS states with new official languages and national majorities either for Russia or the West, depending on situation in Russia and other CIS countries. Third, potential emigration to Germany and elsewhere for purely economic reasons, which is projected to range from 1 609.3 thousand and 1635.6 thousand people, depending on realized growth rates.
5. Demographic Consequences of Migration in CIS countries
Numerous CIS countries are ageing rapidly, as presented in Figure 1 (Appendix 2) and are already experiencing declining populations. Migration has the potential to modify the age structure of the population, either positively or negatively. To evaluate the consequences of migration from a demographic perspective, we present the projected population composition under on different migratory scenarios for three major CIS countries: Russia, Ukraine and Uzbekistan. These countries have been chosen based on their size and the relative importance of migratory flows to illustrate how reasonable migration patterns could modify population size and structure.
22The model is formulated in the framework of individual utility maximization and explicitly accounts for uncertainty in the
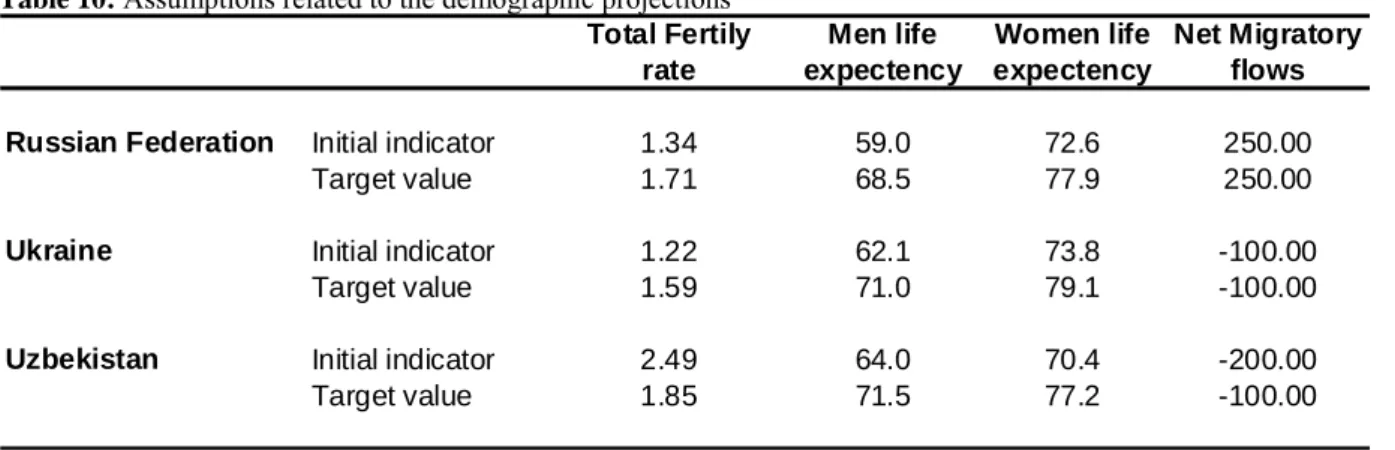
In order to analyze the demographic consequences of migration flows we update population cohorts by sex and by age with three components of demographic change: fertility, mortality and net migration. The starting point is the population structure by age and sex in 2005. Then, by applying survival probabilities according to age and sex, we estimate the surviving population for the following year. At the same time, the female fertility rate is applied to calculate the number of births expected during the year. Finally, net projected migration by sex and by age is added to the number of survivors at the end of the year. Initial values are taken from United-Nations data and presented in Table 10 (Appendix 1). In 2005, the total fertility rate is equal to 1.34 for Russia, 1.22 for Ukraine, and 2.49 for Uzbekistan. Life expectancy is respectively of 59.0 and 72.6 for men and women in Russia, 62.1 and 73.8 in Ukraine and 64.0 and 70.4 in Uzbekistan.
The values retained for the projection (target values in Table 10) are also those of the United-Nations. Total fertility in all countries is assumed to converge eventually towards the level of 1.85 children per woman, except for countries where the total fertility rate was far below 1.85 children per woman in 2000-2005 (Russia and Ukraine). Mortality is projected on the basis of models capturing projected changes in life expectancy produced by the United Nations Population Division under which gains are inversely related to current life expectancy.
We then add projected net migration flows as developed in Section 4 for each of the three analyzed countries. These flows include emigration for ethnic reasons that will likely take place under all socio-economic and political conditions; new ethnic minorities which appeared after the establishment of independent CIS states whose migration potential to Russia will depend more on the socio-economic and political situation in the CIS, as well as the immigration policy of Russia; and, finally, potential migration from the CIS to Western Europe, driven by economic factors. We only consider migration flows to Russia and Western Europe (Table 11, Appendix 1). These constitute by far the largest portion of total emigration. By comparison, Table 10 also presents the net migration flows contained in the recent population projections of the United-Nations (United Nations, 2006). The age distribution of migration flows for each country is based on the one used in
Nations standard demographic projections (Figure 7 in Appendix 2). As observed at the beginning of period, most of migrants (emigrants in the case of Ukraine and Uzbekistan; immigrants in the case of Russia) are young workers. Then, we assume that the age distribution of net migration flows is constant over time whatever the migratory scenario.
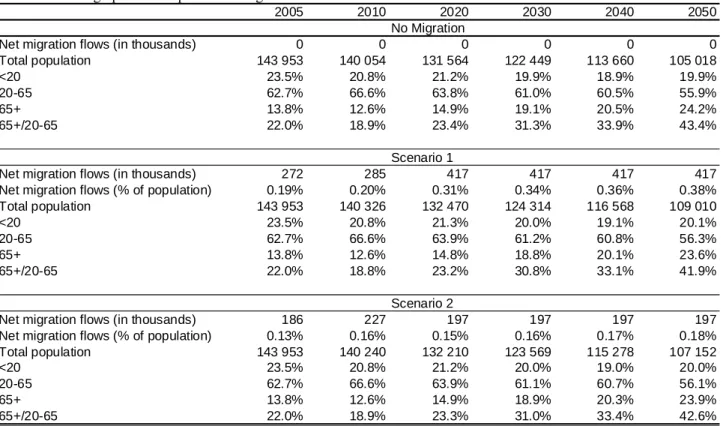
We present demographic projections under three migratory flow assumptions:
1. A “no migration” scenario (benchmark), which exactly corresponds to the United-Nation’s “zero migration” variant;
2. A “high migration” scenario which uses the status quo assumptions regarding convergence but an assumption of increase uncertainty; and
3. A “low migration” scenario which uses the status quo assumptions regarding convergence without policy and uncertainty impacts.
Projections results are given in Tables 12 to 14 (in Appendix 1) for each of the three countries. The first part of each table gives the “No migration” scenario results. Russia and Ukraine are clearly more affected by ageing than Uzbekistan. For example, their total population as well as working-age population decreases while Uzbekistan sees its population increasing during the next half century. Note that the Russian and Ukrainian situations, in term of ageing, is largely explained by their low fertility rates (far bellow the generation replacement level of 2.1 children per woman).
One common measure of ageing is the old age dependency ratio (i.e. the ratio of people aged 65+ to people aged
20-64). Again, the situation is totally different across our three countries. In Russia and Ukraine the old age
dependency ratio more than doubles over the forecast period, reaching, respectively, 43.4% and 48.6% by 2050. This aging will raise numerous problems for pension schemes since the burden of the retirees will grow spectacularly during the next decades. On the contrary, this ratio in Uzbekistan is clearly lower, reaching a level in 2050 that prevails in Russia today.
Increasing the size of the working age population through international migration (or limiting the departure of young people to foreign countries) could be a solution in the short and medium term to reduce declines in the potential dependency ratio. The second two panes in Tables 12 to 14 present the demographic consequences of migration flows in the context of two reasonable scenarios. Only Russia is characterized by inflows and these have a minor impact on dependency ratios.
In the case of the Russian Federation, the contribution of net positive flows is relatively weak from a demographic perspective. Indeed, the total population is only by 3.8% higher (2% for the second scenario) in 2050. The size of the working age population is also slightly higher, but the old age dependency ratio is only reduced by 1.5 point in the more optimistic scenario (0.8 point in the other one) at the end of the projection period. In fact, the important migration flows that are introduced (varying between 187 thousand. and 417 thousand. migrants per year, according to the year and scenario considered) represent only a small fraction of the total population (less than 0.4%) thus explaining the small demographic effect. Thus, only the implementation of an active migration policy that increased substantially migration flows in next decades could mitigate projected population decreases in Russia.
The two other countries are characterized by net migration outflows. In the case of Ukraine, which will be strongly affected by demographic ageing, migration outflows reinforce the consequences of ageing though the departure of young people to Russia and Western Europe. Given that forecasted flows are relatively small, however, (less than 0.4% of the total population), these will not destabilize the age pyramid in any catastrophic way.
As previously seen, Uzbekistan is in a totally different situation from the other countries since its total population (as well as its working age population) will continue to increase during the next half century without migration. Net migratory outflows are lower than in Ukraine will have limited demographic consequences.
To conclude, further demographic ageing is inevitable over the next decades, although the rate differs across the three countries. In general, the dependency ratio, or the ratio of retirees to the working population, should double. The study also shows that migratory flows will not have a significant impact on these trends unless there are massive unanticipated increases.
6. Conclusion
This paper reviews migratory flows from and within the CIS, focusing on large migration flows, region specific issues, and policies implemented by the major receiving countries. Based on this, possible migration scenarios for the period 2006-2025 are proposed for two different groups of potential migrants. The first group includes ethnicities that have close ties with countries or large diaspora abroad. The second group includes new ethnic minorities which appeared with the collapse of the former SU and establishment of independent CIS states. Assuming that the first group of potential migrants would leave the CIS no matter what its socio-economic and political development, the number of potential emigrates is estimated at about 1 million. For the second group of return migrants in the CIS, on the contrary, the socio-economic and political situation in the major receiving countries (i.e. Russia and Kazakhstan) will presumably play an important role. In this respect, a modified gravity model is used for obtaining the estimated flows.
Three scenarios are proposed: (1) An optimistic case, which assumes that Russia and Kazakhstan catch up with highly industrialized countries in the world, under which out-migration pressure still persists over time with an estimated size of 3 615 thousand people, declining to 3224 thousand under policy restrictions in Russia and increasing to 3951 thousand with general economic and political instability in the CIS. (2) A status-quo scenario, with estimated migration of potential about 3 595 thousand, 3 204 thousand and 3 932thousand, correspondingly. (3) A pessimistic scenario, which assumes no catching-up process, under which the potential