3
THEMATIC ARTICLES
–
CHALLENGES OF MIGRATION:
WHO MIGRATES, WHY AND WITH WHAT EFFECTS?
Socio-Economic Determinants of International Migration
1Yaroslav PRYTULA, Nataliia POHORILA2
Abstract. Since economic factors cannot fully explain the determinants of bilateral migration, this study explores the social and cultural determinants that influence an i di idual s de isio to ig ate. Values, norms and interests in a given culture, may dete i e hethe a i di idual s i te tio to o e t a slates i to a tual ig atio . Wo k values inherent in different cultures could explain why people move or do not move under the condition of perceived economic advantages of migration. A gravity type migration model is used to incorporate variables related both to economic indicators and work values. It is perhaps the first migration study to use the World Value Survey (WVS) and the European Value Survey (EVS). We use 2000 stock bilateral migration dataset collected by the World Bank. Our findings indicate that if more aspects of work are valued in a country, this country sends more migrants. Also we show that countries with higher extrinsic work value orientation tend to send more migrants, while countries with higher intrinsic work value orientation tend to send fewer migrants. Our finding shows that the value of work and the level of job security in a country may significantly change migration decision. Keywords: migration, gravity model, work related values
1. Introduction
The traditional approach to explaining aggregate migration flows between two countries is based on Hicks hypothesis formulated in 1932, which stated that
1 The work on this article was supported by an individual grant № R08-0721 from the
Economics Education and Research Consortium, Inc. (EERC), with funds provided by the Global Development Network
2 The authors would like to thank Tom Coupe, Yuriy Taran, Michael Alexeev, Shlomo
4
diffe e es i et e o o i ad a tages, hiefl diffe e es i ages, a e the ai causes of migratio Hi ks, . Late o ks of Sjaastad , Ha is a d Todaro (1970) and Borjas (1987, 1989) consider the migration decision as an i est e t i hu a apital. If the esou e e-allo atio p odu es positi e return, then an individual decides to migrate. A simple model presents net migration as a function of the difference between the discounted present value of e pe ted eal i o es i the sou e a d desti atio ou t o e ig a ts planning horizon minus some measure of individual characteristics of migrants and the costs of migration.
As mentioned in Bauer and Zimmermann (1999) such a neoclassical model based only on difference in expected incomes often fails to explain observed migration flows. Indeed, Ratha and Shaw (2007) found that about 38 percent of identified South-South3 migrants came from countries with higher incomes than thei host ou t ; o eo e , the esti ate that o e tha t o-thirds of South-South migrants from low-income countries are in other low-i o e ou t ies.
A number of studies use different measures of the cost of migration in order to increase the explanatory power of the migration model. The first of these was the model developed by Hatton (1995) to explain U.K. emigration. Based on the social network concept, he represented the average costs of migration as a function of the current stock of migrants from sending country in destination country and found positive albeit not statistically significant dependence of both gross and net migration on migrant stock. Fertig (2001) repeated the estimation in the cross-sectional study of determinants of immigration flows to Germany and found a significant negative relation between net migration flow and migrant stock. Mansoor and Quillin (2007) use a similar approach to explain migration flows from CIS and ECA countries to six destination countries adding the European Bank of Reconstruction and Development (EBRD) transition index as another socio-economic variable to better represent average costs of migration. While receiving mixed results on estimating their model for six destination countries, they conclude that economic variables - wage and employment differentials - were statistically significant only about half the time and they produced the opposite of the expected results in a number of cases. At the same time, the EBRD transition index, as an indicator of quality of life in home countries, showed more consistent results, i.e. significantly negatively correlating with migration rate in most of
3
5 cases/specifications. These authors concluded that it is important to include various social, cultural and political indicators as explanatory variables (Mansoor and Quillin, 2007, p. 78).
A post- ate ialist shift i alue s ste s theo I gleha t, describes how values shifted from the accent on material gain to the values places primarily on leisure, self-expression and life satisfaction in the post-industrial period. If the primary motif for the former period was family subsistence, the current trends may be determined by living and working standards, decent working conditions, self-actualization, rights protection, and life satisfaction.
In their recent work Blanchflower and Shadforth (2009) used life satisfa tio s o es f o Eu o a o ete a d fou d that the p ope sit to migrate is e e o e highl o elated ith life satisfa tio tha it is ith GDP pe apita. On the other hand, Lewer et al. (2009) constructed two non-economic quality of life indices and did not find significant relation between these indices and immigration to 16 OECD destination countries from 1991 to 2000.
In our opinion, the role of value orientations for migration decision is understated in contemporary research and the international value studies have not been yet explored as a resource for migration studies. We focused our attention on work values, which are attitudes and beliefs that could be conducive for migration decisions. We elaborate and empirically test several hypotheses on how particular work values may propel or hinder outmigration.
The paper is organized as follows. Section 2 describes our theoretical model and hypotheses. Section 3 presents data and univariate analysis. Section 4 describes our empirical model and estimation strategy. Section 5 presents our regression based empirical findings and section 6 discusses main findings and limitations of the analysis.
2. Hypotheses
6
heterogeneous labor force: some types of workers are more skilled (i.e. productive) than others and this information is private that induces a separating equilibrium, so that only skilled workers will seek urban employment. Suppose workers differ not only because of skills composition but also because of different work4 values. It has been shown (Kalleberg, 1977) that the failure of workers to achieve their intrinsic values in respect to the content of the task is a cause of dissatisfaction with their job. Also, it might be argued then that a worker with satisfied work values will become more productive in comparison to a worker with unsatisfied values (Kazanas, 1978; Buckingham and Coffman, 1999). Hence, the satisfaction of a worker with stronger work values increases his/her productivity in comparison to a worker with weaker work values. Adding this p opositio to Be i e ga a d S ith s odel e o lude that o l skilled and/or job value demanding workers would seek urban employment provided their job values would be satisfied there. In other words, higher worker productivity caused either by higher skills or stronger work ethics can only be realized through migration to a highly productive economy, which is capable of satisfying growing work demands. Hence, if work is valued and it is scarce in a society, then society will send more migrants to other countries.
Here we consider two approaches to measure work values in a society. One approach considers work importance as such, and is measured by a espo de t a s e to the uestio How is work important in your life? usi g
the s ale very important , rather important , not very important , not at all important . Usi g this otio of o k alues e ill test the follo i g
hypothesis
Hypothesis 1. Ifwork is highly valued in a society, and demand for work is not satisfied, then this society sends more labour migrants.
The second approach of measuring value of work is calculating the number of choices made by a respondent from the list of different aspects of work values that are important to him/her. The surveyed population is asked to select the most valuable work characteristics like job pay, content of job tasks, carrier opportunities, and job security and so on from a list of eleven options. The sum of the selected values is interpreted as the level of work aspirations: a larger number of aspects chosen indicates higher work aspirations. This could
4Here and further we use interchangeable the notions of ‘job values’ and ‘work values’ since
7 be especially relevant for migration decision if aspirations have grown recently. For example, in post-communist countries where until recently people did not have the opportunity to choose their working conditions, work values did not exhibit much variation. As the market opened and as variation in working conditions grew, values of work become more and more diversified.5 The new open market system introduced workers to part-time employment, self-employment, contractual work, work at small businesses, and work at transnational corporations. We can make an assumption that in such countries the expectations toward various aspects of job grew, and if the domestic labour market fails to satisfy these demands, people will be willing to migrate. This proposition is expressed in the next hypothesis
Hypothesis 2. The number of emigrants that a given society sends is positively and directly related to the number of work aspects that workers in that society value.
Sociological literature that considers two different groups of work values: intrinsic and extrinsic. Herzberg (1957) distinguished between the oti ato s, o i t i si fa to s, a d the h gie i fa to s, o e t i si factors of work. The former have been interpreted as esteem and self-actualization, the latter as social factor and security. Later this concept has found its repercussion
ith A.Maslo s highe a d lo e a ked asi eeds.
The question is, how work values, intrinsic or extrinsic, help to predict migration rates. It is well known that work values, or meaning that people assign to their work, are interpreted as an intermediate variable that mediates the effect of income rewards on job satisfaction (Morse and Weiss 1953, Goldthorpe and Lockwood 1968). Values inculcated in early childhood and those acquired in mature age were recognized to be chief determinants of job satisfaction (Kalleberg 1977). We can infer, therefore, that independent of satisfaction with income rewards, if some other aspects of job as its content or job security are valued, then values could be determinants which drive or circumscribe migration.
Following Herzberg we define intrinsic values as those related to the content of the job task, the role of work and personal self-fulfillment at work. E t i si o k alues a e those elated to e te al o h gie i o k
5 For example in Poland the average number of valued work aspects surveyed by EVS rose
8
conditions: job pay, physical conditions in the work place, working hours, job security, and so on. Intrinsic values are associated with post-materialist values a d highe le el of eeds i Maslo s te i olog . I gleha t s studies sho ed that populations of the countries with post-materialist values are happier. Also, it has also been shown that people whose goals are intrinsic tend to be happier than those with extrinsic goals (Kasser and Ryan 2001, Gruenberg 1980). It is explained that children who are socialized in a better educated strata tend to strive for intrinsic values, while children socialized in less educated strata, tend to strive for extrinsic values (Kohn and Schooler 1983). We may suggest that those with intrinsic values are more satisfied with their jobs, and will be more reluctant to leave their country. Alternatively, those with high extrinsic va lues could be dissatisfied and we may expect them to want to migrate.6 Moreover, extrinsic values could be conducive to migration because they were found to be prevalent in periods of social instability. According to the studies in Soviet and post-Soviet Russia (Ardichvili, 2009) extrinsic demands toward job were highest in the period of social calamities in the 1990-s in Russia: high job insecurity, wage areas, undefined prospects. In other words, extrinsic values always play the role of migration motivator, however, the development of intrinsic values withhold migration. Hence, we have:
Hypothesis 3. In nations where strong intrinsic work values are prevalent, the rate of out-migration is lower.
Hypothesis 4. In nations where strong extrinsic work values are prevalent, out-migration is higher.
We use the gravity model framework to test the above stated hypotheses. Hypotheses 1 and 2 directly or indirectly assume that people will migrate given no opportunity for job satisfaction, while hypotheses 3 and 4 are formulated independent of job satisfaction. In order to test this conditional dependence, we augment the standard gravity model with the interaction of work value and job satisfaction variables. In the simplest version such model can be written as:
ij ij ij
ij ij
ij X Work_value Job_satisfaction Work_value Job_satisfaction ) e
M 1 2 1(
where
M
ij is a migration from country i to countryj
, X is a vector that
6 Based on the sample of 32 countries for which WVS has questions about job satisfaction,
9 includes standard variables, to be discussed below, frequently included in
gravity models of international migration. The effect of Work _value on
migration conditional on Job _satisfaction is given by the sum of the coefficient on value of work variable and the coefficient on the interaction term multiplied
by job satisfaction variable: (ˆ1ˆ1Job _satisfactionij). Equating the last expression to zero one can derive a condition on job satisfaction variable to have a positive or negative effect of work value variable on migration depending on the hypothesis. Putting mean value of the job satisfaction variable in the expression gives the average effect of the work value variable on migration.
3. Data
Data on our dependent variable - bilateral stock migration - comes from the World Bank Migration and Remittances project. This is the first attempt we are aware of to use the World Bank dataset on bilateral migration stock to investigate the economic and non-economic determinants of international migration. This dataset contains bilateral stock migration data collected from national censuses that took place around 2000. As mentioned in Ratha and Shaw (2007) the World Bank dataset on bilateral migration stock is the most comprehensive one presently available. At the same time due to its wide coverage and absence of standardized definitions and common reporting standards of migrants, the dataset may lack accuracy.
The sample in this study is limited to 62x62 country pairs for which comparable work value related data are available. This sample accounts for more then half of world migration stock in the year 2000 and represents countries with different socio-economic background. The chi-square test of representativeness of our sample in relation to GDP per capita in constant 2000 US dollars for the selected countries in comparison with the world distribution indicates that our sample is representative.
10
since 1981.7 The fourth wave of the WVS and the EVS—which was conducted in 1999-2000—contains data for the largest sample of countries available among these surveys – 62 countries. In this study we use 11 work value related questions for the analysis. Each question reflects the a e age opi io of a ou t s population about the importance of a specific aspect of work. Such aspects include (1) good pay, (2) not too much pressure, (3) job security, (4) respectability of a job, (5) good hours, (6) opportunity to use initiative, (7) generous holidays, (8) responsible job, (9) a job in which you feel you can achieve something, (10) a jo that is i te esti g, a d a jo that eets o e s a ilities. Additio all e studied responses to the question if work is important aspect of espo de t s life. The indices of intrinsic and extrinsic work values are calculated based on the first 11 questions, originally formulated in the EVS study and qualified as e t i si uestio s , , , a d o i t i si uestio s , (7), (8), (9), (10) and (11)] by the authors who worked with the EVS data (Halman and Vloet 1994, Savicka 1999). We use two alternative measures to calculate these indices: additive indices (average number of valued aspects of work) and factor scores extracted with the help of principal component analysis. In application to work values, principal component analysis has been used by Savicka (1999) and in combination with latent class analysis it had been used earlier by Halman and Vloet (1994). Their analyses revealed high correlation among the corresponding work value variables, consistent in time and within different European countries.
We measure job security by the Economic Security Index (ESI), which is calculated by the International Labour Office (ILO)8 on the basis of different forms of security associated with work such as employment protection, skills protection, income protection, and etc. The ESI index is a weighted average of 25 indicators of three types that reflect institutional arrangements, organizational process and the actual effective provision of job security. For each country, the ESI index was calculated in 1999 and normalized ranging between 0 and 1 where the higher value indicates better job security. Coverage of the ESI index is limited to 52 countries, as such our estimations where we use ESI are based on limited sample.
We used the World Development Indicators (WDI) dataset to obtain the necessary macroeconomic variables. Some gaps in the year 2000 unemployment
7 available at: www.worldvaluessurvey.org 8
11 data were filled from United Nations data. Data on wages are combined from the UNECE dataset and EBRD transition report. Geographical and cultural information (distance between capitals, land border, common language and colonial ties o es f o Ce t e D Etudes P ospe ti es et D I fo atio s I te atio ales (CEPII).
We also use two indices of cultural differences between countries that account for the societal value of traditional authority versus secular-rational authority and survival values as opposed to self-expression values. I gleha t s (1990) concept of traditional authority societies as opposed to secular-rational authority culture (TSR) reflects the contrast between societies in which deference to the authority of a God or the nation (traditional authority) is viewed as important and those societies in which the subordination to state power, or rationalized bureaucracy (rational authority) is stressed. On the other hand, Survival values as opposed to Self-Expression values (SSE) dimension of culture reflects differences between societies that emphasize hard work and self-denial (Survival values) and those that stress quality of life issues, such as self-e p self-essio , lself-eisu self-e, f iself-e dship, o self-e s self-e a ipatio a d self-e ual status fo a ial and sexual minorities (Self-Expression values).
The TSR and SSE scores are calculated using the factor analysis on the WVS and EVS questions relating to economics, politics, religion, sexual behavior, gender roles, family values, communal identities, civic engagement, scientific and technological progress, environmental protection, and ethical concerns. Here we use TSR and SSE scores estimated by Tadesse and White (2008) and define TSR and SSE cultural distance between countries as an absolute value of the difference in the corresponding scores.9
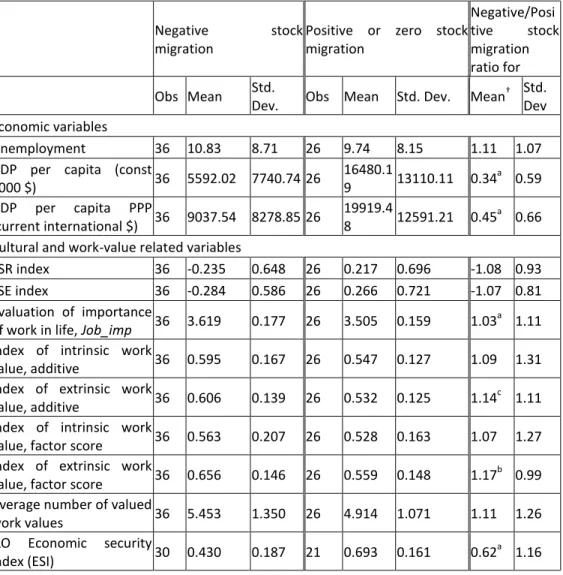
Table 1 contains results of the univariate analysis of economic and work value related variables for two groups of countries of our sample - those with positive and negative stock migration in the year 2000. Our sample contains 36 countries with negative and 26 countries with positive or zero 2000 stock migration. Column eight shows the ratio of means and indicates the significance
9
Tadesse and White (2008) also proposed to define cultural distance between countries as a composite index of differences in mean values of the TSR and SSE scores as
2
2 ( )
)
( i j i j
ij TSR TSR SSE SSE
CD . In this study we do not find CD to be
12
level of t-test of equality of means for these two groups. As one may expect the direction of migration on average goes from poor countries to rich countries. In the same vane, unemployment rate on average is higher in sending countries although not significantly.
Table 1. Difference in economic and social variables between countries with negative and positive stock migration in 2000.
Negative stock
migration
Positive or zero stock migration
Negative/Posi tive stock migration ratio for Obs Mean Std.
Dev. Obs Mean Std. Dev. Mean
† Std.
Dev Economic variables
Unemployment 36 10.83 8.71 26 9.74 8.15 1.11 1.07 GDP per capita (const
2000 $) 36 5592.02 7740.74 26
16480.1
9 13110.11 0.34
a
0.59 GDP per capita PPP
(current international $) 36 9037.54 8278.85 26
19919.4
8 12591.21 0.45
a
0.66 Cultural and work-value related variables
TSR index 36 -0.235 0.648 26 0.217 0.696 -1.08 0.93 SSE index 36 -0.284 0.586 26 0.266 0.721 -1.07 0.81 Evaluation of importance
of work in life, Job_imp 36 3.619 0.177 26 3.505 0.159 1.03
a
1.11 Index of intrinsic work
value, additive 36 0.595 0.167 26 0.547 0.127 1.09 1.31 Index of extrinsic work
value, additive 36 0.606 0.139 26 0.532 0.125 1.14
c
1.11 Index of intrinsic work
value, factor score 36 0.563 0.207 26 0.528 0.163 1.07 1.27 Index of extrinsic work
value, factor score 36 0.656 0.146 26 0.559 0.148 1.17
b
0.99 Average number of valued
work values 36 5.453 1.350 26 4.914 1.071 1.11 1.26 ILO Economic security
index (ESI) 30 0.430 0.187 21 0.693 0.161 0.62
a
1.16
Sour e: World Ba k igratio data ase, WDI, WVS, EVS, ILO, authors’ al ulatio † (a)/(b)/(c) indicate 1% /
13 Many of the value-related variables do not show significant difference between two country groups. At the same time, those with significant differences in means behave supportively to our hypotheses. Importance of work and index of extrinsic work value are higher in source countries. The ILO economic security index shows that job protection is significantly lower in source countries.
Insignificant differences in work value variables between the positive and negative stock migration countries can be explained by inner differentiation among values in the countries under study. As Gruenberg (1980) showed, i t i si alues a e to e fou d a o g high o upatio s athe tha lo ualified jo s, e a e pe t that i the ou t ies ith high i e ualit fo opportunities for advancement, the differentiation of values is high, and this differentiation would yield nearly equal averages of both types of values.
4. Empirical Model and Estimation Strategy
We utilize the gravity framework to study migration. The gravity model has become a standard workhorse in cross-sectional studies of bilateral migration flows10. The most general specification of the gravity model of migration is given by:
ij j i j i
ij X Z u
M
( )
( ) where Mij represents some measure of migration from country i to country j, Xi(j) is a set of (log) economic variables of country i and j, and Zi(j) is a set of other explanatory variables for countries i and j, that are specific to a particular study and may include geographical, cultural, social and institutional factors.
The standard economic determinants of international migration used in empirical migration literature11 include the average wage or GDP per capita as a measure of (potential) income in home and host country and the rate of unemployment (employment) as a measure of probability of obtaining that income.
We will follow this approach using GDP per capita in constant 2000 US dollars as a measure of potential income. We will use distance between countries
10 See, for example, the work of Karemera et al. (2000) to study determinants of international
migration to USA and Canada, the work of Lueth and Ruiz-Arranz (2006) to study the determinants of remittance flows, and the works of Mayda (2005) and Ortega and Peri (2009) to study determinants of international migration to fourteen OECD countries.
11
14
and a dummy for common border as a control variable for the cost of migration. Cultural distance variables, common language and colony dummies will be used to control for possible barriers for migration.12
This study is unique in that it uses variables representing relative work values and job-security to explain the directions of international migration. Table 2 reports the estimation results of several different variations of the following basic specification: t i ij j i ij j i ij j i j i j i j i j i ij ij ij ij ij ij j i j i i ij u X Extrinsic Extrinsic X Intrinsic Intrinsic X imp Job imp Job ESI ESI Extrinsic Extrinsic Intrinsic Intrinsic imp Job imp Job Colony Lang SSE TSR Border Dist unempl unempl ta GDPperCapi ta GDPperCapi Pop M , 3 2 1 4 3 2 1 8 7 6 5 4 3 2 1 * log * log * _ _ log log log log _ _ log ) log( ) log( ) log( log log ) log(
where i is the origin country and
j
is the destination country,Mijis thestock of migrants from i to
j
in the year 2000. If not mentioned otherwise,ta
GDPperCapi variable is GDP per capita in constant 2000 US dollars and
Unempl is unemployment in 200013.
Dist
is the distance between capitals of two countries.TSR
andSSE
are cultural distances between countries defined in theData section. The dummy variable
Border
has a value of one if the two countriesshare a land border. Lang and Colonydummies are equal to one, respectively, if a common language is spoken in both locations, and if two countries, at some point in the past, had a colonial relationship. Job_imp - the respondents were asked to
12
Studies of Mayda (2005) and Ortega and Peri (2009) used immigration policies dummy to control for migration barriers.
13 Hatton (1995) and Fertig (2001) suggest to separate unemployment variables for origin
15 evaluate the importance in their life using the 4-point scale: 1 – no important at all,
4- very important. ESI is a measure of job security in a country.
Extrinsic
andIntrinsic
are indices of extrinsic and intrinsic work values.Our hypotheses imply that the decision to migrate might involve some complex interaction between economic and social work related variables. To capture this complexity we include several types of interaction in our empirical model. Namely, we interact the i po ta e of o k a ia le, i t i si i di es, and extrinsic indices with income, unemployment and job security variables to find certain conditions under which people are discouraged or encouraged to migrate. This procedure reflects our hypotheses that people with different work values
might differ in their migration decision under similar economic conditions.
X
ij
is an interaction variable that reflects our hypotheses, depending on specification it will be represented by relative income, relative unemployment or relative job security.Since the addition of interacting terms may add to the multicolinearity problem we centered all variables by subtracting the mean value from each variable. The centering of variables often helps to minimize the multicolinearity problem and does not change the interpretation of estimation results (Aiken and West, 1991).
According to a standard international migration theory, we expect
10, 02
,
3
0
,
4 0,
5
0
,
6
0
,
7
0
,
8
0
. According to ourhypotheses we expect the coefficient for relative work importance to be positive, the coefficient for relative intrinsic work value index to be negative and the coefficient for relative extrinsic work value index to be positive. Our hypothesis 2 also states that the coefficient for the average number of valued work values should be positive. To test this, one specification will include the average number of valued work values (variable all_values) instead of the additive intrinsic and extrinsic indices.
16
model implicitly assumes that either the total population of the home country will eventually migrate or migration will not happen at all. As an alternative they propose to use migration stock instead of flow as a dependent variable. Other problems that arise with net migration data are a mis-measurement of migrants due to a lack of standardized definition of migration (mostly OECD countries maintain a consistent definition of immigrants across countries), mis-reporting and problems with accounting for return migration. Although, the mentioned problems to some extent exist also in stock migration data, however we believe that stock migration data are more accurate, especially for developing countries that account for about a half of total world migration.14
Also, some discussion is needed to justify our approach to regress 2000 stock migration rate, which is close to a sum of net migration rates over years, on other variables that relate purely to the year 2000.15 As shown by Mayda (2005) emigration (flow) rates show considerable inertia and therefore highly correlate to stock migration rates. The same inertia is found in work value related variables. Ogburn (1932) defined the delayed reaction of people to changes as cultural lag and Inglehart (Inglehart and Baker 2000) admitted that the changes in values are rather slow that justifies their usage in this study. We will use lags of income and unemployment variables to test the robustness. We also use the lagged income variable to address a possible endogeneity problem that might arise from the reverse causality of migration on income. Indeed, one may argue that newcomers ha e a egati e i pa t o a desti atio ou t s ages a d he e i o e. The usage of the lagged income variable may mitigate the endogeneity problem since it is hard to believe that future emigration can influence contemporary income in a destination country. The same logic can hardly be applied to values since they change very slowly. Also, cultural changes are not that easily calculated as income or remittances. The scales that sociologists use do not have such large variability as, for example, income has. Also, the scope of migration is not large enough to allow observing immediate changes in work values or job satisfaction in the destination country.
Our sample is affected by the well-known problem of most gravity models of international trade - our dependent variable contains a large portion of zeros
14 See Bauer and Zimmermann (1999) for other arguments in favor of stock migration as a
dependent variable
15 This approach is not new and is used in other studies (see for example Ortega and Peri
17 (out of 3746 observations 45% or 1706 observations are zeros). Since we use the log-log formulation of the model, the estimation of the basic specification will drop zero observations that may lead to selection bias. To overcome this problem an arbitrary small number may be used instead of zeros. In their recent study Ortega and Peri (2009) add one to the stock migration in order to account for zero migration rates and used the OLS estimator. The approach used in this study is based on Cameron and Trivedi (2009, p. 531) who recommend using Tobit maximum likelihood estimator adding the observed minimum value to logged dependent variable. While the minimum value of trade is somewhat questionable in the case of international trade, the value of one is a straightforward choice in the case of stock migration.
5. Estimation Results
Table 2 shows the estimates for both Tobit and OLS that is used to verify the robustness of our results. Both OLS and Tobit MLE estimates are consistent with the theoretical predictions. Tobit estimates show well-known regularity of being larger than OLS estimates and the average ratio of these estimates equal about 57% that is very close to the proportion of nonlimit observations in the sample (Greene, 2000).
Stock migration rate is negatively related to the income difference indicating that a 10% i ease i the desti atio ou t s i o e pe apita
increases stock migration rate by about 9.8%16 (the increase of GDPperCapitaj
by 10% decreases
GDPperCapi
ta
iGDPperCapi
ta
j by 9%, hence -9%*-1.464*0.74=9.817). The OLS estimate is a bit smaller indicating a 6.1% increase in the stock migration rate. The Tobit estimation (not reported in this study) with average wages in 2000 as a proxy for income gave a similar result indicating a 11% increase in the stock migration rate in response to a 10% increase in the
16 Mayda (2005) reported 19% increase in net migration rate in response to 10% increase in the destination county’s income per capita.
17 Wooldridge (2002) indicates that in order to interpret Tobit estimates (marginal effects)
18
desti atio ou t s a e age age. The To it esti atio of odel ith lagged income and unemployment variables change the estimated coefficient for relative income from –1.464 for the year 2000 to –1.558 for the year 1997 to –1.605 for the year 1995 and to –1.251 for the year 1990. Lower absolute value of the coefficient for the year 2000 suggests the potential presence of the endogeneity problem, since reverse causality likely biases the income coefficient toward zero.18 At the same time, higher (negative) coefficient for lagged income may indicate
a u ulatio effe t of sto k ig atio .
Table 2 also indicates the importance of geographical and cultural variables in explaining migration flows. All these variables are significant and have expected signs. Distance between countries remains an important constraint factor for international migration. According to our estimates, a 10% increase in the distance between countries decreases the stock migration rate by about 8% (Tobit) to 10% (OLS) on average. Common border, common language, and colony relations increase stock migration. High estimated coefficient for colony dummy indicates that institutional constraints like visas and immigration policies play an important role in decreasing migration flows.
It is worth mentioning effect of the difference in cultural orientation on stock migration. Most of the specifications indicate a negative or insignificant effect of the difference in TSR values and, somewhat surprising, a positive and significant effect of the difference in SSE values. The estimation with the composite Cultural Distance (CD) index revealed its insignificant effect on stock migration rate. The positive effect of the difference in SSE shows that people do migrate to the places with different attitudes toward work and quality of life. Specifically they migrate from the places where hard work is valued to the countries where self-expression in labour dominates.19 This result gives additional support to our hypotheses pointing out that the dimension of culture that reflects attitudes toward work significantly influences stock migration rates. At the same time, difference in attitudes toward authority reduces bilateral migration between countries. In the
18 Indeed, the assumption that immigrants are likely to decrease income in the destination
country and to increase income in the origin country imply increasing of relative income variable, hence the coefficient will decrease in absolute value.
19 As it was empirically established by Inglehart (2000) these post-materialist values, as he
19 other words, people do not migrate to the countries where the norms of authority subordination and the idea of individual role are different from their own.
Now let us take a look at the work value variables and their interactions with economic and job security variables. Model (1) presents estimation results with interaction of work value variables and income. The resulted coefficient for
Job_imp variable is the following expression:
j i j i ta GDPperCapi ta GDPperCapi ta GDPperCapi ta GDPperCapi log log * 86 . 2 93 . 4
Equating it to zero and solving for the income variable reveals that Job_imp variable has positive effect on stock migration rate provided GDP per capita in the source country is less then 0.13*GDP per capita (0.18 for OLS) in the destination country. This shows that greater importance of work in the source country increases migration only if income in the source country is considerably lower then in the destination that supports our Hypothesis 1. Solving similar inequalities for the coefficients of Intrinsic and Extrinsic indices, one can see that these coefficients do not change signs under reasonable values of income variables in the source country and destination countries and have signs suggested by our hypotheses 3 and 4.
Consider model (2) that is similar to model (1), we only excluded two interaction terms for Intrinsic and Extrinsic variables in order to estimate the coefficient for the income variable conditional on Job_imp variable. Solving the inequality
0
_
_
log
_
_
log
*
32
.
4
44
.
1
j i j iimp
Job
imp
Job
imp
Job
imp
Job
i plies that the desti atio ou t s i ease i i o e negatively
20
Table 2. Results of a of gravity-type migration model with work value indices and interaction terms
Model (1) Model (2) Model (3) Model (4) Model (5) Model (6)
OLS Tobit OLS Tobit OLS Tobit OLS Tobit OLS Tobit OLS Tobit
GDPperCapita -0.67a
(0.03) -1.46a (0.05) -0.67a (0.03) -1.43a (0.05) -0.67a (0.03) -1.44a (0.06) -0.67a (0.03) -1.42a (0.06) -0.97a (0.05) -1.57a (0.09) -0.71a (0.03) -1.51a (0.05)
Unemployment 0.27a
(0.06) 0.32a (0.10) 0.27a (0.06) 0.31a (0.10) 0.27a (0.06) 0.31a (0.11) 0.27a (0.06) 0.36a (0.11) 0.34a (0.08) 0.41a (0.12) 0.35a (0.05) 0.42a (0.10)
Log(Distance) -1.02a
(0.06) -1.41a (0.11) -1.05a (0.06) -1.39a (0.11) -0.98a (0.06) -1.28a (0.11) -1.01a (0.06) -1.36a (0.11) -0.95a (0.07) -1.13a (0.11) -1.05a (0.06) -1.41a (0.11)
Border 2.82a
(0.38) 3.71a (0.49) 2.80a (0.38) 3.79a (0.49) 2.75a (0.38) 3.70a (0.49) 2.70a (0.38) 3.54a (0.49) 2.54a (0.43) 3.14a (0.54) 2.77a (0.38) 3.71a (0.49)
Log(TSR) -0.20a
(0.06) -0.37a (0.10) -0.20a (0.06) -0.36a (0.10) -0.12b (0.06) -0.23b (0.10) -0.13b (0.06) -0.25b (0.10) -0.11 (0.07) -0.12 (0.10) -0.20a (0.06) -0.37a (0.10)
Log(SSE) 0.32a
(0.06) 0.37a (0.11) 0.32a (0.06) 0.29a (0.10) 0.37a (0.06) 0.40a (0.11) 0.38a (0.06) 0.42a (0.11) 0.12c (0.07) 0.01 (0.11) 0.36a (0.06) 0.38a (0.11)
Language 1.19a
(0.28) 1.52a (0.44) 1.21a (0.28) 1.58a (0.44) 1.31a (0.28) 1.77a (0.44) 1.31a (0.28) 1.77a (0.44) 1.73a (0.34) 2.34a (0.45) 1.18a (0.28) 1.51a (0.44)
Colony 3.23a
(0.40) 4.43a (0.50) 3.13a (0.41) 4.28a (0.51) 3.32a (0.40) 4.65a (0.49) 3.24a (0.40) 4.45a (0.49) 2.87a (0.44) 3.62a (0.53) 3.19a (0.40) 4.43a (0.50)
ESI 0.32c
(0.17) -0.15 (0.31) All_values 0.55a (0.16) 2.04a (0.30)
Job_imp -4.93a
21
Intrinsic -0.75a
(0.26)
-0.21 (0.48)
-0.75a (0.26)
-0.49 (0.47)
-0.75a (0.26)
-0.18 (0.47)
-0.75b (0.27)
-0.54 (0.48)
-1.33a (0.32)
-0.62 (0.52)
Extrinsic 1.43a
(0.29)
2.36a (0.53)
1.43a (0.29)
2.32a (0.52)
1.43a (0.29)
2.25a (0.51)
1.43a (0.29)
2.42a (0.52)
1.64a (0.32)
1.94a (0.53)
Job_imp*GDPperCapita -2.86a (0.33)
-5.50a (0.64)
-2.48a (0.33)
-4.32a (0.63)
-2.97a (0.33)
-5.56a (0.64)
Intrinsic*GDPperCapita 0.55a (0.11)
0.71a (0.20)
0.33a (0.07)
0.85a (0.13)
Extrinsic*GDPperCapita -0.13 (0.12)
0.49b (0.22)
Job_imp*Unemployment -0.19
(0.74)
-1.64 (1.40)
Intrinsic*Unemployment 0.35c
(0.21) 0.90 (0.39)
Extrinsic*Unemployment -0.61a
(0.22)
-1.84 (0.42)
Job_imp*ESI -4.13a
(1.13)
-4.39b (2.04)
Intrinsic*ESI 3.07a
(0.27)
5.49a (0.55)
Extrinsic*ESI -1.23a
(0.33)
-1.46b (0.63)
All_values*GDPperCapita 0.47a
(0.08)
1.26a (0.15)
Obs. 3746 3746 3746 3746 3746 3746 3746 3746 2532 2532 3746 3746
22
Dependent variable =
i ij
Population Migration
Stock_ 1
log
. Subscripts i and j indicate source and recipient country, respectively. All interaction variables appear in the equation as a zero centered measure of relative distance of corresponding variable
between countries i and j in the following form:
j i
j i
Variable Variable Variable
Variable
log log
. White heteroskedasticity-consistent standard errors (OLS), Huber/White standard errors (Tobit) are in parenthesis. (a)/(b)/(c) indicate 1%/5%/10% significance. Pseudo R2 is reported for Tobit estimator.
In model (3) we repeat the estimation of the basic model leaving only interaction between the Intrinsic index and GDP per capita. Repeating the analysis did not find realistic conditions in the relative Intrinsic indices in order to change the sign of the income variable, hence relative income negatively influences migration flow independently from the level of intrinsic work value.
In model (4) we use Unemployment as an interaction variable. The estimation results show the insignificance of of Job_imp(12) interaction term in explaining stock migration that reveals the unconditionally negative dependence of stock migration on relative job importance that does not fully support our Hypothesis 1. A number of works (Hatton (1995) as well as Bauer and Zimmermann (1999) notice that the (un)employment variable in many cases does not produce theory consistent estimation results. Here we think we are in the same trap. On our opinion, this might due to inaccuracy of unemployment data, especially for less developed countries.
Solving corresponding inequalities for the coefficients of Intrinsic and Extrinsic indices and comparing the results with ratio of average unemployment for source and destination countries from Table 1 one can conclude that these coefficients do not change signs under reasonable values of unemployment in the source and destination countries and have signs suggested by our hypotheses 3 and 4.
23
OLS estimates Tobit estimates
Job_imp coef. >0, if 0.31
j i ESI
ESI
11 . 0
j i ESI
ESI
Intrinsic coef. >0, if 1.54
j i ESI
ESI
12 . 1
j i ESI
ESI
Extrinsic coef. >0, if 3.79
j i ESI
ESI
76 . 3
j i ESI
ESI
Here in the first row we receive a result consistent with our hypothesis 1: an increase in the importance of work in the source country increases migration only if job security in the source country is significantly lower than in the destination country. Our finding shows that the level of job security in a country may significantly change the migration decision. Here we also find support for hypotheses 3 and 4 since positive dependence of stock migration on the relative index of extrinsic (intrinsic) work values always (rarely) holds.
We also estimated the models (1), (4) and (5) with factor score measures of intrinsic and extrinsic work values described in the Data section. The estimation results (not shown in the tables) of all three models are very similar to those obtained for models (1), (4), and (5).
24
6. Conclusion and Discussion
In this study we show the importance of accounting for labor market conditions and work values of population in sending and receiving countries when studying migration. We confirm the findings of other researchers on the importance of the income variable, of the distance between countries, of common borders, of common languages, and of colonial relations in explaining migration. We found that cultural distance in the dimension of attitudes toward work positively influences stock migration, while distance in the dimension of attitudes toward authority has the opposite effect. Also, we show that if more aspects of work are valued in a country, this country sends more migrants. Our study reveals the ultimate importance of both, extrinsic and intrinsic values of work. People tend to migrate from the countries where extrinsic values are high, and people tend to stay in the countries where intrinsic values are high. Concerning the perception of the i po ta e of o k , ou fi di gs sho that out-migration will be low for countries where the importance of work is high, but people will migrate if their anxiety about job instability is considerably high.
25 References
Aiken, Leona and Stephen West. Multiple Regression: Testing and Interpreting Interactions. Newbury Park: Sage Publications, 1991.
A di h ili, Ale a d e. The Relatio ship Bet ee Mea i g of Wo k a d So ioe o o i T a sfo atio , Ad a es i De elopi g Hu a Resou es , Ap . : -234.
Bauer, Thomas K. and Klaus F. Zimmermann . Assessment of Possible Migration Pressure and its Labour Market Impact following EU Enlargement to Central and Eastern Europe. Bonn: Institute for the Study of Labour Research Report #3, 1999.
Be i e ga, Vale ie R. a d B u e D. S ith. . U e plo e t, Mig atio , a d G o th , Jou al of Political Economy 105 (3): 582-608.
Bla hflo e , Da id G. a d Ch is Shadfo th. Fea , u e plo e t a d ig atio , The E o o i Journal, 119 (Febr. 2009): 136–182.
Bo jas, Geo ge J. Self-Sele tio a d the Ea i gs of I ig a ts, A e i a E o o i Re ie , (1987): 531-553.
Bo jas, Geo ge J. E o o i Theo a d I te atio al Mig atio , International Migration Review 23 (3), (1989): 457-485.
Brücker, Herbert and Boriss Siliverstovs. The Macro Determinants of International Migration in Europe: Evidence from Germany. 2004. Paper presented at the Conference Immigration Issues in EU-Turkish Relations, Bogazici University. Database on-line. Available at http://www.econ.boun.edu.tr/cee/cee/BrueckerMigration.pdf.
Buckingham, Marcus and Curt Coffman . First Break All the Rules. New York:Simon & Schuster, 1999. Cameron, Colin and Pravin Trivedi. Microeconometrics using Stata. College Station: Stata Press, 2009. Fe tig, Mi hael. The E o o i I pa t of EU-Enlargement: Assessing the Migration Pote tial, E pi i al
Economics 26, (4) (2001): 707-720.
Fis he , Pete , A., Rei e Ma ti a d Tho as St au haa . Should I sta o should I go? in International Migration, Immobility and Development, ed. Thomas Hammar et al. Oxford: Berg Press, 1997. Goldthorpe, John H., David Lockwood, Frank Bechofer, and Jennifer Platt. The Affluent Worker in the
Class Structure. London: Cambridge University Press, 1969.
Greene, William. Econometric Analysis, 4-th edition. New Jersey: Prentice Hall, 2000.
Halman, Loek and Astrid Vloet. Measuring and Comparing Values in 16 Countries. Documentation of the European Value Study 1981-1990 in Europe and North America. Tilburg: Work and Organization Research Centre,1994.
Ha is, Joh R. a d Mi hael P. Toda o. Mig atio , U e plo e t a d De elop e t: A Two-Sector A al sis, A e i a E o o i Re ie , , : -42.
Hatto , Ti oth J. A Model of U.K. E ig atio , - , The Re ie of E o o i s and Statistics 77, (3), (1995): 407-15.
Herzberg, Frederick, Bernard Mausner, Richard O.Peterson and Dora F. Capwell. Job Attitudes: Review of Research and Opinion. Pittsburg: Psychological Service of Pittsburg, 1957.
Hicks, John R. Theory of Wages. London: Macmillan, 2nd Edition, 1932.
Hsiao, Cheng. Analysis of Panel Data. Econometrics Society Monographs No. 11. Cambridge: Cambridge University Press, 1999.
Inglehart, Ronald. Culture Shift in Advanced Industrial Societies. Princeton: Princeton University Press, 1990.
26
Ka e e a, Da id, Vi to I. Oguledo, a d Bo Da is. A G a it Model A al sis of International Mig atio to No th A e i a, Applied E o o i s , : –1755.
Kazanas, H.C. Relatio ship of Jo Satisfa tio a d P odu ti it to Wo k Values of Vocational Education G aduates, Jou al of Vo atio al Beha io , , Ap . : -163.
Kohn, Melvin and Carmi Schooler. Work and Personality: An Enquiry into the Impact of Social Stratification. Norwood: Greenwood Publishing Company, 1983.
Le e , Joshua, Gail Pa he o a d Stepha ie Rossou . Do No -Economic Quality of Life Factors Drive I ig atio ?, IZA Dis ussio Pape . Colog e: IZA, .
Lueth, Erik and Marta Ruiz-A a z. A G a it Model of Wo ke s Re itta es, IMF Wo ki g Paper 290. Washington: IMF, 2006.
Mansoor, Ali and Bryce Quillin. Migration and Remittances Eastern Europe and the Former Soviet Union. Washington: The World Bank, 2007.
Maslow, Abraham. Motivation and Personality. New York: Harper and Row, 1970.
Mayda, Anna Maria. International Migration: A Panel Data Analysis of Economic and Non-Economic Determinants, IZA Discussion Paper No. 1590. Cologne: IZA, 2005.
Mo se, Na a d Ro e t Weiss. The Fu tio a d Mea i g of Wo k a d the Jo , A e i a Sociological Review20, (1), (Febr. 1955): 191-198.
Ogburn, William F. Social Change. New York: Viking Press, 1932.
Ortega, Francesco and Giovanni Peri. The causes and effects of international migrations: evidence from OECD countries 1980-2005. NBER Working Paper 14833. Cambridge, MA, 2009.
Ratha, Dilip and William Shaw. South-South Migration and Remittances. World Bank Working Paper 102. Washington: World Bank Development Prospects Group, 2007.
Sa i ka, Aida. Economic Performance and Work Ethic: the Comparison of European Cou t ies, -166 in The European Value System ed.Jadwiga Koralewicz. Warsaw: Collegium Civitas Press, 1999. Sjaastad, La A. The Costs a d Retu s of Hu a Mig atio , Jou al of Politi al Economy 70, (1962):
80-93.
Tadesse, Bedassa a d Roge White. I ig a ts, ultu al dista e a d U.S. state-level exports of cultural p odu ts, No th A e i a Jou al of E o o i s a d Fi a e , : –348.