Human geography
In recent decades, the role of interna-tional migration has increased dramatical-ly in most European countries. The growth in migration has made some authors proc-laim the beginning of a second Migration Period that could transform the social and cultural identity of Europe. The article pre-sents an analysis of international migration geography in Europe in the last twenty-five years. The authors identify the main trends in migration, provide migration profiles of European countries, and propose a classi-fication based on the recent changes in the migrant stock. Changes in the migrant stock (total emigration and immigration) reflect the level of involvement in interna-tional and global processes. They can serve as an indicator of a country’s attractive-ness for both foreigners and the country’s citizens. The study shows that European countries are increasingly split into ‘immi-grant’ and ‘emi‘immi-grant’ states. The authors describe spatial patterns of migration. The volume and localisation of migration flows in Europe are affected not only by cultural and historical circumstance, such as a co-lonial past or a common language. The scale of immigrant influx often does not depend on a donor country’s demographic potential or the level of its socio-economic development. The links between the place of origin and destination are often more complex than it might initially seem. The authors stress the importance of a differen-tiated immigration policy taking into ac-count ethnic and cultural features of host societies.
Key words: immigration, emigration, Europe, migration flow, immigration poli-cy, migration ties
There are different perspectives on the situation brought about by a mass influx of migrants into Europe, which has been observed in recent decades and especially the last few years [4; 10; 12; 17; 21]. We can discuss whether the current state is a unique phenome-GEOGRAPHY
OF EUROPEAN
MIGRATION
D.
V. Zhitin
*A. I. Krasnov
*A. V. Shendrik
**
Saint-Petersburg State University 7—9, Universitetskaya nab., St. Petersburg, 199034, Russia.
Submitted on February 19, 2016.
doi: 10.5922/ 2079-8555-2016-3-4
non that does not have parallels in the past of Europe and other regions or this happened before and it is a mere reflection of the laws of social devel-opment. All estimates demonstrate that the scale of international movements has increased in recent decades both on the European subcontinent and around the world. This is a result of globalisation manifested in an increase in growing mobility.
This article analyses 1990—2015 data on migrant stock (immigration and emigration) in European countries. The key method is a comparison of data on places of birth and residence, which takes into account long-term cross-border movements without totalling annual net migration. This ap-proach allows for assessing fundamental shifts in the intensity and directions of migration flows, excluding — when it is possible — the impact of short- and mid-term ‘background’ return and transit migrations.
The key objectives of this study are to identify steady international mi-gration trends in Europe, to construct a mimi-gration profile of countries, and to group them by migration stock characteristics. Special attention is paid to the analysis of spatial characteristics of migration flows and assessing the pros-pects of migration in individual regions and countries of Europe.
The major statistics sources used in the study are the data provided by the Population Division of the UN Department of Economic and Social Af-fairs [7].
The new migration wave rising in Europe was shaped by both an influx of migrants from other regions of the world and an increase in migration be-tween European countries having different levels of economic, social, and political development. The increase in migration between European states was partly closed by the fall of the Iron Curtain — the collapse of the global socialist system led by the Soviet Union and the removal of foreign travel restrictions in Eastern European states.
As Russian and international researchers stress [6; 15; 23], the period following the 1990s saw the most considerable increase in the number of migrants in European countries. This was due to several circumstances. Firstly, armed conflicts on the territory of the former USSR and Yugoslavia, alongside the enlargement of the European Community and strengthening internal European ties, resulted in an increased migrant influx into European countries. Secondly, an important factor contributing to the intensity of mig-ration was the growing transport accessibility of European countries for mi-grants from poor and war-torn Asian and African countries. In the times of Marco Polo and Magellan, the way from Eastern Asia to Europe took months and not everyone could overcome its adversities. Today, travelling many thousands of kilometres is a mass phenomenon.
A large influx of migrants can be interpreted as a benefit for a country’s economic development. Since the proportion of working age individuals and the youth in immigrants is above the national average, immigration stimu-lates the development of the labour market and consumption [20]. Both fac-tors contribute to economic growth. At the same time, the level of education in migrants is often considerably lower than that of local population, which leads to social segregation and additional public spending on the adaptation and readjustment of migrants. The ethnic aspects of immigration complicate interactions with the host population, cause a rapid transformation of the cur-rent social norms, and contribute to social tensions. This can be illustrated by anti-immigrant rallies in Germany, France, Austria, and some other Euro-pean countries [26; 27].
Mass emigration, coupled with a low immigration rate, has different consequences. Migration is usually directed from a territory with lower
stan-dards of living to regions with higher social stanstan-dards1 [1, p. 151]. However,
some researchers [9; 11; 16] believe that migrants demonstrate a higher level
of passionarity defined as an activity manifested in individuals’ eagerness to
reach a goal (often an illusory one) and their propensity towards fierce struggle and self-sacrifice in achieving this goal [5, p. 509]. Indeed, staying at home is much easier than exploring the unknown searching for a better life in strange lands. Mass emigration makes the source country an inert tra-ditional society with an unfavourable age-sex structure and a low potential for internal transformations. In Europe, typical cases are the Balkan coun-tries (Albania, Bulgaria, Macedonia, Bosnia and Herzegovina, Serbia, and Montenegro) and, to a lesser degree, countries of Southern Europe (Portugal, Italy, Greece, and Malta).
However, mass emigration does not only entail preservation of the source country’s backwardness but also provides an opportunity for renais-sance. Connections with the historical homelands cemented by family bonds of millions of peoples can be converted into the investment of financially successful members of the diaspora and the economic development of source countries [24]. In recent history, a typical case is the phenomenal economic growth in China in the 1980—1990s, which was partly accounted for by the
investment from Huáqiáo — the overseas Chinese [2].
Alongside qualitative migration intensity and net migration, it is impor-tant to consider the geographical direction of migration flows — the coun-tries with which individual European states have the closest population
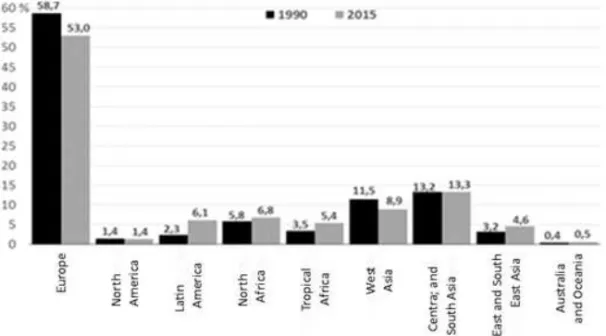
con-nections. In the early 1990s, 59% of all European immigrants were residents
of other European countries. Despite the fall of the Iron Curtain and the sig-nificant enlargement of the European Union — which shaped the common European labour market — this rate has not increased, on the contrary, it
dwindled by several percentage points2 (fig. 1).
1
An exception is temporary labour migration to regions with unfavourable living conditions and high salaries, as was the case in the Soviet period during the reclama-tion of most of Siberia, Far East, and the European North of Russian.
2
Fig. 1. Migration stock in Europe from different regions of the world (% of the total number of immigrants)
Compiled by the authors based on [7].
Nevertheless, emigration from European countries is primarily restricted to the continent. As of 2015, more than two thirds of European-born emi-grants lived in a different European country. Since 1990, this figure has in-creased by ten percentage points.
The most intensive migration exchange is observed between states that share a land border and have a common historical background. When these factors are accompanied by ethnic and linguistic affinity, reciprocal move-ments dominate the international migration connections of the neighbouring countries.
Whereas in the forty European states under consideration, migration
be-tween neighbouring countries accounts, on average, for 36% of total
migra-tion3, in Eastern and Southeastern Europe, this rate is much higher. The
highest intensity of migration between neighbours is characteristic of the three post-Soviet countries — Russia, Ukraine, and Belarus. In Belarus,
87% of the residents born beyond its borders arrived from the neighbouring
states4, in Russia and Ukraine, this rate is 70 and 82% respectively. This also
holds true for emigration — 79, 65, and 66% of emigrants born in Belarus,
Russia, and Ukraine respectively live in the neighbouring countries.
In different countries and regions of Europe, the geography of migration connections is shaped by their history. In the European states that once had large dominions, most immigrants come from the corresponding countries.
3
Including 33 % of immigration stock and 40 % of emigration stock.
4
Most UK immigrants originate from the former colonies in South Asia (In-dia, Pakistan. Bangladesh, Sri Lanka); French immigrants — from North Africa (Algeria, Morocco, Tunisia); Dutch — from Indonesia, Surinam, and the Antilles; and Portuguese — from the country’s former African colonies (Angola, Mozambique, Cabo-Verde, and Guinea-Bissau). Residents
origi-nating from former colonies account for 54% of all immigrants in the UK5,
50% in France, 54% in Portugal, 37% in Spain, and 21% in the Netherlands.
In other European countries, which did not have large colonies in the past, most immigrants are of Middle Eastern origin. In Germany, which pursued
an active policy in the Ottoman Empire and Iran in the 19th/early 20th
cen-tury, individuals from Turkey and the Middle East account for 18% of the
immigrants. People of Middles Eastern origin constitute one fifth of the im-migrants in the Nordic countries. History still determines migration connec-tions of European states. The table below shows that each large European country has a characteristic source country.
Regions of origin and number of immigrants (1,000 people) in the largest European countries
Region of origin
Country To tal nu mb er of immigra n ts W estern Eu rope
Eastern Europe No
rth A m erica Latin America No rth A frica Tropical Afric a East an d S o ut h -East Asia So ut h Asi a Cen tral Asia West Asia 6 Aust ralia and Oceania
Germany 12006 18.8 40.8 1.3 1.9 1.7 1.8 4.1 1.1 10.6 17.8 0.1 Russia 11643 1.4 39.7 0.0 0.0 0.0 0.0 1.0 0.1 42.6 15.2 0.0 UK 8543 20.5 15.5 3.6 5.4 1.5 15.6 10.4 19.0 0.9 5.1 2.5 France 7784 28.3 6.0 1.0 3.6 36.0 12.2 5.5 1.6 0.1 5.6 0.1 Spain 5853 20.1 18.5 0.8 37.7 13.2 3.3 3.6 1.8 0.1 0.8 0.1 Italy 5789 13.4 40.6 1.4 10.6 12.2 6.3 6.5 7.0 0.3 1.3 0.4 Ukraine 4835 5.9 77.2 0.1 0.0 0.0 0.0 0.4 0.1 11.6 4.7 0.0 Switzerland 2439 55.6 18.0 2.2 5.7 2.0 3.6 3.9 3.0 0.4 5.2 0.4 Netherlands 1979 17.0 12.2 2.0 18.3 10.5 5.8 13.6 2.5 1.8 15.6 0.7 Sweden 1640 27.1 17.3 1.6 5.2 1.8 8.9 8.1 3.1 2.4 24.2 0.3
European total 76106 18.5 34.5 1.4 6.1 6.8 5.4 4.6 3.7 9.6 8.9 0.5
Compiled by the authors based on [7].
5
This includes the Irish and people born in the countries of pioneer colonisation — the US, Canada, Australia, and New Zealand.
6
In Russia — a country that is very heterogeneous in terms of migration
[8] — former USSR republics account for more than 96% of immigrants and
77% of emigrants. In recent decades, Eastern European states were the
larg-est ‘importer’ of migrants to the economically developed countries of Wlarg-est-
West-ern Europe78. Until 1990, emigration from socialist countries to the West
was restricted due to political reasons. An exception was the republics of united Yugoslavia, whose citizens enjoyed greater mobility rights and had an opportunity to move to Germany, Austria, or Switzerland seeking employ-ment. After the fall of the Iron Curtain in the early 1990s, the situation changed dramatically — millions of residents of Eastern and Southeastern
Europe headed for the West. Today, they account for 30—55% of all
immi-grants in such countries as Austria, Germany, Italy, Finland, Ireland, and Greece.
Residents of Eastern European states show strong geographical prefer-ences when choosing a country of emigration. The reasons behind these
preferences are rather clear. For instance, 79% of Albanians living abroad
have chosen two states of South European countries — Greece (437 thou-sand people) and Italy (448 thouthou-sand people). Almost 1.7 million Romanians who gained the right to seek employment in EU states without any restric-tions have chosen linguistically similar Italy (over 1 million) and Spain (660
thou-sand). These two states and Germany account for 77% of all Romanian
im-migrants in the EU. The same three countries, although in a different order
(Spain — Germany — Italy), have become new homes for 53% of
Bulgar-ian immigrants in the EU [7].
Being the economic driver of Europe and having a diversified labour market and high living standards, Germany is the most attractive country for most Eastern Europeans. This holds true for not only its eastern neighbours — Poland and the Czech Republic — but also Hungary, Slovakia, and former Yugoslavian republics. Germany has received a fourth of all emigrants from
Croatia, 30% of those from Hungary, 40% from Poland, and almost 60%
from the Czech Republic.
The UK and Ireland are Germany’s major competitors for the position of the most popular recipient country. These states were the first to lift all re-strictions on the employment of citizens of Eastern European states that ac-ceded to the EU in 2004—2007. In the UK, the number of immigrants from
7
In this cases (and in the table) the term 'Western Europe' refers to the twenty states of Western, Nordic, and Southern Europe — Germany, the UK, France, Italy, Spain, the Netherlands, Belgium, Luxembourg, Austria, Switzerland, Sweden, Norway, Denmark, Finland, Iceland, Ireland, Portugal, Greece, Cyprus, and Malta.
8
Slovakia, Latvia, and Lithuania is far above that in all the other European countries. Moreover, the country has become the second (after Germany) most preferred destination for Poles (203 thousand people).
The choice of new place of residence is not always explained by geo-graphical remoteness, ethnolinguistic proximity, cultural and historical ties, or socioeconomic development. It is easy to explain why Algerian and Mo-roccan diasporas are the largest in France, Indian and Pakistani in the UK, and Turkish and Polish in Germany. It is evident why Spain has become ho-me to immigrants from Romania and Latin Aho-merica, alongside Moroccans living in the vicinity of this country. Russia’s history determined it close po-pulation connections with Ukraine, Belarus, and Kazakhstan.
It is more difficult to explain why many countries of Western Europe are populated by large groups originating from the states located thousands of kilometres away and having no evident links to their new home.
Let us consider several cases. In Luxembourg, the Portuguese account
for 38% of all immigrants and comprise 17% of the Grand Duchy’s
popula-tion. However, in the neighbouring states — France, Belgium, and Greece —
the proportion of the Portuguese is 9.2, 3.1, and 0.8% of all immigrants
re-spectively. In Belgium, whose population size is 20 and the number of im-migrants 5.5 times those in Luxembourg, the absolute number of the Portu-guese is 2.2 times smaller [7].
Another case is three Scandinavian countries — Denmark, Sweden, and Norway. They have a comparable proportion of immigrants (10, 17, and
14% respectively). At the same time, the proportion of immigrants from Sri
Lanka, which is distant from the Nordic countries in all respects, in Norway is 5.7 times as high as in the neighbouring Sweden. However, the number of Bangladeshi immigrants in Sweden is 7.3 times that in Norway. In Sweden and Denmark, there are large Lebanese diasporas (26 and 13 thousand re-spectively), whereas only 2,000 representatives of this Middle Eastern nation live in Norway.
Differences in the number and proportion of immigrants from different countries of the world are also observed on the largest Western European states. The UK, France, Germany, and Italy have never had steady migration or any other connections with the Philippines, Thailand, or Afghanistan. In the UK and Italy, there are large Philippine diasporas comprising over one hundred thousand people, whereas in France and Germany, the proportion of immigrants from this country is much lower. The proportion of immigrants from Thailand in Germany is 4.2 times that in France and 8 times that in It-aly. The Afghani who have moved to Europe in recent decades escaping the terrors of civil war and have been granted asylum, prefer to settle in Italy and
the UK. The proportion of the Afghani9 in the total immigrant population in
these countries is 10—20 times that in Germany and France, where the Af-ghani population is almost absent.
9
The above and other similar cases suggest that today, both qualitative and quantitative parameters of the immigrant inflow into a European country are determined by both the public migration policy and preferences of immi-grants. The geopolitical and geoeconomic position of certain countries and their regions are also important [13].
The localisation of international migrants and the intensity of migration flows do not always follow obvious geographical patterns, even if the movement is restricted to a relatively homogeneous ethnocultural environ-ment. The recent decades have seen a massive influx of immigrants from Latin America into Spain, which is explained by ethnocultural proximity and the attractiveness of the former metropolitan state as a country with higher standards of living. However, the number of immigrants from different Latin American states living on the Iberian Peninsula is seldom correlated with the demographic potential of these states. The number of Ecuadorians (422 thou-sand) living in Spain is 2.3 times that of Peruvians (183 thouthou-sand) residing on the Iberian Peninsula, although the population of Peru (31.2 million peo-ple) is twice that of Ecuador. (15.3 million) [7].
The assumption that a poor10, semi-patriarchal society has a lower spatial
mobility or the opposite statement — countries with lower incomes have higher migration rates — are not always true. For instance, out of the three Central American states, which are comparable in terms of their population size — Costa Rica, Guatemala, and Honduras — the least economically de-veloped Honduras accounts for most immigrants living in Spain. The num-ber of Hondurans residing on the Inum-berian Peninsula is 11 times that of immi-grants from Costa Rica, which is considered an affluent Latin American
country11 and five times that of the newcomers from poorer and densely
po-pulated Guatemala12.
The above suggests that the geography of migration connections does not always follow a simple pattern, according to which the intensity of mi-gration flows and the choice of destination country are determined by socio-economic parameters, a common cultural and historical (or ethnolinguistic) background, and transport connections. It is often difficult to determine what the initial impulse behind the development of diasporas was. Sometimes it is an arbitrary choice of a group of immigrants who learnt about an earlier un-known ‘promised land’ in Europe. Sometimes the impulse is a PR campaign of destination states, which was the case in Finland in the 1990s — the coun-try granted refugee status to a large group of Somalis [25]. The mechanism of the ethnic diaspora development, which is described below is rather typi-cal and is observed in different countries.
10
Here and below, the adjective ‘poor’ has a purely economic meaning suggesting low standards of living.
11
According to the UN Statistics Division [18], in 2013, the GDP (PPP) per capita reached USD 10,200 in Costa Rica, 3,500 in Guatemala, and 2,300 in Honduras.
12
At the first stage, a group of immigrants is granted permanent residence — this can be political asylum or any other ‘humanitarian’ mechanism. Later, the immigrant community starts to grow with an influx of new refugees and family reunions. In modern Europe, the right to asylum and family reunion is a basic principle of migration policy. Thus, a developed ethnic community becomes a powerful magnet for new immigrants. As a result, large immi-grant communities are formed ‘out of thin air’. In 1990—2015, the number of Somalis living in Finland increased from 54 people to 12.5 thousand. To-day, the immigrants from this African state are the fourth largest diaspora in Finland, the first three originating from the neighbouring states — Estonia (51 thousand), Sweden (41 thousand), and Russia (14 thousand). Over the same period, the number of Iraqis living in Norway increased 32-fold — from 0.7 to 22 thousand people and the Afghani community in the UK grew more than 130-fold — from 0.5 to 683 thousand people [7].
Studying the localisation of migration flows in Europe and analysing their quantitative characteristics allow us to identify the geographical pat-terns of international migration on the continent and trace the changes that took place in this area over the quarter century.
Despite a more than 50% increase in the total number of immigrants in
Europe in 1990—2015, the country-specific growth rates differed substan-tially. After a series of armed conflicts on the territory of former Yugoslavia, the number of immigrants in the countries of Southeastern Europe increased
by 40%, whereas a 2.6-fold growth was observed in the Nordic countries
and 4.4-fold in Southern Europe13. As figures 2 and 4 show, a decline in the
number of foreign-born residents took place only in the former USSR repub-lics (except Russia), Poland, and Bosnia and Herzegovina. The most dra-matic decrease took place in the Baltics (Estonia, Latvia, and Lithuania), Moldova, and Bosnia and Herzegovina. In these countries, the proportion of the foreign-born population reduced 1.6—4-fold over 25 years. In the former Yugoslavian republic, this reduction was caused by a civil war, which raged for almost four years, and the ensuing ethnic cleansing, whereas, in the Bal-tics and Moldova, changes in the ethnic composition were peaceful, attained through a consistent public policy of ousting ‘migrants’ [14]. A reduction in the number and proportion of immigrants took place in Belarus and Ukraine,
although at a smaller scale14 (fig. 2).
A reduction in the number of individuals born beyond the current bor-ders of Poland was accounted for by the natural decrease in the Poles who
had moved into the USSR after World War II15.
13
The most dramatic growth was observed in Spain, where the proportion of immi-grants increased almost sevenfold in 1990—2015.
14
In 1990—2015, the number of persons born abroad decreased by 13 % in Belarus and 30 % in Ukraine.
15
Fig. 2. European countries that changed their migration profiles in 1990—2015
Compiled by the authors based on [7].
The number of emigrants increased in most European countries over the 25 years. The average European increase in the number of individuals living
beyond the borders of their historical homeland was 21%. In Eastern and
Southeastern Europe, the growth was more than twofold16 (see fig. 2 and 4).
As a result, the divergence between source and destination countries has be-come more pronounced in Europe in recent decades. The number of foreign-born persons (immigration stock) is almost twice that of people who have left the country for other states (emigration stock) in the most developed European states (fig. 3).
16
Fig. 3. European countries with an increase in immigration stock, 1990—2015
Compiled by the authors based on [7].
In a number of Southeastern European states — Bosnia and Herzego-vina, Albania, Bulgaria, and Romania — one foreign-born resident accounts for 10—50 emigrants. The number of immigrants and emigrants is almost equal in eight out of the forty European states. This ‘buffer’ zone is changing over times — the Nordic and Western European states (Finland, Iceland, and Ireland) are rapidly becoming destination states, whereas Eastern European countries — Estonia, Latvia, and Ukraine — are turning into sources of mi-grants (see fig. 3—4).
Fig. 4. European countries with an increase in emigration stock, 1990—2015
Compiled by the authors based on [7].
The aggravation of migration situation observed in Europe in recent years — a result of a new influx of immigrants from Africa and the Middle East — necessitates the development and introduction of new approaches to the immigration policy. These approaches should take into account both the established migration connections of each European state and the opportuni-ties for integrating immigrants into local socieopportuni-ties. The latter depends on not only quantitative parameters of the migration flow but also ethnic and reli-gious identities.
The persistence of the above migration trends will inevitably lead to a to-tal transformation of the European sociodemographic and ethnocultural space. From the perspective of world history, these changes occur at a rapid
rate. In the Decline of the West, Oswald Spengler writes that, as 70 years was
re-quire not centuries but a much shorter period. During the Great Migration, which took place in the middle of the first millennium, a change in the eth-nocultural landscape of the European continent required several centuries, today, a similar process is taking place.
References
1. Anohin, A. A., Zhitin, D. V. 2013, Geografiya naseleniya s osnovami demo-grafii [Geography of the population with the basics of demography], St. Petersburg, 307 p. P. 151.
2. Bolohov, I. I. 2015, Globalizaciya po-kitajski: opyt uspeshnoj adaptacii [Glo-balization in Chinese: the experience of successful adaptation], Geopoliticheskij zhurnal [Geopolitical journal], no. 1 (8), p. 104—109.
3. Bol'shova, N. N. 2009, Krizis «social'nogo gosudarstva» i massovaya migra-ciya kak vyzovy gosudarstvu-nacii v usloviyah globalizacii (na primere FRG) [The crisis of "social state" and mass migration as the challenges the nation-state in the context of globalization (in the example of Germany)], Vestnik MGIMO University, no. 5, p. 94—108.
4. Buchanan, P. J. 2002, The Death of The West. St. Martin's Griffin, 320 p. 5. Gumilev, L. N. 1993, EHtnosfera: Istoriya lyudej i istoriya prirody [Ethnos-phere History of people and the history of nature], Moscow, 544 p.
6. Denisenko, M. B., Haraeva, O. A., CHudinovskih, O. S. 2003, Immigracion-naya politika v Rossijskoj Federacii i stranah Zapada [Immigration policy in the Russian Federation and the countries of the West], Moscow, 314 p.
7. United Nations Department of Economic and Social Affairs. Population Di-vision, 2016, available at: http://www. un. org/en/development/desa/population/ mi-gration/data/estimates2/estimates15.shtml (accessed 16 January 2016).
8. Zhitin, D. V. 2012, Prostranstvennaya neodnorodnost' migracionnogo dvizhe-niya Rossii v 1991—2010 gg. [Spatial heterogeneity of Russian migration movement in 1991—2010 gg.], Bulletin of St. Petersburg. Univ, Ser. 7, no. 4, p. 135—145.
9. Ivanov, K. P. 1998, Problemy ehtnicheskoj geografii [Ethnic geography Prob-lems], St. Petersburg, 216 p.
10. Inozemcev, V. L. 2003, Immigraciya: novaya problema novogo tysyachele-tiya [Immigration: the new challenge of the new millennium], Sociologicheskie is-sledovaniya, no. 4, p. 64—72.
11. Klokov, K. B., Stupin Yu. A., Hrushchev, S. A. 2008, Regional'nye osoben-nosti dinamiki chislenosoben-nosti i rasseleniya korennyh malochislennyh narodov Severa Rossii [Regional features of population dynamics and dispersal of indigenous peop-les of the Russian North], Izvestiya Russkogo geograficheskogo obshchestva [Pro-ceedings of the Russian Geographical Society], Vol. 140, no. 3, p. 45—50.
12. Kondrat'eva, N. B. 2015, Migraciya v Evrope: realii i vyzovy [Migration in Europe: Realities and Challenges], Sovremennaya Evropa [Modern Europe], no. 1(16), p. 147—149.
13. Kuznetsov, S. V., Mezhevich, N. M., Lachininskij, S. S. 2015, Prostranstven-nye vozmozhnosti i ogranicheniya modernizacii rossijskoj ehkonomiki: primer Se-vero-Zapadnogo makroregiona [Spatial capabilities and limitations of the moderni-zation of the Russian economy: the case of the Northwest macro-region] Ehkono-mika regiona [The region's economy], no. 3 (43), p. 25—38.
14. Kuznetsova, T. Yu. 2010, Migration trends in the Baltic region states: the spa-tiotemporal aspect, Balt. Reg, no. 4, p. 48—54. DOI: 10.5922/2079-8555-2010-4-5.
16. Michurin, V. A. 2008, Teoriya ehtnogeneza i budushchee Rossii [The theory of ethnogenesis and the future of Russia], 232 p.
17. Narochnickaya, E. A. 2013, Immigracionnye potoki v Evropu, ehkonomi-cheskij krizis i nekotorye voprosy teorii migracii [Immigration flows in Europe, the economic crisis and some problems of migration theory], Aktual'nye problemy Evro-py [Actual problems of Europe], no. 4, p. 10—38.
18. United Nations. National Accounts Main Aggregates Database, 2016, available at: http://unstats.un.org/unsd/snaama/selbasicFast.asp (accessed 29 January 2016).
19. Shpengler, O. 1998, Zakat Evropy. Ocherki mirovoj istorii [Decline of the West. Essays on the history of the world], Vol. 1. Geshtal't i dejstvitel'nost' [Gestalt and reality], Moscow, 663 p. P. 269.
20. Borjas, G. 1995, The Economic Benefits from Immigration. Journal of Eco-nomic Perspectives, Vol. 9, no. 2, pp. 3—22.
21. Ceobanu, A. M., Escandell, X. 2010, Comparative analyses of public attitu-des toward immigrants and immigration using multinational survey data: A review of theories and research, Annual Review of Sociology, no. 36, p. 309—327.
22. King, R. 2002, Towards a new map of European migration. International Journal of Population Geography, Vol. 8, no. 2, p. 89—106.
23. Taylor, J. E. 1999, The new economics of labour migration and the role of re-mittances in the migration process, International Migration, Vol. 37, no. 1, p. 63—88. 24. Tiilikainen, M. 2015, Looking for a safe place: Security and transnational Somali Muslim families, Journal of Religion in Europe, Vol. 8, no. 1, p. 51—72.
25. Ueffing, P., Rowe, F., Mulder, C. H. 2015, Differences in attitudes towards immigration between Australia and Germany: The role of immigration policy, Com-parative Population Studies, Vol. 40, no. 4, p. 437—465.
26. Weber, H. 2015, National and regional proportion of immigrants and percei-ved threat of immigration: A three-level analysis in Western Europe, International Journal of Comparative Sociology, Vol. 56, no. 2, p. 116—140.
The authors
Dr Dmitry V. Zhitin, Associate Professor, the Department of Human
Ge-ography, Saint-Petersburg State University, Russia. E-mail: [email protected]
Anton I. Krasnov, Senior Lecturer, the Department of Human
Geogra-phy, Saint-Petersburg State University, Russia. E-mail: [email protected]
Alexander V. Shendrik, Lecturer, the Department of Human Geography,
Saint-Petersburg State University, Russia. E-mail: [email protected]
To cite this article:
![Fig. 2. European countries that changed their migration profiles in 1990—2015 Compiled by the authors based on [7]](https://thumb-eu.123doks.com/thumbv2/123dok_br/18133521.325595/10.892.133.773.158.804/european-countries-changed-migration-profiles-compiled-authors-based.webp)
![Fig. 3. European countries with an increase in immigration stock, 1990—2015 Compiled by the authors based on [7]](https://thumb-eu.123doks.com/thumbv2/123dok_br/18133521.325595/11.892.143.733.163.734/european-countries-increase-immigration-stock-compiled-authors-based.webp)
![Fig. 4. European countries with an increase in emigration stock, 1990—2015 Compiled by the authors based on [7]](https://thumb-eu.123doks.com/thumbv2/123dok_br/18133521.325595/12.892.143.752.138.748/european-countries-increase-emigration-stock-compiled-authors-based.webp)
