Mortality associated to Hydro-Geomorphologic Disasters in the Great Lisbon area
in the last 150 years
Susana PEREIRA1, José Luís ZÊZERE1, Ivânia QUARESMA1
1 CEG, IGOT, Universidade de Lisboa, Lisboa, Portugal, [email protected]
Abstract: In Portugal, social impacts caused by floods and landslides in the last 150 years were gathered in the DISASTER database. The mortality patterns of the hydro-geomorphological (HG) disasters were recently explored at the national scale, but the analysis was not expanded to more detailed scales. In the present work we explore the mortality caused by HG disasters in the municipalities of the Great Lisbon area. The main objectives of this work are: (i) the spatio-temporal analysis of hydro-geomorphological disasters occurred in the last 150 years on the Great Lisbon area; (ii) the analysis of the frequency and the temporal evolution of fatal floods and landslides; (iii) the analysis of the spatio-temporal distribution of fatalities; (iv) the verification of gender tendencies in mortalities; and (v) the evaluation of individual and societal risk. Individual risk is evaluated computing mortality rates for floods and landslides, which are calculated based on the annual average population and the annual average of fatalities. Societal risk is evaluated by plotting the annual frequency of flood and landslide cases that generated fatalities (F-N curves) for the Great Lisbon area and the whole country.
The highest number of flood and landslide cases and related mortality occurred in the period of 1935– 1969. After this period, the number of flood and landslide fatalities decreased. The occurrence of flood fatalities has important clusters in Vila Franca de Xira, Odivelas, Oeiras and Lisbon Municipalities, generally associated with small watersheds. The Vila Franca de Xira municipality counts the highest number of fatalities generated by floods, and 84% occurred during a flash flood event in 25-26 November 1967. Fatalities caused by landslides mainly occurred in Oeiras and Lisbon municipalities. Flash floods caused the majority of fatalities associated with floods, while falls and flows were responsible for the highest number of fatalities associated with landslides. Males were found to have the highest frequency of fatalities. In the case of floods, the majority of fatalities were found both outdoors and inside of buildings in urban areas while fatalities inside buildings and inside a train were dominant in landslide cases.
Keywords: Great Lisbon area; Disaster database; landslides; floods; mortality.
1. Introduction
Mortality caused by natural hazards is usually difficult to assess in a systematic way due to both lack of temporal and geographic information (Borden and Cutter 2008) and unequivocal specification of the cause of death. In this context, databases on natural hazards can improve data quality for the study of mortality rates due to natural hazards in terms of temporal trends, spatial distribution, and epidemiological topics (Pereira et al. 2015). In Portugal the mortality patterns of disastrous floods and landslides occurred in the last 150 years were recently explored at the national scale by Pereira et al. (2015). This study was based on the DISASTER database (Zêzere et al. 2014) exploitation, which stores the social impacts caused by floods and landslides that generated fatalities, injuries, missing people, evacuated and homeless people referred to in Portuguese newspapers during the period of 1865–2010.
Natural disasters do not affect people equally because there are inequalities in exposure to risk as well as inequalities in access to resources, capabilities, and opportunities, rendering certain groups more vulnerable to the impact of natural disasters (Neumayer and Plumper 2007). For example gender is a socioeconomic vulnerability factor that can justify differences in natural hazard fatalities due to different social roles that result in exposure to different environments (Fothergill 1996).
According to the literature flood fatalities usually occur as a result of people attempting to travel across floodwater inside a vehicle or on foot, or being caught in a farmland, being trapped inside buildings, crossing bridges, roads, or streams, and attempting to rescue others (Coates 1999; Jonkman et al. 2009). Fatalities caused by landslides frequently occur as a result of building destruction, vehicles or persons affected by landslides on roads or railroads, and attempts to rescue others (Fordham and Meyreles 2013). In the present work we explore the mortality caused by HG disasters in the nine municipalities of the Great Lisbon area. The Great Lisbon Area includes 21.2% of the Portuguese population and some of the most densely populated municipalities of the country (e.g. Lisbon, Sintra, Cascais, Loures). In addition, the Great Lisbon Area registered 47% of the national mortality associated with HG disasters (Pereira et al. 2015). The main objectives of this work are: (i) the spatio-temporal analysis of hydro-geomorphological disasters occurred in the last 150 years on the Great Lisbon area; (ii) the analysis of the frequency and the temporal evolution of fatal floods and landslides; (iii) the analysis of the spatio-temporal distribution of fatalities; (iv) the verification of gender tendencies in mortality; and (v) the evaluation of individual and societal risk.
2. Data and methods
In Portugal, social impacts (fatalities, injuries, missing people, evacuated and homeless people) caused by floods and landslides during the period of 1865–2010 were gathered in the DISASTER database (Zêzere et al. 2014).
A set of national and regional newspapers were used to collect data from which DISASTER cases and DISASTER events were identified. A DISASTER case is a unique HG occurrence, which fulfils the DISASTER database criteria (i.e., any flood or landslide that, independently of the number of affected people, caused casualties, injuries, or missing, evacuated, or homeless people), and is related to a unique geographic location and a specific period of time (i.e., the specific place and time where the harmful consequences of the flood or landslide occurred) (Zêzere et al. 2014). A DISASTER event is a set of DISASTER cases sharing the same trigger, which may have a widespread spatial extension and a certain magnitude (Zêzere et al. 2014).
A content analysis of the newspapers reports of DISASTER cases was made in order to organize the information in a standardized format. Each DISASTER case includes details on the disaster characteristics and damages. The first includes data on type (flood or landslide), subtype, date of occurrence, location, and triggering factor (Zêzere et al. 2014). The second includes structural damages (damage to buildings and damages to train and road networks) and social consequences (human damage, gender of fatalities, and circumstances surrounding the fatalities). The total number of fatalities resulting from HG disasters is certainly underestimated because deaths that did not occur immediately after the disaster would not have been reported, and then it is not possible to asses these mortalities using newspapers as the single source of data.
Details on the circumstances surrounding fatalities associated with floods and landslides were also obtained from newspaper reports. The circumstances surrounding fatalities were divided into the following classes: inside a building in an urban area, inside a building in a rural area, outdoors in an urban area, outdoors in a rural area, inside a vehicle and inside a train. For cases where fatalities occurred either inside buildings due to flooding, or debris accumulation of a landslide, or building collapse due to flood or landslide, or during a failed attempt to escape from inside a building, the surrounding circumstance of the fatality was classified as “inside a building.” These can be located in either urban or rural areas. If the fatality occurred outdoors, it was classified according to the type of area (urban, rural). Finally, fatalities were also reported as occurring inside a motor vehicle and inside a train.
Individual risk was evaluated using mortality rates for floods and landslides, which were calculated based on years with population census in Portugal, i.e., normally every 10 years. Fortunately, the first modern population census in Portugal dates from 1864. The annual mortality rates were computed for each decade using the annual average of fatalities, which were then divided by the annual average population. The result was multiplied per 100,000 to scale it according to the size of population per unit time (Pereira et al.
2015). Societal risk was evaluated by plotting F-N curves representing the annual frequency of flood and landslide cases that generated fatalities.
3. Results
3.1 Spatial distribution of mortality
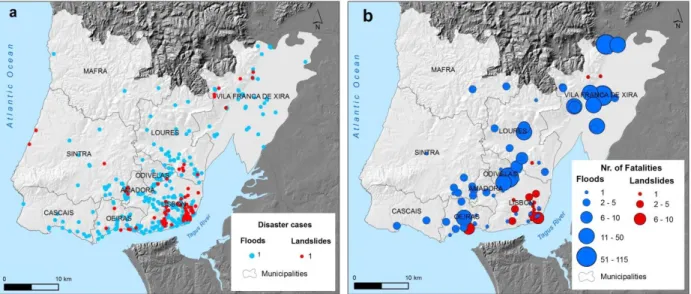
The spatial distribution of flood and landslide DISASTER cases along the Great Lisbon Area is presented in Figure 1a. In the complete period of 1865–2010 371 DISASTER flood cases (2.5 per year on average) and 538 flood fatalities (3.7 per year on average) were registered (Table 1). Disastrous flood were mainly located in Lisbon, Loures and Odivelas municipalities. The Lisbon municipality registered the highest percentage of flood cases (35.8%, Table 1). Flood fatalities were mainly located in Vila Franca de Xira, Odivelas, Loures and Oeiras municipalities (Figure 1b). The municipality of Vila Franca de Xira was affected both by frequent flash floods of small rivers and by the Tagus floods, which explains the large number of fatalities (313), where 295 fatalities were associated to a single DISASTER event occurred in November 1967.
In the same period 82 DISASTER landslide cases (0.6 per year on average) and 46 landslide fatalities (0.3 per year on average) were counted along the Great Lisbon Area (Table 2). Landslide DISASTER cases and landslide fatalities were dominant in the Lisbon municipality (68.3% and 69.6%, respectively) (Figure 1, Table 2). The Vila Franca de Xira municipality stands out with the highest flood density (3.13/100km2, Table 1) and Lisbon with the highest landslide density (0.32/100km2, Table 2).
3.2 Temporal trends of mortality
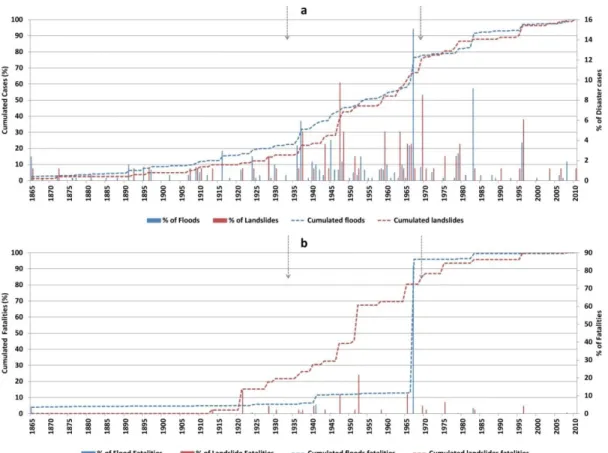
The annual distribution of flood and landslide DISASTER cases and of disaster fatalities during the 146 years were analysed taking into account three main periods already distinguished by Zêzere et al. (2014): (i) 1865–1934; (ii) 1935–1969; and (iii) 1970–2010 (Figure 2 a,b). The first time period (1865–1934) was characterized by a below-average number of cases (1.2 floods and 0.2 landslides per year). This time period accounts for only 5.8% and 21.8% of the total number of registered fatalities associated with floods and landslides, respectively.
The second time period (1935–1969) registered the highest mean annual number of flood and landslide cases (5.9 floods and 1.4 landslides per year). The mean annual mortality associated with HG hazards was highest during this period, with a total of 90.1% and 63% fatalities associated with floods and landslides, respectively (Figure 2).
The third time period (1970–2010) accounts for 22.1% and 24.4% of flood and landslides cases, respectively (Figure 2a), which corresponds, on average, to 2.0 flood/year and 0.5 landslide/year. Fatalities have registered a significant decrease in the number of deaths per year in comparison with the previous period. In the case of floods, the registered mortality for this third time period is only 4.1%, and the number of deaths/year (0.5). The annual fatalities associated with landslides correspond to 15.2% and the annual average is 0.2 fatalities.
Figure 1 – Disaster cases (a) and number of fatalities (b) caused by disastrous floods and landslides (b) occurred along
the Great Lisbon area in the period of 1865-2010
Table 1 – Flood Disaster cases and flood fatalities per municipality on the Great Lisbon Area
Flood Disaster cases Flood Fatalities
Municipality Area
(km2) Number % Density (#100km2) Number % Density (#100km2)
Amadora 23.8 11 3.0 0.24 6 1.1 0.06 Cascais 97.4 17 4.6 0.97 6 1.1 0.06 Lisbon 85.0 133 35.8 0.85 10 1.9 0.10 Loures 169.1 49 13.2 1.69 40 7.4 0.40 Mafra 291.7 3 0.8 2.92 6 1.1 0.06 Odivelas 26.5 31 8.4 0.27 96 17.8 0.96 Oeiras 45.9 44 11.9 0.46 39 7.2 0.39 Sintra 319.2 29 7.8 3.19 22 4.1 0.22
Vila Franca de Xira 318.1 54 14.6 3.18 313 58.2 3.13
Total 1376.7 371 100.0 13.77 538 100.0 5.38
Table 2 – Landslide Disaster cases and landslide fatalities per municipality on the Great Lisbon Area
Landslide Disaster cases Landslide Fatalities
Municipality Area
(km2) Number % Density (#100km2) Number % Density (#100km2)
Amadora 23.8 1 1.2 0.01 0 0.0 0.00 Cascais 97.4 0 0.0 0.00 0 0.0 0.00 Lisbon 85.0 56 68.3 0.56 32 69.6 0.32 Loures 169.1 6 7.3 0.06 2 4.3 0.02 Mafra 291.7 0 0.0 0.00 0 0.0 0.00 Odivelas 26.5 1 1.2 0.01 0 0.0 0.00 Oeiras 45.9 6 7.3 0.06 10 21.7 0.10 Sintra 319.2 5 6.1 0.05 0 0.0 0.00
Vila Franca de Xira 318.1 7 8.5 0.07 2 4.3 0.02
Figure 2 – Annual distribution of disastrous floods and landslides (a) and fatalities caused by disastrous floods and
landslides (b) occurred along the Great Lisbon area in the period of 1865-2010
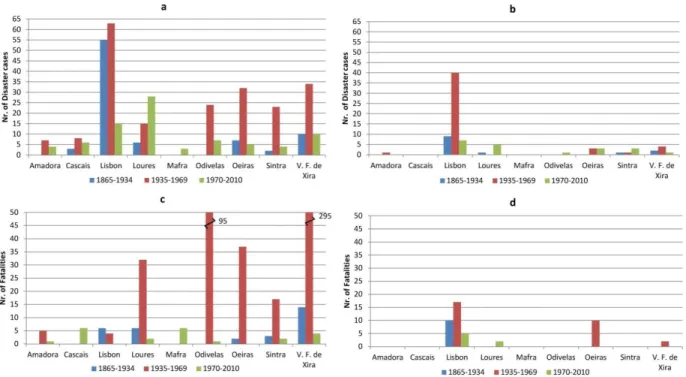
The number of DISASTER cases and fatalities caused by disastrous floods and landslides per municipality were analysed taking into account the above mentioned 3 time periods (Figure 3). The Lisbon municipality stands out with the highest number of flood cases in the first and second time periods (1865-1934; 1935-1969). Vila Franca de Xira, Oeiras, Odivelas and Sintra also registered most of the Disaster flood cases (Figure 3a), associated with the flash flood event of November 1967, whereas Loures registered the highest number of Disaster flood cases in the last period, associated with a flash flood event occurred during November 1983. The period 1935-1969 was characterized by the highest number of flood fatalities, especially in Vila Franca de Xira, Odivelas, Oeiras and Loures (Figure 3c) that were the most affected municipalities during the November 1967 flash flood (Trigo et al. 2015).
The highest number of landslide DISASTER cases was registered in Lisbon municipality in the period of 1935-1969 (Figure 3b) whereas the highest number of landslide fatalities was registered in Lisbon and Odivelas municipalities. In the last time period landslide cases occurred widespread in the study area (e.g. Lisbon, Loures, Odivelas, Oeiras, Sintra and Vila Franca de Xira) but landslide mortality was only registered in Lisbon and Loures (Figure 3d).
3.3 Gender tendencies in mortality
Circumstances surrounding the fatalities by gender in the Great Lisbon Area are presented in Figure 4. Flood fatalities were dominant inside buildings in urban areas (86.6% of total flood fatalities), whereas the major number of landslide fatalities was registered inside a train (34.8% of total landslide fatalities).
For the HG disaster cases where the gender of the victim is known, it is clear that male fatalities were dominant in floods and landslides (Figure 4). Also male fatalities were prevalent outdoors in urban and rural areas. The predominance of male fatalities generated by floods and landslides is consistent with previous observations on mortality associated with hydro-geomorphologic disasters in Portugal (Pereira et al., 2015). Male fatalities registered outdoors in urban and rural areas as a consequence of a DISASTER flood are 3 times higher than female fatalities in the same surrounding circumstances. This difference increases in the case of landslide fatalities observed outdoors in urban and rural areas. In contrast, the number of women is
similar to men concerning fatalities registered inside buildings. These results are probably associated with the HG disaster type (e.g. flash flood) that affected residential buildings with entire families.
Figure 3 – Number of DISASTER cases caused by disastrous floods and landslides (a, b) and number of fatalities caused
by disastrous floods and landslides (c,d) in 3 time periods per municipalities
Figure 4 – Circumstances surrounding the flood (a) and landslide (b) fatalities per gender
3.4 Individual and societal risk
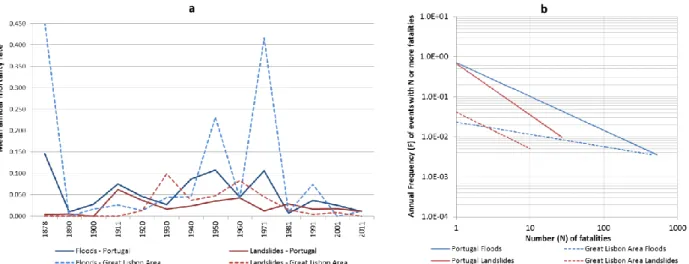
The mortality rate is higher for floods than for landslides, except in the 1930s and 1960s decades of the 20th century, when the mortality rate associated with landslides was slightly higher than the flood mortality rate (Figure 5a). Flood mortality rates reached two maximums, one in 1878 that corresponds to a very wet year (1876) that generated severe floods in Portugal (Trigo et al. 2014) which were responsible for 82 fatalities. Moreover, the mortality rate peak (0.453/105 inhabitants) is also a consequence of the low number of exposed population at that time (4.0×10⁵ inhabitants in Great Lisbon Area). Other flood mortality peak was registered in 1971, as a consequence of the November 1967 flash flood that caused at least 446 fatalities in the Great Lisbon Area, according to the DISASTER database. The landslide mortality rate was greatest in 1930 (0.099/105 inhabitants) and reached a secondary peak in 1960 (0.084 /105 inhabitants). Both flood and landslide fatality rates were very low during the first decades of the 21st century (Figure 5a).
Figure 5 – Mean annual mortality rates per time period adjusted to population census (a) and frequency versus
consequences (b) for flood and landslide cases that caused fatalities in Portugal and in Great Lisbon Area Figure 5b shows the curves of frequency against consequences for flood and landslide cases that caused deaths in Portugal and in the Great Lisbon Area (1865-2010). Equivalent data for Portugal is also presented for comparison. In Portugal the probability of DISASTER cases with fatalities is consistently higher for floods than for landslides, independently on the number of fatalities considered, which reflects the large difference observed in the number of flood and landslide cases per year (Pereira et al. 2015). The maximum annual number of fatalities associated with landslide DISASTER cases along the Great Lisbon Area range from 1 to 10 fatalities and the corresponding annual frequency ranges from 1.0−2.4 to 1.0−1.6 (Fig. 15b). The annual frequency of one or more fatal floods is higher than the landslide fatal floods when 6 or more fatalities were registered getting very close to the national flood F-N curve for 500 or more fatalities. The maximum annual number of fatalities associated with flood DISASTER cases in Great Lisbon Area range from 1 to 446 fatalities and the corresponding annual frequency ranges from 1.0−2.6 to 1.0−0.06 (Fig. 15b).
4. Conclusions
This study demonstrates the absence of any exponential growth with time of hydro-geomorphologic cases and associated fatalities in the Great Lisbon Area. The temporal trend of disaster mortality rate in this area is distinct for floods and landslides. Mortality associated with floods decreases with time since the 80´s of the 20th century, while mortality associated with landslides started to decrease a decade earlier. The temporal evolution of flood fatalities reflects the implementation of territorial management policies in the last four decades. In the 1960s, most fatalities caused by floods and flash floods occurred in slums located in the Lisbon periphery. These slums have progressively been eliminated and nowadays, although some residential areas are located in hazardous flood prone areas, recent buildings are resistant and normally do not collapse during a flood. Landslide fatalities in the Great Lisbon Area occurred as a consequence of isolated falls, while most common landslides in this area are slow moving landslides that usually cause structural damages in buildings and not human casualties. Although even today, buildings are often constructed on hazardous landslide prone slopes.
The spatial patterns of flood and landslide mortality in the Great Lisbon Area are explained by the unequal distribution of predisposing conditions to flood and landslide occurrence (geomorphologic and hydrologic), change of land use and population exposure in the highly populated municipalities, and the evolution of social vulnerability to hydro-geomorphologic hazards.
Very often, flood and landslide related deaths are linked to unnecessary risk-taking behaviour and to poor land management, with buildings and infrastructures erected on flood and landslide prone areas, which increase population exposure to hydro-geomorphologic hazards. Gender distribution of disaster fatalities showed that flood and landslide victims are mostly male. The higher exposure of males to HG disasters in Portugal can be explained by cultural reasons, related to the social role of the breadwinner that exposes
men to hazardous occupations. In addition, men often assume risk behaviors outdoors and act with a false sense of security inside vehicles (e.g., driving a car in flooded roads, cross bridges in flood situations).
Acknowledgments
S. Pereira is a Post-Doc fellow of the Portuguese Foundation for Science and Technology (FCT) (SFRH/BPD/69002/2010). This work was supported by the project FORLAND – Hydrogeomorphologic risk in Portugal: driving forces and application for land use planning (PTDC/ATPGEO/1660/2014) funded by Fundação para a Ciência e a Tecnologia, Portugal (FCT).
References
Borden, K., S. L. Cutter. (2008). Spatial patterns of natural hazards mortality in the United States. International journal of health geographics 7: 1–13. doi:10.1186/1476-072X-7-64.
Coates, L. (1999). Flood Fatalities in Australia, 1788-1996. Australian Geographer 30: 391–408. doi:10.1080/00049189993657.
Fordham, M., L. Meyreles. (2013). Gender aspects of disaster management. In Disaster Management: International Lessons in Risk Reduction, Response and Recovery, ed. A. Lópes-Caresi, M. Fordham, B. Wisner, I. Kelman, and J. C. Gaillard, 24.42. London: Routledge.
Fothergill, A. (1996). Gender, Risk and Disaster. International Journal of Mass Emergencies and Disasters 14: 33–56.
Jonkman, S. N., Maaskant, B., Boyd,E., Levitan, M.L. (2009). Loss of life caused by the flooding of New Orleans after Hurricane Katrina: analysis of the relationship between flood characteristics and mortality. Risk analysis : an official publication of the Society for Risk Analysis 29: 676–98. doi:10.1111/j.1539-6924.2008.01190.x.
Neumayer, E., Plumper, T. (2007). The Gendered Nature of Natural Disasters: The Impact of Catastrophic Events on the Gender Gap in Life Expectancy, 1981–2002. Annals of the Association of American Geographers 97: 551–566.
Pereira, S., Zêzere, J.L., Quaresma, I.; Santos, P.P.; Santos, M. (2015). Mortality patterns of hydro-geomorphologic disasters. Risk Analysis: 22. doi:10.1111/risa.12516.
Trigo, R. M., Ramos, C, Pereira,S., Ramos, A.M., Zêzere, J.L., Liberato, M.L. (2015). The deadliest storm of the 20th century striking Portugal; flood impacts and atmospheric circulation. Journal of Hydrology. Trigo, R. M., Varino,F., Ramos, A.M., Valente, M., Zêzere, J.L., Vaquero, J.M., Gouveia, C.M., Russo, A.
(2014). The record precipitation and flood event in Iberia in December 1876: description and synoptic analysis. Frontiers in Earth Science 2: 1–15. doi:10.3389/feart.2014.00003.
Zêzere, J. L., Pereira,S., Tavares, A.O., Bateira, C., Trigo, R.M., Quaresma,I., Santos, P.P., Santos, M., Verde, J. (2014). DISASTER: a GIS database on hydro-geomorphologic disasters in Portugal. Natural Hazards 72: 503–532. doi:10.1007/s11069-013-1018-y.