This article was published in Briefings in Bioinformatics, 17(5), 863-876, 2016 http://dx.doi.org/10.1093/bib/bbv096
Computational resources and strategies to construct
single-molecule metabolic models of microbial cells
Denise Gameiro, Martı´n Pe´rez-Pe´rez, Gael Pe´rez-Rodrı´guez, Gonc¸ alo Monteiro, Nuno F. Azevedo and Ana´lia Lourenc¸o
Corresponding author: Ana´lia Lourenc¸o, Escuela Superior de Ingenier´ıa Informa´tica (ESEI), University of Vigo, Edificio Polite´cnico, Campus Universitario As Lagoas s/n 32004, Ourense, Spain; Centre of Biological Engineering (CEB), University of Minho, Campus de Gualtar, 4710-057 Braga, Portugal. Tel: +34 988 387 013; Fax: +34 988 387 001; E-mail: [email protected]
Abstract
Recent computational methodologies, such as individual-based modelling, pave the way to the search for explanatory insight into the collective behaviour of molecules. Many reviews offer an up-to-date perspective about such methodologies, but little is discussed about the practical information requirements involved. The biological information used as input should be easily and routinely determined in the laboratory, publicly available and, preferably, organized in programmatically accessible data- bases. This review is the first to provide a systematic and comprehensive overview of available resources for the modelling of metabolic events at the molecular scale. The glycolysis pathway of Escherichia
coli, which is one of the most studied pathways in Microbiology, serves as case
study. This curation addressed structural information about E. coli (i.e. defining the simulation environment), the reactions forming the glycolysis pathway including the enzymes and the metabolites (i.e. the molecules to be represented), the kinetics of each reaction (i.e. behavioural logic of the molecules) and diffusion parameters for all enzymes and metabolites (i.e. molecule movement in the environment). Furthermore, the interpretation of relevant biological features, such as molecular diffusion and enzyme kinetics, and the connection of experimental determination and simulation validation are detailed. Notably, the information from classical theories, such as enzymatic rates and diffusion coefficients, is translated to simulation parameters, such as collision efficiency and particle velocity.
Keywords: in silico cell simulation; single-molecule precision; spatial location;
molecular diffusion; biochemical systems
Single-molecule data pave the way to a new generation of computational modelling approaches addressing fundamental biological features such as molecular diffusion, (three dimensional) spatial location and molecular crowding [4]. One such modelling approach is agent-based or individual-based modelling [5–7]. In these models, the cell is viewed as a complex environment, where single molecules behave as individual entities and suffer the influence of their local surroundings. The general goal is to observe the emergent behaviour of the system, namely the appearance of structures and auto-organization between molecules, which are difficult to observe in vivo or in vitro. Accordingly, individual-based modelling has been already used, for instance, to model molecular self-assembly [8] and assess diffusion in the cytoplasm or at the cytoskeleton [9–11].
The challenges to be met by single-molecule modelling are 2- fold: inaccuracy of system representation and high computational cost [12]. Although there is a growing volume of experimental data, source experiments are heterogeneous, and data integration is not straightforward. For example, it is not desirable to use enzyme kinetic data, such as turnover numbers and enzyme affinity rates, coming from experiments using different temperature ranges or different strains. Moreover, many of the biophysical and biochemical assumptions commonly accepted by the research community have to be aligned with suitable computational representation and parameterization. Most models, if not all, are not able to clearly indicate how they have addressed fundamental concepts of biology, namely how the computational parameters representing these features have been calibrated. For instance, it is not uncommon to describe particle speed (which comes in m/s) in terms of diffusion rate (which comes in m2/s). Other processes are typically represented by values that have scarce experimental validation, e.g. the individual rates of reaction steps in enzymatic catalysis, such as k1 and k2.
On the other hand, and although computational power has increased considerably in recent years, the computational requirements of these simulations are substantial. Biologically relevant timescales range from nanosecond to microsecond timescales for the internal dynamics of individual molecules to timescales of seconds to hours for entire biological processes [12]. The use of coarse-graining models, i.e. models that represent the system by a reduced and essential number of degrees of freedom and interactions, is the most viable strategy for developing physically accurate models that, at the same
time, cover the cellular space and timescales of the biological processes [5, 13]. The key issue is to determine what approximations can be tolerated without compromising the overall level of real- ism and, inherently, the predictive ability.
Many works describe and compare the computational approaches taken by current simulators working at single- molecule precision, but the present review is the first to address fundamental biological and computational issues of single- molecule modelling in practical and general terms [5, 7, 14]. The case study is the single-molecule modelling of the glycolysis path- way in Escherichia coli, which is one of the most well-studied pathways in Microbiology. Discussion is centred on how to establish a suitable timescale and a realistic dimensioning of the environment and its constituents; and, on how to instantiate elementary behaviour, such as molecular diffusion and enzymatic reactions, into computational parameters that may be experimentally calibrated. Along the way, systematic access of public online resources is investigated as means to speed up model reconstruction and result validation against experimental measurements.
The strategies and data resources hereby presented can be of use to mathematicians and bioinformaticians who are working on the development of single-molecule simulation frameworks as well as those researchers embracing the construction of new models.
Minimum information requirements of single- molecule metabolic models
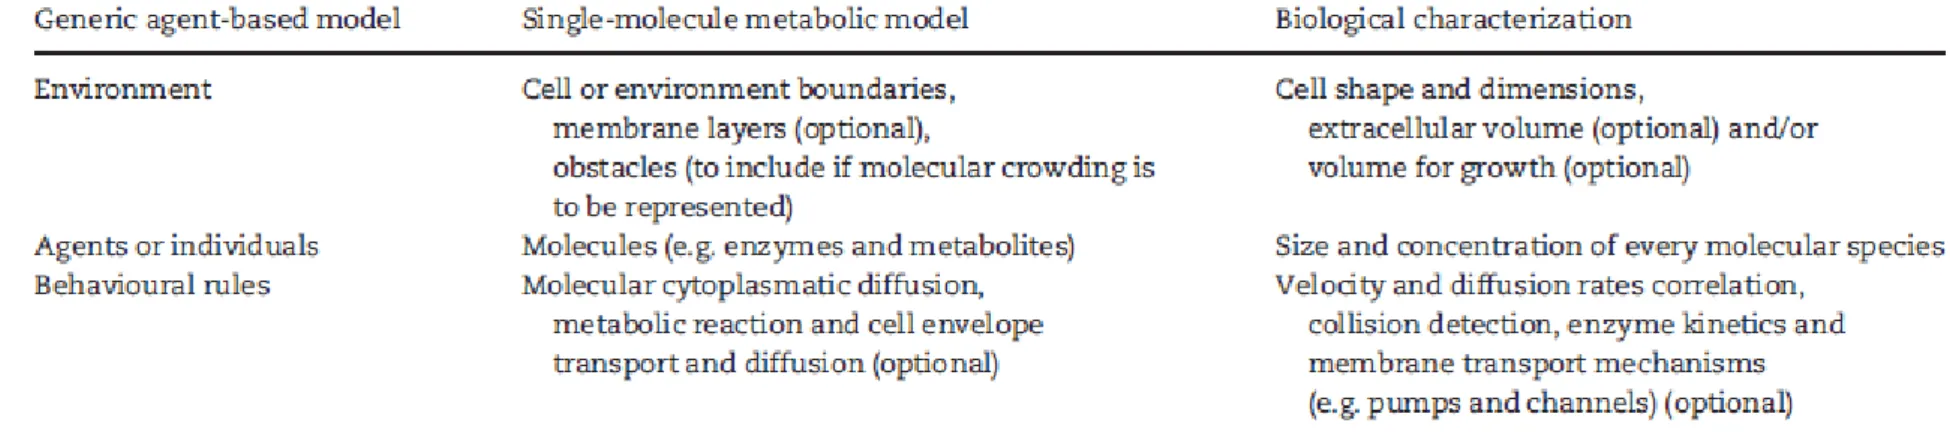
Model construction starts by identifying the most relevant molecules in the system of interest and compiling experimental data on their abundance, dimensions and general behaviour, so as to guarantee that their dynamics and function are meaning- fully characterized.
First of all, one must establish the space and timescales encompassed by the model. Typically, spatial resolution in the nanometer range is necessary for an adequate structural description, and high time resolution (in the nanosecond or millisecond range) combined with high temporal dynamic range (spanning from milliseconds to seconds) is needed for an adequate temporal analysis. Then, molecule characterization involves at least the following data: size, shape, localization, direction vector and speed for each molecule, i.e. rules of interaction between molecules. To simulate the cell, additional characteristics need also to be defined, such as cell shape, dimensions and relevant constituents (e.g. membranes) and volume of simulation, namely ac- counting for extracellular space or volume for growth (Table 1).
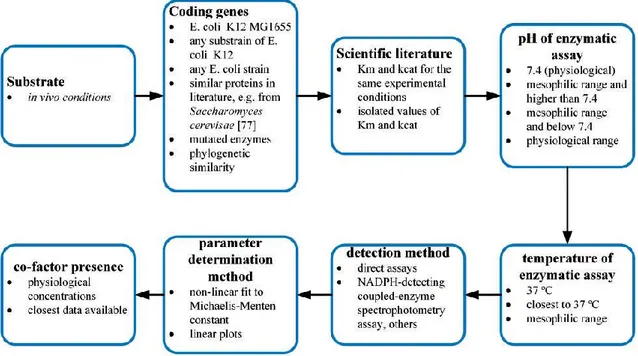
MG1655, the most well-studied strain and substrain of E. coli (Figure 1), including some enzymes of pyruvate metabolism involved in the formation of excreted products (formate, acetate and ethanol). Information was primarily retrieved from public web accessible biological databases, namely broad-scope data sources such as KEGG [15], domain-specific databases such as BRENDA [16], UniProt [17], PubChem [18] and ChEBI [19] and organism-specific data sources, such as EcoCyc [20, 21] and CyberCell [22]. When information was not available, the search was directed to other sub-strains of E. coli K-12 and, if needed, to records on any strain of E. coli. Literature curation, through PubMed [23] and BioNumbers [24], was issued in the absence of database records or whenever additional information was important. In the event that neither public databases nor scientific literature could provide for information on E. coli, information was sought by phylogenetic comparison, or following other criteria of similarity that is ad- equate for that particular information (e.g. sequence homology be- tween enzymes in the case of kinetic parameters).
In terms of experimental set-up, the search considered the following experiments: in the temperature range of 25–37oC, al- though values near 37oC were preferred, to maintain consistency with the growth conditions of cells in metabolite quantification experiments [25, 26] and within a pH of 7.2–7.8, which is the closest value range to the cytosol [27]. Alternatively, data were collected from available experiments with the closest set-up. Moreover, and because the first step of glycolysis involves glucose, a component that is typically in the exterior of the cell, the process of diffusion of this molecule through the cellular envelope is also addressed.
The next sections detail this curation procedure for the most important molecules and biological features of a single- molecule metabolic model of the glycolysis pathway in E. coli.
Environment: Dimensions and structure of E. coli
Information on the macrostructure of E. coli is needed to pro- duce an acceptable computational representation of the cellular environment. The volume of an E. coli cell is largely dependent on the strain, the phase in the cell growth (usually divided in exponential and stationary growth phase) and its growth conditions [28–30]. Literature reports that cell volume can range from approximately 0.4 m3, for E. coli st. B/rA cells in the stationary phase grown in minimal glucose medium [31], up to 4.4 m3, for exponentially growing E. coli K12 strain BW25113 using a complex medium (LB) as a substrate [28]. Selected cell-volume values are displayed in Table 2, and can offer some more insight into the possible variability of E. coli. The volume of simulation should be thus
determined according to the process of interest. For example, in a large majority of biotechnological processes, the relevant growth phase is the exponential and
E. coli is cultivated under favourable conditions, i.e. in a nutrient-rich broth.
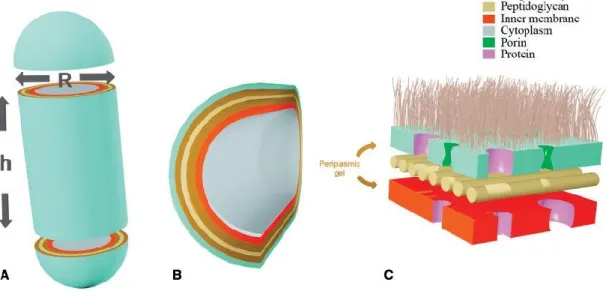
Geometrically, E. coli is a rod-shaped bacterium and may be modelled as a spherocylinder [32]. This means that the volumes described above will have to be decomposed into the two characteristic dimensions of this geometric shape, the radius (R) and the height (h) (Figure 2). Some of the studies that indicate the cell volume also indicate the radius of the cell (commonly named as cell width) (Table 2), and hence the height can be calculated using the volume equation for spherocylinders. It should be noticed that the height in this case is not equivalent to the cell length, a parameter that is also typically indicated in these studies (Table 2).
Moreover, the model may also encompass the characterization of the cellular envelope, because the first step of glycolysis involves glucose, a component that is typically in the exterior of the cell, and has to be transported into the inside of the cell. So, if the model describes the membrane interplay related to the passage of molecules to and from the extracellular space, it should include four layers: outer membrane, periplasm, peptidoglycan and inner membrane (Figure 2). An additional layer, that represents the capsule, may be added for certain E. coli strains in specific physiological states [33].
The physical characteristics of the cell envelope of E. coli (namely the thickness of each layer) are still poorly characterized [34, 35]. Existing data are limited and have been determined under diverse experimental conditions and using different techniques (Table 3). As such, these data should be refined as more information appears in the literature.
Concerning the cellular environment, simulations that con- sider the diffusion of compounds across the cell envelope should also account for extracellular volume in the simulation. This volume should be sufficiently large to accommodate a statistically meaningful number of molecules (e.g. glucose), but is typically restricted to improve the computational performance of the model.
Agents or individuals: E. coli molecular species
After defining the environment where the simulation will take place, it is then necessary to identify the agents involved and further characterize them both in terms of size and concentration. There are many different types of molecular species in the cytoplasm of microorganisms but, because of computational costs, biomolecular models typically represent only the most relevant species. For the case of metabolic pathways, such as glycolysis, the molecular species of interest are the metabolites (which include substrates, products and cofactors) and the
enzymes.
The first step to take is to identify correctly all agents involved, which in the case of glycolysis of E. coli consists of 16 enzymes and 19 metabolites. The considered pyruvate metabolism, involved in the formation of ethanol, acetate and formate, consists of an additional 10 enzymes and nine metabolites.
Escherichia coli is a well-studied organism, and there are thus several public
resources describing its metabolic pathways. Because of the sheer amount of data that are needed, systematic and programmatic data integration can be implemented using standard identifiers, cross-links and molecular species names (Table 4). Fully automated data integration is still not possible, but the automatic procedures considerably reduce the effort of manual curation and provide links to the literature originating the data, which are useful to investigate further details [41].
Data curation was multistep and iterative. First, the set of re-actions encompassed in the glycolysis/gluconeogenesis path-way were identified. Reaction records are typically linked to records of enzymes and compounds, and each reaction can be further decomposed into substrates, products, enzymes and co-factors (if applicable). Database records on each molecular species provide data relevant to the modelling as well as data useful to navigate other sources. Data such as molecular weight, amino-acid sequence, hydrodynamic radius and kinetic parameters (KM and kcat) are used in the model, whereas standard identifiers, ‘logic’ elements (e.g. coding genes for enzymes), and database cross-links enable source cross navigation.
Data on the glycolysis pathway, up to the formation of pyruvate, were extracted from the GLYCOLYSIS and PATHWAY: map00010 records in EcoCyc and KEGG, respectively (Table 5).
Further details on the pyruvate metabolism can be retrieved from the ‘mixed acid fermentation’ pathway in the FERMENTATION-PWY record in EcoCyc. Pyruvate fermentation is responsible for the end products of fermentation under an-aerobic conditions, namely lactate, fumarate, ethanol or acetic acid. Pyruvate fermentation performs the biological function of regenerating cofactors [like nicotinamide adenine dinucleotide (NADH)], besides the possible formation of additional adenosine triphosphate (ATP). Under aerobic conditions, pyruvate is directed towards the citric acid cycle, which forms CO2 as an end product. Regardless of the metabolic pathway that pyruvate will undergo, there will always be end products that will have to be transported to the outside of the cell.
Concerning molecular size, enzymes are typically described in terms of their hydrodynamic radius (Rh), i.e. the radius of a sphere that diffuses at an equivalent rate of the original, non-spherical molecule. The Rh can be calculated either as a function of the number of amino acids (N) in the enzyme (Equation 1) [43]:
3
The number of amino acids (paired with the information of the quaternary structure of the enzyme, which indicates if the protein is composed of more than one of the polypeptides coded by the amino-acid sequence) and the molecular weight of the enzyme are readily available in public databases. Of note, the molecular weight may differ among databases, because it may be either inferred from the protein sequence or determined experimentally (most commonly, by the sodium dodecyl sulfate poly-acrylamide gel electrophoresis laboratorial method) [45, 46], and the experimental determination can be of the multimer or of each of the subunits. This information is explicit in EcoCyc, while UniProt substantiates the information on quaternary structure with literature references. Enzyme concentrations were difficult to acquire. The work of Albe, published in 1990, is still the most systematized review of cellular concentrations of enzymes [42]. Further details can be found in Table S1 in Supplementary Material.
Table 6 introduces the metabolites in the E. coli glycolysis pathway compiled in this work, together with public database identifiers, size and concentration. The radius of metabolites (RvdW) can be approximated by a calculation method for the van der Waals volume (VvdW) (Equation 3) [47]:
which accounts for the van der Waals volume for each atom (VvdWi), the number of bonds (NB), the number of aromatic rings (RA) and the number of non-aromatic rings (RNR) in the molecule. Each radius can then be calculated using the geometric relation VvdW = 4/3 :RvdW. Data on the molecular structure of the metabolites can be automatically retrieved from chemical databases, such as PubChem [18] and CheBI [19].
A comprehensive quantification of the concentration of metabolites in the cytoplasm of glucose-fed and exponentially growing E. coli was carried out by Bennet et al. [26]. Real concentrations of metabolites assessed in that study include ATP, NAD+, coenzyme A and other metabolites that participate in glycolysis. Further details can be found in Table S2 in Supplementary Material.
0
0 D 4w
Behavioural rules: Modelling molecular diffusion in the cell
Diffusion plays a key role in biological systems. Diffusion, quantified in units of area per time, is the traditional way to express rates of movement of individual molecules in a crowded medium, such as cytosol or cell membranes. The small size of bacteria (about 1 m) makes in vivo measurements of diffusive processes substantially more complicated than in larger eukaryotic cells [48]. A number of works have studied the diffusion of proteins in E. coli, but this work is far from being comprehensive [49–54]. Moreover, it is hard to find measurements for the passage of molecules through the cell membranes [55].
As an alternative, the diffusion rate is often approximated by considering that molecules have a spherical shape and, consequently, a hydrodynamic radius (Rh), which allows the use of the Stokes–Einstein equation to calculate the diffusion coefficient (Dc) (Equation 4) [44, 56].
where R is the Boltzmann’s constant with a value of 1.3806488 x 10⁻²³ m2 kg s-2 K-1, T is the temperature (estimated around 25oC, equivalent to 298.12 K) and g is the viscosity of the medium in which the particle moves.
The viscosity may be determined for an approximation of the intracellular media in the form of monodispersed hard spheres [43], or using a scale-dependent viscosity reference curve based in the least squares method [44].
This is the typical way to approximate normal diffusion rates. However, in scenarios representing molecular crowding, we should account for anomalous diffusion and use a corrected form of the equation [57]:
where D is related to the apparent diffusion coefficient D and to the half-width wo of the detection volume 𝜏𝐷 = 𝑤0
2
4×𝐷Г is a constant that does not depend on
time and indicates whether diffusion is simple ( = 1) or anomalous ( ≠ 1). After obtaining diffusion values for each of the molecules, a strategy must be devised to translate the diffusive characteristic of the molecule into a velocity. If no applicable molecular tracking data have been published, one should look for approximations that render a Brownian motion, i.e. a so-called normal diffusion [51, 58, 59]. An alternative would be to take into account the size of the particle and move the particle in random direction using a fixed time step [10, 60]. The
mean square dis- placement < r2 > of a particle diffusing because of Brownian motion is proportional to the time elapsed, and the jump length is 6 x Dc x t in a three-dimensional space [61]. Another alternative would be to resort to the walk-on-spheres method and related first passage time algorithm [62, 63], or use the discretized Brownian trajectories and some variation of this algorithm [64]. It is important to notice that, as the information that is provided to an agent is the velocity, the diffusion calculated in this manner will always be affected by the number of agents that are present in the simulation and therefore needs to be recalibrated if this number changes.
In previous biomolecular models, it is not easy to identify the experimental validation supporting the approach to diffusion-velocity approximation, which hampers our ability to com- pare results [10, 65].
Behavioural rules: Detecting and resolving collisions
Even with the advent of single-particle-tracking experiments, there are no characterizations of the initial orientation of molecules of a certain species. As such, typically, at the start of the simulation, particles are randomly initialized with a random orientation. Every time a particle moves, the particle is reoriented one unit in the predetermined direction, so as to maintain an angular momentum.
The simulator engine looks into these movements and pin-points possible collisions. A collision is detected when the distance between two particles is less than the sum of their radii [66, 67]. Under these circumstances, the simulator checks if some form of interaction between the colliding particles has been specified (behavioural rules). If no rule exists, the particles are reoriented according to the constant linear motion equation (Figure 3). If an interaction should occur, the particles suffer some transformation, often regulated by a probability.
The specified interaction logic in the definition of behavioural rules reflects the biomolecular reactions. These include enzymatic reactions, but also binding effects of cofactors and the many types of protein–protein interactions that happen in cells. The characterization of such interaction requires specific data (Table 7).
Behavioural rules: Enzyme kinetics
Enzymatic reactions are a common example of interaction. When an enzyme meets its substrate, they form a complex, which with a certain probability should then react to products or dissociate again by diffusion.
crystallography and microspectrophotometry, have enabled the measurement of enzyme-catalyzed reactions inside single cells at the single-molecule level [68– 70]. However, these data are still insufficient to support single-molecule modelling on its own.
The largest source of kinetic data are traditional in vitro experiments that estimate the nature and progress of enzyme-catalyzed reactions based on mathematical relationships, most notably the equations established by Michaelis and Menten [71]:
in which the turnover number (kcat) takes the value of k2,Et½� is the total number of enzyme molecules, Vmax is the maximum rate achieved by the system at saturating substrate concentration and KM is the Michaelis–Menten constant.
Individual rates of each of the mechanism steps of enzyme catalysis (in this example, k1,k-1 and k2) are hard to come by, and there are currently no databases curating this type of information. The scarcity of these values is mainly because of the complexity of their experimental determination, usually based on solvent perturbations or determination of the temperature dependence of Michaelis–Menten constants [72]. In comparison, the determination of Michaelis–Menten parameters usually re-quires a fairly trivial set-up, and is a common and comparable measure of the kinetic capacities of enzymes. As such, it serves the purposes of research with different scopes, from structural biology to enzyme engineering, and there is a large body of published literature reporting Michaelis–Menten values. Recent re-views present possible mathematical approaches and software implementations [73, 74]. In turn, the BRENDA database is a comprehensive resource for further systematic retrieval of experimental data. EcoCyc and KEGG databases, although cross-linking extensively to BRENDA, may also provide some additional data. Notably, EcoCyc and KEGG organize enzyme records and reaction records individually, whereas BRENDA keeps one record per reaction. That record includes all possible enzymes that can carry out that reaction along with their respective catalytic properties.
In an attempt to curate kinetic data for the glycolysis path- way in E. coli (see basic curation procedure at Figure 1), much of the data could not be reliably retrieved from the databases. Mainly, the issue is that most of the existing KM and kcat data comes from different experiments, and it is not reasonable to pair them directly. So, assuming the need to manually curate kinetic data from the literature (either from database references or other literature), the experimental variables that affect the determination of Michaelis–Menten constants were
evaluated, and a manual curation procedure was devised (Figure 4).
The procedure puts together eight evaluation criteria that prioritize data search and selection in the following order: in vivo substrates; genes of E.
coli K-12 MG1655, E. coli K-12 strains or other E. coli strains; paired information
on KM and kcat obtained under the same conditions and experimental procedure, namely temperature and pH [25, 26, 75]; the parameter estimation method, notably non-linear fitting to the original Michaelis–Menten equation versus Lineweaver–Burke plots [76]; and finally, cofactor concentrations, which have also a significant influence in the catalytic efficiency [22]. Further details can be found in Table S3 in Supplementary Material. [77]
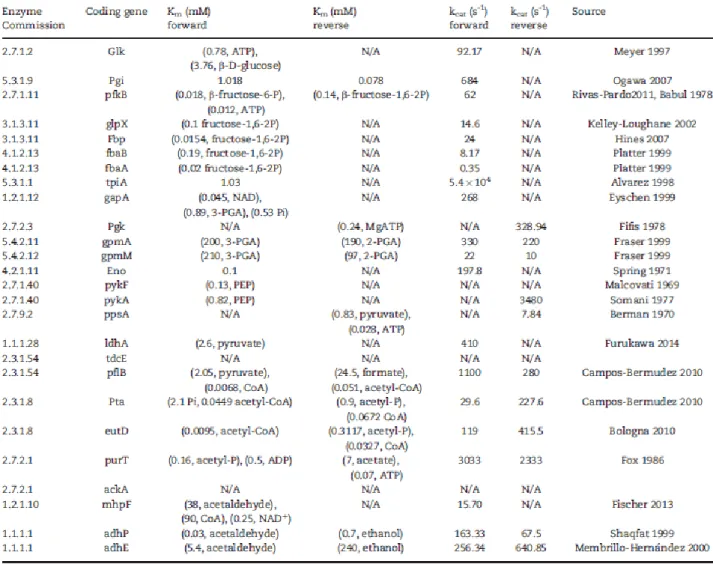
The kinetic parameters compiled in this work for the E. coli glycolysis pathway are presented in Table 8.
However, acquiring experimental data on enzyme kinetics is only one side of the challenge. It is also necessary to define and validate a computational representation of these parameters. There are many possible alternatives to obtain this representation. For instance, the physical meaning of the enzymatic parameter KM is inversely related to the affinity of the enzyme for substrate and may be modelled as the ratio of enzyme– substrate (ES) collisions that result in reaction. The probability that a reaction will take place can be determined by a probability value between 0.0 and 1.0, where a value of 1.0 results in a 100% chance of the reaction on collision (i.e. diffusion- limited reaction). In turn, kcat is a time parameter expressing the number of product released per number of enzyme per time (minutes or seconds), and may be modelled as the number of simulation steps in which the complex ES remains coupled.
Earlier works proposed a ‘look-up’ table for defining the relation between the microscopic reaction probability and the macroscopic reaction rate [78, 79]. Recent works are using the reaction diffusion equation with a boundary condition that reflects the volume exclusion principle [64].
Trade-off between modelling detail and computational costs
It is important that researchers take in consideration the high computational costs associated to such a detailed level of modelling. A realistic modelling of E.
coli cytoplasm can easily comprise several millions of molecules. The
cytoplasmic aqueous volume is reported to be 70% of the total volume of the cell, and the cellular structures, DNA, proteins and other components ac- count for the remaining 30% [22]. The number of protein molecules in the cell is estimated at 2.35 million molecules and metabolites at 1.10 million molecules [40]. The CyberCell data- base estimates the number of cytosolic proteins, excluding
ribosomal proteins, close to 1 million molecules, the ions per cell to be around 120 million and the number of metabolites approximate to 18 million molecules. Water molecules, averaging 7 x 10-13 g and 70% of the cell volume, have an estimated number of 2.34 x 10¹⁰ molecules in a single cell. Moreover, biologically relevant timescales range from nanosecond to microsecond time- scales for the internal dynamics of individual molecules to timescales of seconds to hours for entire biological processes [12].
Given that the capture of a larger number of physical concepts by the simulation tool (increased number of parameters) leads to a significant increase of computational costs, methods and software for flexible and efficient simulation of spatial stochastic models are growing in importance. High-performance computing strategies are of obvious interest and encompass the adoption of efficient algorithms, the careful performance tuning and the exploitation of parallel computers ranging from multi- core computers to cloud computers and supercomputers. At present, parallel computers and supercomputers are fairly accessible to most research centres, but the development of efficient software for large parallel computers is not in hands to many research groups. Some software packages aim to make such specialized computation more easily available to modellers. For example, Biocellion parallel software framework pro- vides predefined model routines through which end users may specify model specificities, without going into the details of the underlying high-performance computing strategy [80, 81]. Similarly, the Lattice Microbes software package takes advantage of graphical processing units and other many-core processors to enable the simulation of molecular crowding and sampling trajectories from the spatially homogenous (well stirred) chemical master equation and the reaction-diffusion master equation [82]. However, the costs of the development and maintenance of parallel and distributed implementations of biological models is still expensive, specially if one takes into account that most models will need to be revised and, most likely, expanded over time.
In this sense, the use of coarse-graining models, i.e. to represent the system by a reduced and essential number of degrees of freedom and interactions, is one of today’s most viable strategies for developing physically accurate and computationally reasonable models that, at the same time, cover both cellular length scales and timescales of biological processes [5, 13]. The simulation of a coarse-grained system requires fewer resources and goes faster than the full-scale representation of the same system, and thus allows an increase of orders of magnitude in the simulated time and length scales. The challenge is to deter- mine what approximations can be tolerated without comprising the overall level
of realism and, inherently, the predictive ability. For example, the representation of ‘obstacles’ or ‘hurdles’, i.e. mobile but inert particles, is a possible alternative to approximate the volumetric composition of the E. coli cytoplasm and evaluate the impact of molecular crowding [12, 64, 83]. A recent work discusses the complexity of the cellular environment in terms of different modelling perspectives, namely the chemical perspective, the physical perspective, the structural perspective and the biochemical perspective, and proposes different models, ranging from fully atomistic to reaction-diffusion models [12].
Final remarks
Single-molecule modelling of biomolecular systems is a powerful tool that complements the insights being acquired through state-of-the-art laboratory experiments and addresses challenging and fundamental biological questions, such as intrinsic noise. Such models may provide missing details, help verifying existing empirical results and aid in the formulation of new hypotheses and the design of new experiments.
The success of such computational modelling hinges on the accurate representation of the systems and the simulation of biologically relevant timescales. Technological advances have made biological investigations of single-molecule interactions possible and ever more frequent. Thereby, the ensemble-based data obtained from traditional molecular and biochemical techniques are being replaced by more detailed and accurate data (heterogeneity and intermediate states are readily revealed).
A key aspect of biological simulators operating at lower levels of detail, such as molecular precision, is that the information used as input should be easily and routinely determined in the laboratory, widely accessible and, preferably, organized in a systematic manner in public, programmatically accessible data- bases. Arguably, many important details still reside in scientific literature and require careful manual curation. So, effort should be put in releasing new models with the supporting data.
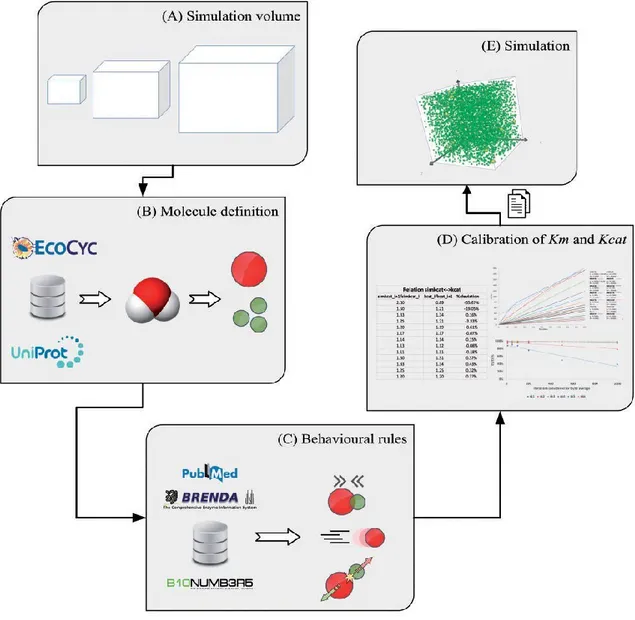
In this review, the information and computational requirements of a biomolecular agent-based model were explored (Figure 5). We investigated existing experimental data and described the specifics of different modelling approach coping with data uncertainty and incompleteness. As a practical exercise, we compiled the experimental data necessary to simulate the biochemical functioning of the glycolysis pathway in E. coli (see Tables 5–7 for details). Data unavailability and consistency issues (i.e. conciliating data from different experiments) were frequent and challenging. We resolved as many
issues as possible based on existing data and common biochemical and bio- physics principles and assumptions. The curation procedures were described so that other researchers may evaluate their adequateness to other model reconstruction. Such detailed simulation may help explore complex cellular behaviour and, if realistic enough, be a valid complement to the use of experimental techniques. Comprehensive details on our reconstruction of the biochemical functioning of the glycolysis pathway in E. coli at single-molecule scale can be found in Table S4 in Supplementary Material.
While we have limited our curation to the glycolysis pathway of E. coli, it is clear that ideally we should be able to address not only all the biochemical pathways of the bacterium, but also all the transport processes that occur at the cellular envelope. At the present day, this would likely collide with the computational capability of most computers. However, while a number of distributed and high-performance computing strategies are being devised in response to the large computational requirements, the conception of a standardized model format, and the development of modelling editors, should also be addressed. To the best of our knowledge, there are no markup languages for individual molecule modelling. The more closely related formalism we could find was BioNetGen, which was designed for ABMs and addresses the rule-based modelling of cellular signalling and genetic regulation [84, 85]. The creation of markup languages in support of individual-based biomodelling would enable model interchange and thus the reproducibility and repeatability of the experiments across different simulation tools.
At another level, the modelling of less-studied pathways and organisms could benefit from this growing work on simulation and tools in bioinformatics. For example, the existing kin- etic data could be improved by more detailed curation, and new standardized data (for physiological conditions) obtained for whole pathways with recent, miniaturized techniques for the determination of Michaelis–Menten constants [86, 87].
Supplementary Data
Supplementary data are available online at http://bib. oxfordjournals.org/.
Funding
This work was financially supported by: Project UID/EQU/ 00511/2013-LEPABE, by the FCT/MEC with national funds and, when applicable, co-funded by FEDER in the scope of the P2020 Partnership Agreement; Project NORTE-07-0124- FEDER-000025—RL2 Environment&Health, by FEDER funds through Programa Operacional Factores de Competitividade—COMPETE, by the Programa
Operacional do Norte (ON2) program and by national funds through FCT— Fundac¸a˜o para a Cieˆncia e a Tecnologia.
This work was also partially funded by the [14VI05] Contract-Programme from the University of Vigo and the Agrupamento INBIOMED from DXPCTSUG-FEDER unha maneira de facer Europa (2012/273). The research leading to these results has received funding from the European Union’s Seventh Framework Programme FP7/REGPOT-2012- 2013.1 under grant agreement no. 316265, BIOCAPS. This document reflects only the author’s views, and the European Union is not liable for any use that may be made of the information contained herein.
References
1. Chenouard N, Smal I, de Chaumont F, et al. Objective comparison of particle
tracking methods. Nat Methods 2014;11:281–9.
2. Duzdevich D, Greene EC. Towards physiological complexity with in vitro
single-molecule biophysics. Philos Trans R Soc Lond B Biol Sci 2013;368:20120271.
3. Leake MC. The physics of life: one molecule at a time. Philos Trans R Soc Lond
B Biol Sci 2013;368:20120248.
4. Foffi G, Pastore A, Piazza F, et al. Macromolecular crowding: chemistry and
physics meet biology (Ascona, Switzerland, 10-14 June 2012). Phys Biol 2013;10:040301.
5. Scho¨ neberg J, Ullrich A, Noe´ F. Simulation tools for particle- based
reaction-diffusion dynamics in continuous space. BMC Biophys 2014;7:11.
6. Conte R, Paolucci M. On agent-based modeling and computational social science.
Front Psychol 2014;5:668.
7. Kaul H, Ventikos Y. Investigating biocomplexity through the agent-based
paradigm. Brief Bioinform 2015;16:137–52.
8. Troisi A, Wong V, Ratner MA. An agent-based approach for modeling molecular
self-organization. Proc Natl Acad Sci USA 2005;102:255–60.
9. Hasnain S, McClendon CL, Hsu MT, et al. A new coarse- grained model for
E. coli cytoplasm: accurate calculation of the diffusion coefficient of proteins and
observation of anom- alous diffusion. PLoS One 2014;9:e106466.
10.Azimi M, Jamali Y, Mofrad MRK. Accounting for diffusion in agent based
models of reaction-diffusion systems with application to cytoskeletal diffusion. PLoS One 2011;6: e25306.
11.Lipkow K, Andrews SS, Bray D. Simulated diffusion of phosphorylated CheY
through the cytoplasm of Escherichia coli. J Bacteriol 2005;187:45–53.
macromolecules in cellular environments. J Mol Graph Model 2013;45:144–56.
13.Riniker S, Allison JR, van Gunsteren WF. On developing coarse-grained
models for biomolecular simulation: a review. Phys Chem Chem Phys 2012;14:12423.
14.Merelli E, Armano G, Cannata N, et al. Agents in bioinformatics, computational
and systems biology. Brief Bioinform 2007;8:45–59.
15.Kanehisa M, Goto S, Sato Y, et al. Data, information, know- ledge and principle:
Back to metabolism in KEGG. Nucleic Acids Res 2014;42:D199–205.
16.Chang A, Schomburg I, Placzek S, et al. BRENDA in 2015: excit- ing
developments in its 25th year of existence. Nucleic Acids Res 2015;43:D439–46.
17.Consortium U. UniProt: a hub for protein information. Nucleic Acids Res
2015;43:D204–12.
18.Wang Y, Suzek T, Zhang J, et al. PubChem BioAssay: 2014 up- date. Nucleic Acids
Res 2014;42:D1075–82.
19.Hastings J, De Matos P, Dekker A, et al. The ChEBI reference database and
ontology for biologically relevant chemistry: enhancements for 2013. Nucleic Acids
Res 2013;41:D456–63.
20.Karp PD, Weaver D, Paley S, et al. The EcoCyc database. EcoSal Plus 2014;30:56–
8.
21.Keseler IM, Mackie A, Peralta-Gil M, et al. EcoCyc: fusing model organism
databases with systems biology. Nucleic Acids Res 2013;41:D605–12.
22.Sundararaj S, Guo A, Habibi-Nazhad B, et al. The CyberCell Database (CCDB):
a comprehensive, self-updating, relational database to coordinate and facilitate in silico modeling of Escherichia coli. Nucleic Acids Res 2004;32:D293–5.
23.Lu Z. PubMed and beyond: A survey of web tools for searching biomedical
literature. Database 2011;2011:1–13.
24.Milo R, Phillips R. Cell Biology by the Numbers. 2014, http://www.
weizmann.ac.il/plants/Milo/?page_name¼publications.
25.Bennett BD, Yuan J, Kimball EH, et al. Absolute quantitation of intracellular
metabolite concentrations by an isotope ratio- based approach. Nat Protoc 2008;3:1299–311.
26.Bennett BBD, Kimball EEH, Gao M, et al. Absolute metabolite concentrations
and implied enzyme active site occupancy in Escherichia coli. Nat Chem Biol 2009;5:593–9.
27.Wilks JC, Slonczewski JL. pH of the cytoplasm and periplasm of Escherichia
coli: Rapid measurement by green fluorescent protein fluorimetry. J Bacteriol
2007;189:5601–7.
28.Volkmer B, Heinemann M. Condition-Dependent cell volume and
modeling. PLoS One 2011;6:1–6.
29.Taheri-Araghi S, Bradde S, Sauls JTT, et al. Cell-size control and homeostasis in
bacteria. Curr Biol 2015;25:385–91.
30.Vendeville A, Larivie`re D, Fourmentin E. An inventory of the bacterial
macromolecular components and their spatial organization. FEMS Microbiol Rev 2011;35:395–414.
31.Kubitschek HE, Friske J a. Determination of bacterial cell volume with the
Coulter Counter. J Bacteriol 1986;168:1466–7.
32.Margolin W. Sculpting the bacterial cell. Curr Biol 2009;19:R812–
22.
33.Madigan MT, Martinko JM, Bender KS, et al. Brock Biology of
Microorganisms. 2014, New York: Benjamin Cummings, 2014.
34.Sochacki KA, Shkel IA, Record MT, et al. Protein diffusion in the periplasm of E. coli
under osmotic stress. Biophys J 2011;100:22–31.
35.Dı´az-Mejı´a JJ, Babu M, Emili A. Computational and experimental approaches to
chart the Escherichia coli cell-envelope- associated proteome and interactome.
FEMS Microbiol Rev 2009;33:66–97.
36.Mitra K, Ubarretxena-Belandia I, Taguchi T, et al. Modulation of the bilayer
thickness of exocytic pathway membranes by membrane proteins rather than cholesterol. Proc Natl Acad Sci USA 2004;101:4083–8.
37.Bayer ME. Zones of membrane adhesion in the cryofixed envelope of Escherichia
coli. J Struct Biol 1991;107:268–80.
38.Vollmer W, Seligman SJ. Architecture of peptidoglycan: more data and more
models. Trends Microbiol 2010;18:59–66.
39.Graham LL, Beveridge TJ, Nanninga N. Periplasmic space and the concept of the
periplasm. Trends Biochem Sci 1991;16:328–9.
40.Escherichia coli and Salmonella cellular and molecular biology. Escherichia
coli Salmonella. 2nd edn, 1996, ASM Press: Washington, D.C.
41.Lourenc¸ o A, Carneiro S, Rocha M, et al. Challenges in integrating Escherichia coli
molecular biology data. Brief Bioinform 2011;12:91–103.
42.Albe KR, Butler MH, Wright BE. Cellular concentrations of enzymes and their
substrates. J Theor Biol 1990;143:163–95.
43.Dill K a, Ghosh K, Schmit JD. Physical limits of cells and proteomes. Proc Natl Acad
Sci USA 2011;108:17876–82.
44.Kalwarczyk T, Tabaka M, Holyst R. Biologistics–diffusion coefficients for
complete proteome of Escherichia coli. Bioinformatics 2012;28:2971–8.
45.Rath A, Glibowicka M, Nadeau VG, et al. Detergent binding ex- plains anomalous
SDS-PAGE migration of membrane proteins. Proc Natl Acad Sci USA 2009;106:1760– 5.
46.Shapiro AL, Vin˜uela E, Maizel J V. Molecular weight estimation of polypeptide
chains by electrophoresis in SDS-poly- acrylamide gels. Biochem Biophys Res
Commun 1967;28:815–20.
47.Zhao YH, Abraham MH, Zissimos AM. Fast calculation of van der Waals volume as
a sum of atomic and bond contributions and its application to drug compounds. J Org
Chem 2003;68:7368–73.
48.Oswald F, L M Bank E, Bollen YJM, et al. Imaging and quantification of
trans-membrane protein diffusion in living bacteria. Phys Chem Chem Phys 2014;16:12625– 34.
49.English BP, Hauryliuk V, Sanamrad A, et al. Single-molecule investigations of
the stringent response machinery in living bacterial cells. Proc Natl Acad Sci USA 2011;108:E365–73.
50.Mika JT. Molecule Diffusion in Bacteria and Consequences of Osmotic
Stress. 2012, PhD thesis, Mathematics and Natural Sciences, University of
Groningen.
51.Nenninger A, Mastroianni G, Mullineaux CW. Size dependence of protein
diffusion in the cytoplasm of Escherichia coli. J Bacteriol 2010;192:4535–40.
52.Luby-Phelps K. Cytoarchitecture and physical properties of cytoplasm: volume,
viscosity, diffusion, intracellular surface area. Int Rev Cytol 2000;192:189–221.
53.Elowitz MB, Surette MG, Wolf PE, et al. Protein mobility in the cytoplasm of
Escherichia coli. J Bacteriol 1999;181:197–203.
54.Coquel AS, Jacob JP, Primet M, et al. Localization of protein aggregation in
Escherichia coli is governed by diffusion and nucleoid macromolecular crowding
effect. PLoS Comput Biol 2013;9:e1003038.
55.Van den Wildenberg SMJL, Bollen YJM, Peterman EJG. How to quantify protein
diffusion in the bacterial membrane. Biopolymers 2011;95:312–21.
56.Scho¨ neberg J, Noe´ F. ReaDDy–a software for particle-based
reaction-diffusion dynamics in crowded cellular environments. PLoS One 2013;8:e74261.
57.Banks DS, Fradin C. Anomalous diffusion of proteins due to molecular
crowding. Biophys J 2005;89:2960–71.
58.Moura˜o M, Kreitman D, Schnell S. Unravelling the impact of obstacles in
diffusion and kinetics of an enzyme catalysed reaction. Phys Chem Chem Phys 2014;16:4492–503.
59.McGuffee SR, Elcock AH. Diffusion, crowding & protein stability in a dynamic
molecular model of the bacterial cytoplasm. PLoS Comput Biol 2010;6:e1000694.
60.Ridgway D, Broderick G, Lopez-Campistrous A, et al. Coarse- grained molecular
simulation of diffusion and reaction kinetics in a crowded virtual cytoplasm.
Biophys J 2008;94:3748–59.
geforderte Bewegung von in ruhenden Flu¨ ssigkeiten suspendierten Teilchen. Ann Phys 1905;322:549–60.
62.Hwang C-O, Given J a, Mascagni M. The simulation-tabulation method for
classical diffusion Monte Carlo. J Comput Phys 2001;174:925–46.
63.Muller ME. Some continuous monte carlo methods for the dirichlet problem. Ann
Math Stat 1956;27:569–89.
64.Byrne MJ, Waxham MN, Kubota Y. Cellular dynamic simulator: an event
driven molecular simulation environment for cellular physiology. Neuroinformatics 2010;8:63–82.
65.Bai H, Rolfe MD, Jia W, et al. Agent-based modeling of oxygen- responsive
transcription factors in Escherichia coli. PLoS Comput Biol 2014;10:e1003595.
66.Donev A, Torquato S, Stillinger FH. Neighbor list collision- driven molecular
dynamics simulation for nonspherical hard particles. I. Algorithmic details. J
Comput Phys 2005;202:737–64.
67.Sigurgeirsson H, Stuart A, Wan W-L. Algorithms for particle-field simulations with
collisions. J Comput Phys 2001;172:766–807.
68.Grima R, Walter NG, Schnell S. Single-molecule enzymology a` la
Michaelis-Menten. FEBS J 2014;281:518–30.
69.Ronda L, Bruno S, Bettati S, et al. From protein structure to function via single
crystal optical spectroscopy. Front Mol Biosci 2015;2:12.
70.Bourgeois D, Royant A. Advances in kinetic protein crystal- lography. Curr Opin
Struct Biol 2005;15:538–47.
71.Noor E, Flamholz A, Liebermeister W, et al. A note on the kin- etics of enzyme
action: a decomposition that highlights thermodynamic effects. FEBS Lett 2013;587:2772–7.
72.Ayala YM, Di Cera E. A simple method for the determination of individual rate
constants for substrate hydrolysis by serine proteases. Protein Sci 2000;9:1589–93.
73.Hellander S, Hellander A, Petzold L. Reaction rates for mesoscopic
reaction-diffusion kinetics. Phys Rev 2015;E91.
74.Wade RC, McCammon JA MJ. Biological diffusion and brownian dynamics.
Spec. Themat. Ser. Ina. BMC Biophys 2011;4.
75.Meier S, Jensen PR, Duus JO. Real-time detection of central carbon metabolism
in living Escherichia coli and its response to perturbations. FEBS Lett 2011;585:3133–8.
76.Gao H, Chen Y, Leary JA. Kinetic measurements of phospho- glucose isomerase
and phosphomannose isomerase by direct analysis of phosphorylated aldose-ketose isomers using tandem mass spectrometry. Int J Mass Spectrom 2005;240:291–9.
terms of vitro kinetics of the constituent enzymes? Testing biochemistry. Eur J
Biochem 2000;267:5313–29.
78.Andrews SS, Bray D. Stochastic simulation of chemical reactions with spatial
resolution and single molecule detail. Phys Biol 2004;1:137–51.
79.Erban R, Chapman SJ. Stochastic modelling of reaction— diffusion processes:
algorithms for bimolecular reactions. Phys Biol 2009;6:4.
80.Kang S, Kahan S, McDermott J, et al. Biocellion: accelerating computer
simulation of multicellular biological system mod- els. Bioinformatics 2014;30:3101– 8.
81.Kang S, Kahan S, Momeni B. Simulating microbial community patterning using
Biocellion. Methods Mol Biol 2014;1151:233–53.
82.Roberts E, Stone JE, Luthey-Schulten Z. Lattice microbes: high-performance
stochastic simulation method for the reaction-diffusion master equation. J Comput
Chem 2013;34:245–55.
83.Klann MT, Lapin A, Reuss M. Agent-based simulation of reactions in the
crowded and structured intracellular environment: influence of mobility and location of the reactants. BMC Syst Biol 2011;5:71.
84.Chylek LA, Harris LA, Faeder JR, et al. Modeling for (physical) biologists: an
introduction to the rule-based approach. Phys Biol 2015;12:045007.
85.Blinov ML, Faeder JR, Goldstein B, et al. BioNetGen: Software for rule-based
modeling of signal transduction based on the interactions of molecular domains. Bioinformatics 2004;20:3289–91.
86.Jambovane S, Duin EC, Kim SK, et al. Determination of kinetic parameters, Km
and kcat, with a single experiment on a chip. Anal Chem 2009;81:3239–45.
87.Xie Y, Ahmed D, Lapsley MI, et al. Single-shot characterization of enzymatic
reaction constants K m and k cat by an acoustic-driven, bubble-based fast micromixer. Anal Chem 2012;84:7495–501.
Figure 1. Semi-automatic E. coli data curation workflow. Public databases are accessed programmatically, and database cross-linking is used to navigate throughout different databases. Literature curation provides information not documented in databases and additional details.
Figure 2. Characteristic dimensions and membrane layers in gram-negative bacterial cells. (A) The cell depicted as a spherocylinder, such that the height of the cylinder is h and the radius of the spherical caps is R. (B) Cross-sectional view of the different membrane layers. (C) Detail representation of such layers.
Figure 3. Collision detection and particle reorientation. Consider two particles, A and B, with initial velocities VA1 and VB2. If they attempt to move to the same position, they should bounce. Particle reorientation will be calculated based on the angle of collision (), and velocity will be updated to VA2 and VB2, according to the linear motion rules.
Figure 4. Procedure for the manual curation of enzyme kinetics data from scientific literature. The procedure is detailed in terms of relevant experimental variables, in descending order of relevance.
Figure 5. Reconstruction of the biochemical functioning of the glycolysis pathway in E. coli at single-molecule level. Data resources and curation are described in terms of relevant information and integration steps. Initially, one should define the space and timescales encompassed by the model (A). Then, the size and shape of molecules should be specified (B) and their behaviour characterized (C). Simulation is 2-fold, involving parameter validation (D) and results observation (E).
Table 1. Essential components of a single-molecule metabolic model. A parallelism between the generic composition of an agent-based model and the biological information to be incorporated in a single-molecule model is established. Features that are only necessary to this modelling approach when the diffusion of particles through the cell envelope is assessed are indicated as optional
Table 2. Volume of an E. coli cell in different stages of growth and media. Volumes from [31] were determined for E. coli B/r by assessing pellet volume and cell number (Coulter counter); volumes from [28] were determined for E. coli K-12 BW25113 by microscopy analysis
Table 3. Experimentally calculated values for the different layers of the cellular envelope of E. coli. For the simulation of the passage of a solute into out of the cell, spherocylinders with the same R/h ratio as the one determined for the cell volume, and with the thickness described here, should be added to the model
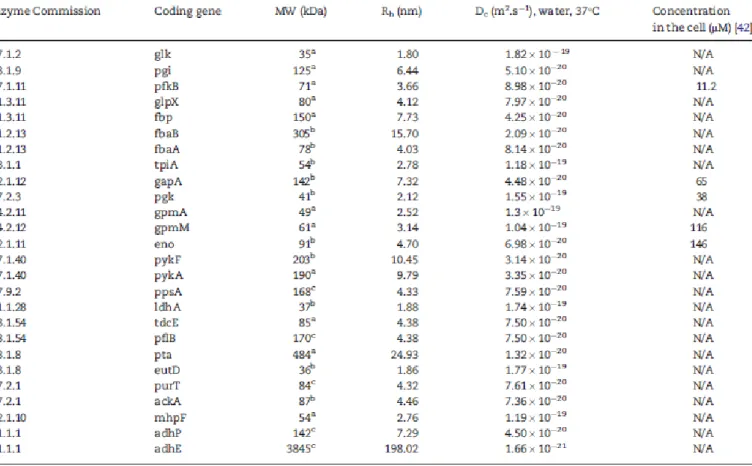
Table 5. Enzymes involved in E. coli glycolysis pathway. The hydrodynamic radius (Rh) was calculated as a function of the number of amino acids in the enzyme or its molecular weight (MW). The diffusion coefficient (Dc) is inversely proportional to the Rh and the viscosity of the medium (6.92 x 10⁻⁴ Pa.s)
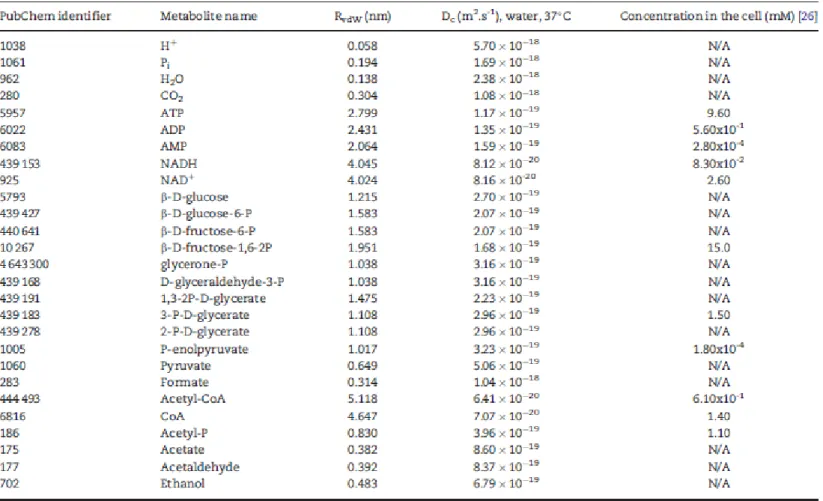
Table 6. Metabolites involved in E. coli glycolysis pathway. The van der Waals radius (RvdW) was calculated considering the equation for the van der Waals volume. The diffusion coefficient (Dc) is inversely proportional to the RvdW and the viscosity of the medium
![Table 2. Volume of an E. coli cell in different stages of growth and media. Volumes from [31] were determined for E](https://thumb-eu.123doks.com/thumbv2/123dok_br/15240431.1022898/25.1262.118.1062.212.407/table-volume-different-stages-growth-media-volumes-determined.webp)