Article
J. Braz. Chem. Soc., Vol. 29, No. 10, 2127-2136, 2018 Printed in Brazil - ©2018 Sociedade Brasileira de Química*e-mail: [email protected]; [email protected]
Metal Organic Frameworks for Selective Degradation of Amoxicillin in
Biomedical Wastes
Marcos V. Paula,a,b Amanda L. Barros,b Kaline A. Wanderley,b Gilberto F. de Sá,b
Marcos Eberlin,c Thereza A. Soares*,b and Severino Alves Jr.*,b
aPrograma de Pós-Graduação em Ciência dos Materiais,
Universidade Federal de Pernambuco (UFPE), 50590-470 Recife-PE, Brazil
bDepartamento de Química Fundamental, Universidade Federal de Pernambuco (UFPE),
Cidade Universitária, 50740-560 Recife-PE, Brazil
cLaboratório Thomson de Espectrometria de Massas, Instituto de Química,
Universidade Estadual de Campinas, 13083-970 Campinas-SP, Brazil
The accumulation of antibiotics in wastewater has led to the development and spreading of antibiotic resistance in the environment. Amoxicillin (Amox), a beta-lactamic antibiotic, is one of the most frequently consumed antibiotics in the world. We have applied two metal-organic frameworks (MOFs) containing zinc(II) as platforms to degrade Amox. We have predicted the adsorption of this antibiotic via molecular docking calculations which have been further corroborated by means of Fourier transform infrared and UV-Vis spectroscopies, thermogravimetric analysis, X-ray diffraction and scanning microscopy measurements. We have subsequently performed mass spectrometry analysis of Amox@zeolitic imidazolate framework-8 (ZIF-8) and Amox@Zn(1,4-benzenedicarboxylate) (ZnBDC) to demonstrate the degradation of Amox upon contact with the Zn-containing frameworks. We propose a possible pathway for the degradation of Amox involving the cleavage of the four-membered β-lactam ring. These Zn-containing frameworks provide a biocompatible platform for the degradation in solution of Amox, which should also be suitable to degrade other β-lactam antibiotics.
Keywords:β-lactamase activity, gentamicin, β-lactam catalysis, penicilloic and penilloic
acids, biocompatible frameworks
Introduction
In the last decade, antibiotics have emerged as novel environmental pollutants. The widespread use of antibiotics in human and veterinary medicine, animal husbandry, plant production and aquaculture has led to high consumption and the gradual accumulation of antibiotics in the environment (e.g., wastewater, landfills, industrial and hospital effluents).1-6 From 100,000 to 200,000 t of antibiotics are consumed per year in hospitals, homes, veterinary use and aquaculture throughout the world.7 On average, high-income countries generate ca. 0.5 kg of hazardous waste per bed per day whereas low-income countries generate ca. 0.2 kg. Furthermore, low-income countries do not separate hospital waste into hazardous or non-hazardous wastes, making the real quantity of
hazardous waste much higher, as reported by the World Health Organization (WHO).
the environment.4,17,18 The reactive properties of antibiotic-derived metabolites are largely unknown, as well as the environmental impact of these compounds. Therefore, there is an urgent demand for the development of novel and efficient techniques to minimize water contamination by antibiotics.
Among the most efficient methods to remove pharmaceuticals in wastewater are carbon-activated adsorption-filtration,19,20 Fenton oxidation21,22 and photocatalytic degradation.23,24 However, these methods have some major drawbacks. The physical process using activated carbon and membrane filtration is limited to the transfer of antibiotics from one phase to another without dealing with its chemical degradation. Advanced oxidation technologies such as Fenton oxidation and photocatalytic degradation are often used for amoxicillin (Amox) degradation. However, a major problem of the process of the Fenton oxidation are the large volumes of iron sludge generated in the process, causing other environmental problems.21,25 Photocatalytic degradation has high operational cost and the photocatalytic reactions are generally slow compared to the rates of conventional chemical reactions, making it difficult to treat large volumes of wastewater.26,27 Therefore, new technologies are needed that can effectively remove antibiotics from the aquatic environment.
Metal-organic frameworks (MOFs) are infinite crystalline structures constructed by the self-assemblage of metal ions or clusters coordinated to multifunctional organic ligands. Depending on the resulting structure, the MOF skeleton can be flexible, combining a high cavity volume, regular crystallinity, and the presence of tunable organic groups within the framework.28 These properties provide more active adsorption sites and reaction centers29 required for chemical degradation. Furthermore, MOFs can exhibit high biocompatibility and low toxicity depending on the choice of organic linkers and metal constituents. Several novel MOFs have also been developed for increased water stability.30 Some of these frameworks can endure water immersion for long periods of time in pH ranging from 0 to 12.31 Therefore, MOFs have lately emerged as promising candidates for the treatment of wastewater.32
Amox is a stable acid, semi-synthetic drug within the penicillin class of β-lactam antibiotics widely used in both human and veterinary medicine to treat infections caused by Gram-positive or Gram-negative bacteria.33 Amox is chemically described as (2S,5R,6R)-6-[[(2R)-2-amino- 2-(4-hydroxyphenyl)acetyl]amino]-3,3-dimethyl-7-oxo-4-thia-1-azabicyclo[3.2.0]heptane-2-carboxylic acid.
Due to high consumption and continuous discharge, Amox has been detected in environmental samples at
concentrations ranging between µg L-1-ng L-1.6,34 It has been further shown that subinhibitory concentrations of Amox can induce bacterial resistance in Escherichia coli, Listeria monocytogenes, Pseudomonas aeruginosa and Salmonella enterica.9 The biorefractory nature of Amox limits its effective removal in urban wastewater treatment plants through conventional treatment processes.35,36 Hence, the use of alternative treatment techniques resting upon the degradation of Amox into non-toxic intermediates is highly desirable. Several investigations have been reported in the literature using MOFs as agents for the degradation of Amox.37-39
In this report we describe the adsorption and degradation of Amox by the Zn-containing frameworks zeolitic imidazolate framework-8 (ZIF-8) and Zn(1,4-benzenedicarboxylate) (ZnBDC). We have initially performed molecular docking calculations to estimate the binding affinity40 of Amox for ZIF-8 and ZnBDC. We have further used gentamicin (Gen) as a negative control since our computational calculations predicted that this antibiotic does not bind to the ZIF-8 and ZnBDC frameworks. The computationally predicted adsorption of Amox, but not Gen, to ZIF-8 and ZnBDC was confirmed by the means of Fourier transform infrared (FTIR) and UV-Vis spectroscopies, thermogravimetric analysis (TGA), X-ray diffraction (XRD) and scanning electron microscopy (SEM) measurements. We have further performed mass spectrometry (MS) analysis of Amox@ZIF-8 and Amox@ZnBDC to demonstrate the degradation of Amox upon contact with the Zn-containing frameworks. Gen does not undergo any chemical transformation in presence of either ZIF-8 or ZnBDC. We assert that the Zn metal catalyzes the degradation of the beta-lactam ring in Amox, and propose a possible pathway for its degradation involving the cleavage of the four-membered β-lactam ring. Therefore, these Zn-containing frameworks provide a biocompatible platform for the degradation in solution of β-lactam antibiotics (e.g., penicillins, cephalosporins, cephamycins, carbapenems and monobactams), the most successful class of antibiotics developed so far.41
Experimental
Experimental procedure
(Aldrich), KOH (Cinética), methanol (Dinâmica), formic acid (Vetec). ZIF-8 was acquired from Aldrich under the commercial name Basolite™ Z1200. The material was used without previous treatment. The procedure for the synthesis of the ZnBDC used in this work was developed in our group using previously published procedures.42,43 In a typical synthesis 0.056 g Na2BDC and 0.148 g Zn(NO3)2.6H2O were dissolved in 4 mL of water. The reactant mixture was placed in a 10 mL vessel, sealed and placed in a microwave oven (Discover, CEM) at 120 oC for 10 min, using a maximum power of 60 W. The solid result was filtered, washed with water and acetone to remove excess reactants, and finally dried in vacuum.
Diffractograms were recorded at room temperature in the range of 5 to 50o in a Rigaku 2400 DMAX XRD
with Cu Kα (0.15 nm). TGA was performed in a
Shimadzu DTG-60H instrument in the range from room temperature to 800 oC using an alumina crucible with about 8.0 mg of sample, under dynamic nitrogen atmosphere (50 mL min-1) and with a heating rate of 10 oC min-1. The vibrational spectra in the infrared region (IR) were obtained Bruker IFS 66v/S FTIR spectrometer in the range of 4000-400 cm-1. For SEM the samples were prepared on carbon tape on an aluminum support and coated with a 10-20 nm gold film, using a Bal-Tec SCD 050 sputter coater. Images were recorded by an SEM (Jeol JSM-5900) operating at a voltage of 15 kV, a 4.0 probe and a working distance of 18 to 24 nm. The electrospray ionization mass spectrometry (ESI(+)-MS) were obtained using Micromass MS, in which samples were diluted in a solution of methanol and water (1:1) with 0.1% formic acid and analyzed by direct infusion; the flow used ranged from 10 to 30 µL min-1, in positive mode. The spray voltage, temperature, capillary voltage and other parameters were adjusted according to the sample in order to obtain a maximal response, using nitrogen as the drying gas. The acquisition of the MS was carried out 60 s after insertion. The spectra were acquired in the range 50-1000 m/z. In the experiments MS/MS, an ion of interest was selected and fragmented. The electronic absorption spectra in the UV and Vis regions of the obtained supernatants were performed for each system in a PerkinElmer Lambda 650 spectrophotometer, using deuterium and halogen lamps, scanning from 200 to 600 nm.
Drug loading was performed under stirring for 1, 3 and 7 days of 100 mg of the framework (ZIF-8 or ZnBDC) in 10 mL aqueous solution containing 300 mg of drug (Amox or Gen) as described by Horcajada et al.44 To the solution containing Amox it was added 1 mL of KOH (1 mol L-1) for the solubilization of the drug. After the incorporation period, the suspensions containing drug and MOF were subjected to the centrifugation process and drying under vacuum.
Computational details
Atomic coordinates for the ZnBDC and ZIF-8 frameworks were taken from the Cambridge Structural Database (CSD1821299 and CSD602542, respectively). Molecular docking calculations were performed using the AutoDock 445-48 software combined with the AutoDock Tools.49 Partial charges for the receptor atoms were assigned according to AMBER86 force field parameters,50 while ligand charges were calculated with the Gasteiger method.51 Dihedral angles were treated as fully flexible for ligands. Grid resolution and center were adjusted to each one of the systems. Grid maps of 126 × 126 × 126 points with point spacing of 1 Å were centered at the ZnBDC and ZIF-8 structures. The Lamarckian genetic algorithm (LGA) was used with the following parameters: 150 random individuals in an initial population, a maximum number of 2,500,000 energy evaluations, a maximum number of 27,000 generations with mutation and crossover rates of 0.02 and 0.08, respectively. An optional elitism parameter equal to 1 was applied, determining the number of top individuals that will survive into the next generation. A maximum of 300 iterations per local search was allowed. The probability of performing a local search on an individual was 0.06 where the maximum number of consecutive successes or failures before doubling or halving the search step was 4. A total of 100 LGA runs were performed. After the conformational search, docked conformations were sorted in the order of increasing energy. The coordinates of the lowest energy conformation were clustered based on a root-mean-squared-deviation (RMSD) of 2.0 Å.46-48 A more detailed description of the methodology employed has been previously presented.52,53 Coordinates and trajectories were visualized with the software VMD version 1.9.1.54 The atomic coordinates for Amox and Gen were built and the geometry optimized with the software MarvinSketch 5.3.1.55
Results and Discussion
been incorporated in the materials. In order to further investigate these findings, the drug-MOF systems were characterized by XRD (Figures S2-S7, SI section), SEM (Figure S8, SI section), TGA (Figures S9-S12, SI section), FTIR spectroscopy (Figures S13-S16, SI section), UV-Vis spectroscopy and MS. The supernatant was analyzed by MS and UV-Vis spectroscopy.
Molecular docking calculations
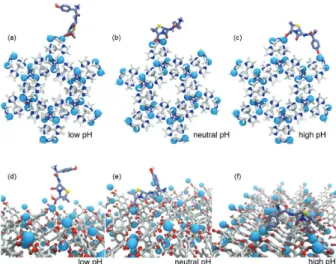
Molecular docking calculations were carried out to estimate the binding conformation and binding affinity of Amox and Gen onto the ZnBDC and ZIF-8 frameworks in different media (acidic or basic) conditions.28 Drug molecules were docked onto the framework structures and the lowest energy conformer was selected for each of the compounds tested (Figure 1). The lowest energy conformer is defined as the conformation of the ligand with the most favorable interaction energy as given by an empirical energy function48 and selected out of ca. 106 sampled conformations.47,52,53,56 Ideally, the lowest energy conformers should also belong to the most populated conformational cluster. This was the case for Amox based on an RMSD of 1.0 Å.
Amox adsorbs to both frameworks through electrostatic interactions between its carboxylate groups and the Zn2+ metals in the material surface (Figure 1). Depending on the protonation state of Amox, additional interactions with the Zn2+ metal are observed. Amox binds to the ZIF-8 and ZnBDC frameworks in a similar fashion under acidic and
basic conditions (Figure 1). In basic medium, Amox binds to the framework surface by bridging two different Zn2+ atoms via electrostatic interactions to the thiazolidinic carboxylate and the deprotonated hydroxyl group (Figure 1). In acidic medium, Amox binds to a single Zn2+ atom through to the thiazolidinic carboxylate. In neutral conditions, Amox binds to two Zn2+ atoms via the thiazolidinic carboxylate and the β-lactam carbonyl groups in the case of ZIF-8, whereas in the ZnBDC it also binds to two Zn2+ atoms, but this time via the thiazolidinic carboxylate and the carbonyl from the acetoamido group (Figure 1). Based on the MS measurements for both systems (see below), both binding modes at neutral conditions allow the degradation of the antibiotic by the frameworks. The lowest energy Amox conformer in basic medium represents 99% (ZIF-8) or 98% (ZnBDC) of the sampled conformations, whereas in neutral medium, it corresponds to 75% (ZIF-8) and 82% (ZnBDC), and at acidic medium, 65% (ZIF-8) and 78% (ZnBDC). These are merely a theoretical extrapolation since both frameworks are unstable in extreme media conditions. Estimated Amox binding affinity constants from the molecular docking calculations range between 10-3 to 10-4 mol L-1 for ZIF-8, and 10-7 mol L-1 or higher for ZnBDC. Although these values should not be taken with caution due to the simplified potential energy function used in the molecular docking approach, it suggests that Amox adsorbs more strongly to ZnBDC than to ZIF-8.
Molecular docking calculations for Gen onto the ZnBDC and ZIF-8 frameworks did not result in any adsorbed conformation. Estimated affinity constants for this drug had positive values, indicative of unfavorable binding to both frameworks. These findings are consistent with the XRD and TGA measurements as discussed below.
X-Ray powder diffraction
Powder XRD was performed in order to examine the samples’ crystallographic phases qualitatively, as well as to evaluate possible alterations in the MOF structures after being exposed to the drugs. XRD patterns for Amox and Gen are presented in Figures S2 and S3 (SI section). The ZnBDC framework kept the same crystal structure before and after contact with the Gen solution for a time period of up to 7 days (Figure S4, SI section).28,57 Conversely, the XRD patterns for ZIF-8 before and after contact with Gen shows alterations (Figure S5, SI section), which may indicate drug adsorption to the framework (see further discussion of the TGA data below). The XRD patterns of the frameworks present thin peaks, indicating high crystallinity and in good agreement with previous studies reported in the literature.58,59 Conversely, the diffractograms obtained for ZnBDC show significant changes in peak Figure 1. Lowest energy conformers of Amox bound to (a-c) ZIF-8 and
positions and relative intensities upon suspension in Amox solution for 1, 3 and 7 days (Figure S6, SI section). The XRD patterns for ZIF-8 show the same crystal structure after contact with Amox solution after 1, 3 and 7 days (Figure S7, SI section), pointing to change in the crystal structure of ZnBDC and ZIF-8 due to reaction with Amox. It has been previously shown by Rietveld refinement that ZnBDC exhibits one single phase before or after suspension in Gen solution, whereas it exhibits two or more crystal phases when suspended in Amox solution.28
Scanning electron microscopy
The morphology of the samples were evaluated qualitatively by SEM (Figure S8, SI section). The micrograph of ZnBDC shows crystals in small and large clusters with well-defined shapes and slightly deformed surfaces. The micrograph of commercial ZIF-8 shows crystalline particles in the nanometric regime, possibly due to fast nucleation during synthesis.60 Gen forms spherical particles of ca. 10 µm, whereas Amox forms spicules, some with large and elongated shapes and irregular length. The findings for Amox are in line with previous studies in the literature.61,62
Thermogravimetric analysis
The stability and thermal decomposition of the samples were evaluated by TGA in the presence and absence of the drugs (Figures S9-S12, SI section). The thermoanalytical profile of ZnBDC displays two steps. The first, in the region of 150 oC, can be interpreted as the loss of coordination water representing 14% of the total mass. The next step, between 350 and 550 oC, corresponds to the thermal decomposition of the organic ligand and loss of 56% of the total mass. Similar results are reported in the literatrure.42 The thermoanalytical profile of ZIF-8 displays two events in the range of 350 to 750 oC, which can be interpreted as mass loss of the imidazolate linker, which represents 70% of the total mass. The remaining mass corresponds to the compound ZnC, yielded after the loss of organic ligand. Similar results were previously reported by Ordoñez et al.60 The thermoanalytical profile of Gen shows loss of hydration water at about 100 oC, which corresponds to 10% of the total mass. The remaining mass corresponds to the decomposition of the Gen skeleton. The thermoanalytical profiles for Gen in the presence of ZnBDC exhibited a similar thermal behavior to that of the pure framework. The TGA profiles for ZIF-8 after suspension in the Gen solution feature loss of mass from both drug and framework (Figures S9-S12, SI section). These data indicate the drug adsorbs to the framework.
The thermoanalytical profile of Amox shows a loss of hydration water at the temperature range of 65 to 130 oC,
which corresponds to a loss of 12% of the total mass. Additionally, three consecutive events are observed: the first event takes place in the range of 160 to 210 oC, with mass loss of 11%; the second event occurs in the interval of 211 to 320 oC, with mass loss of 26%; and the last one is observed in the range of 370 to 700 oC, which corresponds to 51% of total mass. These events can be interpreted as the decomposition of Amox, leading to the complete degradation of sample. The thermal analysis curve for the mixture Amox and ZnBDC shows four mass loss events whose profile is similar to the pure Amox thermal profile; likewise for the mixture Amox and ZIF-8. The first event is related to the loss of hydration water molecules trapped in the compound. The second event is attributed to the loss of the Amox and their degradation products. The third and fourth decomposition events correspond to the simultaneous thermal decomposition of Amox, their degradation products and ZnBDC, followed by carbonization of the material. In addition, the thermal stability of all samples was analyzed by comparing the 5% (T5) and 10% (T10) weight loss temperature of the samples (Table S1, SI section). In addition, residual mass at 700 oC is also reported.
Infrared spectroscopy
FTIR spectra were obtained for ZnBDC and ZIF-8 before and after suspension in solutions of Gen and Amox for 1, 3 and 7 days (Figures S13-S16, SI section). The spectrum for ZnBDC exhibits one band centered at 3249 cm-1 attributed to O–H stretching due to water coordination. The strong absorption band at 1576 cm-1 is attributed to C=O stretching, which is displaced due to coordination with the metallic center. The FTIR spectrum for ZIF-8 exhibits small absorption bands at 3131 and 2923 cm-1 related to the aromatic C–H stretching and the aliphatic C–H stretching in the imidazole, respectively. The band at 1605 cm-1 corresponds to the C=C stretching. The axial deformation of the C=N band occurs at 1576 cm-1, and the axial deformation of the C–N at 1145 cm-1. The absorption band at 421 cm-1 is associated with the stretching of the coordination Zn–N. Similar results are reported by Ordoñez et al.60 For Gen there is a band between 3500 to 3250 cm-1 which corresponds to O–H stretching. In this interval, it is superposed to the band corresponding
to N–H stretching. The bands at 1054 and 1112 cm-1
high due to the change in Amox molecular dipole moment produced by this mode of vibration64,65 at 1776 cm-1. The absorption at 1686 cm-1 is attributed to the C=O carbonyl group attached to the amide group. At 1483 cm-1 there is an overlay attributed to N–C stretch and angular deformation for the amide group. The FTIR spectra for ZnBDC and ZIF-8 in the presence of Gen do not exhibit significant changes during the period of 1, 3 and 7 days. On the other hand, both frameworks exhibit remarkable changes after suspension in the Amox solution. The FTIR spectrum for ZnBDC in the presence of Amox presents changes in chemical bonds. The characteristic vibrational modes related to asymmetric and symmetric C=O stretching in the ZnBDC framework occur at 1576 and 1366 cm-1, respectively (Figure S13, SI section).43 In the presence of Amox, the two main vibrational peaks (1576 and 1145 cm-1) seen in the FTIR spectrum of ZIF-8 are no longer observed (Figure S16, SI section). The main peaks of the spectra for all samples is presented in Table S2 (SI section). It is most likely that these peaks underwent a shift and superposition with the bands associated with the Amox spectrum. The characteristic peak corresponding
to C=O stretching in the β-lactam ring of Amox at
1776 cm-1 is no longer observed in these spectra. The bands corresponding to the N–H stretching, amide C=O, carbonyl groups and aromatic rings in the interval 3500 to 2600 cm-1 and to the C=C stretching at 1615 cm-1 can still be observed in the FTIR spectra. The intensity decrease or disappearance of these peaks indicates that Amox may undergo degradation in the presence of the frameworks (see discussion of the MS data).
UV-Vis spectroscopy
Absorption spectra in the UV-Vis region were obtained to investigate if Amox underwent degradation upon contact with the frameworks. The UV-Vis spectra were measured for the pure Amox as well as its mixtures with ZnBDC or ZIF-8 in the period of 1, 2 and 3 days (Figures 2 and 3). The absorption spectrum for the pure Amox solution exhibits an electronic absorption band around 230 and 272 nm.66,67 The band at 272 nm was used as reference to assure the structural conservation of Amox due to the higher sensitivity. Upon contact with the ZnBDC and ZIF-8 frameworks, the absorption band shifts ca. 80 nm, i.e., from 272 to 350 nm. The intensity ratio between the reference (272 nm) and the new band (350 nm) is significantly higher for ZIF-8 than for ZnBDC. The new adsorption band appears after 1 and 3 days in the presence of ZnBDC and ZIF-8, respectively. Therefore, the UV-Vis spectra show that Amox undergoes chemical degradation upon adsorption to the two Zn-containing frameworks.
Mass spectrometry
MS was used to detect the occurrence of degradation and detection of the resulting products in the supernatant and in the resulting solid after contact between frameworks and drugs.
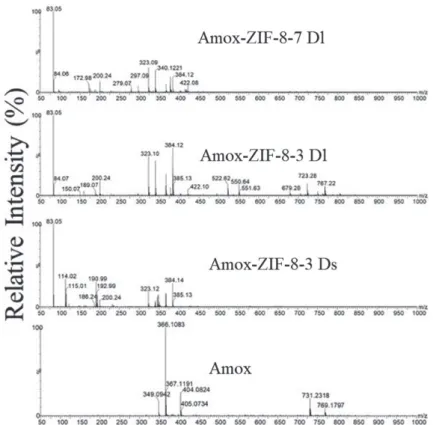
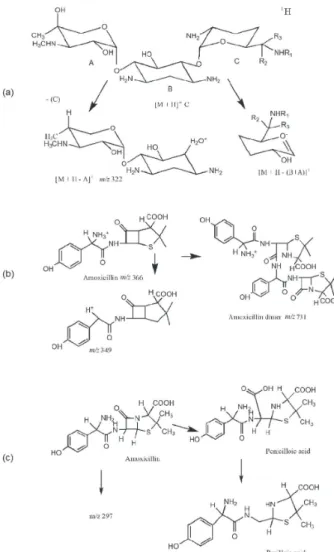
The Amox MS revealed the presence of a peak corresponding to Amox at m/z 366 and its isotope at m/z 367 (Figure 4). A potassium adduct at m/z 404 and a fragment generated by the loss of ammonia at m/z 349 were also observed.68 These assignments are consistent with MS measurements from Nägele and Moritz.69 The Amox dimer at m/z 731 with its respective isotope at m/z 732, and potassium adduct of these two peaks at m/z 769 and 770 can also be observed in this spectrum. Similar behavior has been previously reported in literature.70
The MS for the solid phase of the sample containing Amox and frameworks shows the characteristic peak of Figure 2. UV-Vis spectra of pure Amox and mixed with ZnBDC for 1,
3 and 7 days.
Amox at m/z 366 (Figures 4 and 5). This peak is visible during the first 3 days of evaluation, disappearing after 7 days. The peak at m/z 384 is attributed to penicilloic acid, and is present at 3 and 7 days (Figures 4 and 5).70,71
The penicilloic acid is the degradation product formed by the opening of the β-lactam ring.70,71 The peak at m/z 340 is attributed to the decarboxilation of the penicilloic acid, denominated peniloic acid.69,72 The same Amox degradation
Figure 4. ESI(+)-MS of Amox and Amox-ZIF-8 (solid phase (Ds) and liquid (Dl)) at 3 and 7 days.
products observed for the solid phase of the samples of the frameworks are observed for the supernatant (Figure 6). The MS of the solid and supernatant samples exhibit a peak at m/z 297, which has not been previously identified as a degradation product of Amox in the absence of the frameworks (Figures 4 and 5). Its intensity increases with time, but the chemical structure of the compound associated with the peak at m/z 297 could not be determined at this point.
The MS data indicates that Gen does not undergo any chemical transformation in the presence of either ZIF-8 or ZnBDC (Figure 6). The MS for Gen do not exhibit any significant modification for the samples containing only Gen or Gen in the presence of the frameworks (whether ZIF-8 or ZnBDC). The MS measurements for the solid phase of the samples containing only the frameworks do not show any indication of fragmentation of Gen, suggesting that this drug does not adsorb to these frameworks (Figures S17 and S18, SI section). MS measurements for ZnBDC and ZIF-8 are presented in Figure S19 (SI section).
Conclusions
The findings reported here are consistent with the degradation of Amox by both ZnBDC and ZIF-8 frameworks. The degradation of Amox upon contact with the two MOFs is attributed to the presence of zinc ions, which is the catalytic agent in mono- and binuclear metallo-β-lactamases.73 Indeed, Zn2+ in this important class of enzymes is often tetracoordinated with imidazolate rings from histidine residues acting as ligands. These results are consistent with previous studies reporting on the role of Zn2+-containing materials in the degradation of antibiotics (Amox, ampicillin, penicillin-G, and penicillin-V) in aqueous solution and natural light exposure.74 These results evidence MOFs ZnBDC and ZIF-8 as new materials for Amox degradation. The products formed after degradation by the Zn-containing frameworks were penicilloic and penilloic acids, which are non-toxic.
Supplementary Information
Supplementary information is available free of charge at http://jbcs.sbq.org.br as PDF file.
Acknowledgments
The Brazilian funding agencies CNPq, CAPES and FACEPE are acknowledged for providing financial support under grants Pronex APQ-0675-1.06/14, INCT-NANOMARCS, Pronem APQ-0732-1.06/14 and BioMol/ CAPES (BioComp 23038.004630/2014-35).
References
1. Batt, A. L.; Kim, S.; Aga, D. S.; Chemosphere 2007, 68, 428. 2. Brown, K. D.; Kulis, J.; Thomson, B.; Chapman, T. H.;
Mawhinney, D. B.; Sci. Total Environ. 2006, 366, 772. 3. Karthikeyan, K. G.; Meyer, M. T.; Sci. Total Environ. 2006,
361, 196.
4. Manzetti, S.; Ghisi, R.; Mar. Pollut. Bull. 2014, 79, 7.
5. Renew, J. E.; Huang, C.; J. Chromatogr. A 2004, 1042, 113. 6. Watkinson, A. J.; Murby, E. J.; Kolpin, D. W.; Costanzo, S. D.;
Sci. Total Environ. 2009, 407, 2711.
7. Wise, R.; J. Antimicrob. Chemother. 2002, 49, 585.
8. Rizzo, L.; Manaia, C.; Merlin, C.; Schwartz, T.; Dagot, C.; Ploy, M. C.; Michael, I.; Fatta-Kassinos, D.; Sci. Total Environ. 2013,
447, 345.
9. Andersson, D. I.; Hughes, D.; Nat. Rev. Microbiol. 2014, 12,
465.
10. Gozlan, I.; Rotstein, A.; Avisar, D.; Chemosphere 2013, 91,
985.
Figure 6. Fragmentation of (a) Gen and (b) Amox, and (c) degradation
11. Baquero, F.; Martínez, J. L.; Cantón, R.; Curr. Opin. Biotechnol.
2008, 19, 260.
12. Fram, M. S.; Belitz, K.; Sci. Total Environ. 2011, 409, 3409. 13. Jiang, L.; Hu, X.; Xu, T.; Zhang, H.; Sheng, D.; Yin, D.; Sci.
Total Environ. 2013, 458-460, 267.
14. Khan, G. A.; Berglund, B.; Khan, K. M.; Lindgren, P. E.; Fick, J.; PLoS One 2013, 8, 4.
15. Kümmerer, K.; Chemosphere 2009, 75, 417.
16. Tuc, D. Q.; Elodie, M. G.; Pierre, L.; Fabrice, A.; Marie-Jeanne, T.; Martine, B.; Joelle, E.; Marc, C.; Sci. Total Environ. 2016,
575, 758.
17. García-Galán, M. J.; Díaz-Cruz, M. S.; Barceló, D.; TrAC, Trends Anal. Chem. 2008, 27, 1008.
18. Kennedy, K. A.; Rockwell, S.; Sartorelli, A. C.; Cancer Res.
1980, 40, 2356.
19. Choi, K. J.; Kim, S. G.; Kim, S. H.; J. Hazard. Mater. 2008,
151, 38.
20. Putra, E. K.; Pranowo, R.; Sunarso, J.; Indraswati, N.; Ismadji, S.; Water Res. 2009, 43, 2419.
21. Zha, S.; Cheng, Y.; Gao, Y.; Chen, Z.; Megharaj, M.; Naidu, R.; Chem. Eng. J. 2014, 255, 141.
22. Elmolla, E. S.; Chaudhuri, M.; J. Hazard. Mater. 2009, 172,
1476.
23. Klauson, D.; Babkina, J.; Stepanova, K.; Krichevskaya, M.; Preis, S.; Catal. Today 2010, 151, 39.
24. Dimitrakopoulou, D.; Rethemiotaki, I.; Frontistis, Z.; Xekoukoulotakis, N. P.; Venieri, D.; Mantzavinos, D.; J. Environ. Manage. 2012, 98, 168.
25. Weng, X.; Sun, Q.; Lin, S.; Chen, Z.; Megharaj, M.; Naidu, R.; Chemosphere 2014, 103, 80.
26. Guo, W.; Wu, Q.-L.; Zhou, X.-J.; Cao, H.-O.; Du, J.-S.; Yin, R.-L.; Ren, N.-Q.; RSC Adv. 2015, 5, 52695.
27. Dong, H.; Zeng, G.; Tang, L.; Fan, C.; Zhang, C.; He, X.; He, Y.; Water Res. 2015, 79, 128.
28. Rodrigues, M. O.; de Paula, M. V.; Wanderley, K. A.; Vasconcelos, I. B.; Alves, S.; Soares, T. A.; Int. J. Quantum Chem. 2012, 112, 3346.
29. Wang, H.; Yuan, X.; Wu, Y.; Zeng, G.; Chen, X.; Leng, L.; Li, H.; Appl. Catal., B 2015, 174-175, 445.
30. Wang, C.; Liu, X.; Demir, N. K.; Chen, J. P.; Li, K.; Chem. Soc. Rev. 2016, 45, 5107.
31. Wang, K.; Huang, H.; Xue, W.; Liu, D.; Zhao, X.; Yuanlong, X.; Li, Z.; Qingyuan, Y.; Wang, L.; Zhong, C.; CrystEngComm
2015, 17, 3586.
32. Dias, E. M.; Petit, C.; J. Mater. Chem. A 2015, 3, 22484. 33. Gozlan, I.; Rotstein, A.; Avisar, D.; Environ. Chem. 2010, 7, 435.
34. Locatelli, M. A. F.; Sodré, F. F.; Jardim, W. F.; Arch. Environ. Contam. Toxicol. 2011, 60, 385.
35. Pérez-Parada, A.; Agüera, A.; Gómez-Ramos, M. D. M.; García-Reyes, J. F.; Heinzen, H.; Fernández-Alba, A. R.; Rapid Commun. Mass Spectrom. 2011, 25, 731.
36. Gómez-Ramos, M. D. M.; Pérez-Parada, A.; García-Reyes, J. F.; Fernández-Alba, A. R.; Agüera, A.; J. Chromatogr. A
2011, 1218, 8002.
37. Yang, C.; You, X.; Cheng, J.; Zheng, H.; Chen, Y.; Appl. Catal., B 2017, 200, 673.
38. Abazari, R.; Mahjoub, A. R.; Ultrason. Sonochem. 2018, 42,
577.
39. Abazari, R.; Reza Mahjoub, A.; Slawin, A. M. Z.; Carpenter-Warren, C. L.; Ultrason. Sonochem. 2018, 42, 594.
40. Li, Q.; Zhang, W.; Miljanić, O. Š.; Sue, C. H.; Zhao, Y. L.; Liu, L.; Knobler, C. B.; Stoddart, J. F.; Yaghi, O. M.; Science 2009, 325, 855.
41. Lewis, K.; Nat. Rev. Drug Discovery 2013, 12, 371.
42. Wanderley, K. A.; Alves Jr., S.; Paiva-Santos, C. O.; Quim. Nova
2011, 34, 434.
43. Zhu, L. N.; Zhang, L. Z.; Wang, W. Z.; Liao, D. Z.; Cheng, P.; Jiang, Z. H.; Yan, S. P.; Inorg. Chem. Commun. 2002, 5, 1017. 44. Horcajada, P.; Serre, C.; Maurin, G.; Ramsahye, N. A; Balas,
F.; Vallet-Regí, M.; Sebban, M.; Taulelle, F.; Férey, G.; J. Am. Chem. Soc. 2008, 130, 6774.
45. Goodford, P. J.; J. Med. Chem. 1985, 28, 849.
46. Morris, G. M.; Goodsell, D. S.; Halliday, R. S.; Huey, R.; Hart, W. E.; Belew, R. K.; Olson, A. J.; J. Comput. Chem. 1998, 19, 1639.
47. Morris, G. M.; Huey, R.; Lindstrom, W.; Sanner, M. F.; Belew, R. K.; Goodsell, D. S.; Olson, A. J.; J. Comput. Chem. 2009,
30, 2785.
48. Huey, R.; Morris, G. M.; Olson, A. J.; Goodsell, D. S.; J. Comput. Chem. 2007, 28, 1145.
49. Sanner, M. F.; J. Mol. Graphics Modell. 1999, 17, 57.
50. Weiner, S. J.; Kollman, P. A.; Nguyen, D. T.; Case, D. A.; J. Comput. Chem. 1986, 7, 230.
51. Gasteiger, J.; Marsili, M.; Tetrahedron 1980, 36, 3219. 52. Soares, T. A.; Goodsell, D. S.; Ferreira, R.; Olson, A. J.; Briggs,
J. M.; J. Mol. Recognit. 2000, 13, 146.
53. Soares, T. A.; Goodsell, D. S.; Briggs, J. M.; Ferreira, R.; Olson, A. J.; Biopolymers 1999, 50, 319.
54. Humphrey, W.; Dalke, A.; Schulten, K.; J. Mol. Graphics 1996,
14, 33.
55. MarvinSketch 5.3.1; ChemAxon, 2014. Available at http://www. chemaxon.com, accessed in April 2018.
56. Soares, T. A.; Lins, R. D.; Straatsma, T. P.; Briggs, J. M.; Biopolymers 2002, 65, 313.
57. Vasconcelos, I. B.; Silva, T. G.; Militão, G. C. G.; Soares, T. A.; Rodrigues, N. M.; Rodrigues, M. O.; Costa Jr., N. B.; Freire, R. O.; Junior, S. A.; RSC Adv. 2012, 2, 9437.
58. Park, K. S.; Ni, Z.; Côté, A. P.; Choi, J. Y.; Huang, R.; Uribe-Romo, F. J.; Chae, H. K.; O’Keeffe, M.; Yaghi, O. M.; Proc. Natl. Acad. Sci. U. S. A. 2006, 103, 10186.
59. Pan, Y.; Liu, Y.; Zeng, G.; Zhao, L.; Lai, Z.; Chem. Commun.
60. Ordoñez, M. J. C.; Balkus, K. J.; Ferraris, J. P.; Musselman, I. H.; J. Membr. Sci. 2010, 361, 28.
61. Montes, A.; Tenorio, A.; Gordillo, M. D.; Pereyra, C.; Martínez de la Ossa, E. J.; J. Supercrit. Fluids 2010, 51, 399.
62. Feng, S.; Shan, N.; Carpenter, K. J.; Org. Process Res. Dev.
2006, 10, 1212.
63. Nurkeeva, Z. S.; Khutoryanskiy, V. V.; Mun, G. A.; Sherbakova, M. V.; Ivaschenko, A. T.; Aitkhozhina, N. A.; Eur. J. Pharm. Biopharm. 2004, 57, 245.
64. Swaminathan, J.; Ramalingam, M.; Sethuraman, V.; Sundaraganesan, N.; Sebastian, S.; Kurt, M.; Spectrochim. Acta, Part A 2010, 75, 183.
65. Bebu, A.; Szabó, L.; Leopold, N.; Berindean, C.; David, L.; J. Mol. Struct. 2011, 993, 52.
66. Vallet-Regí, M.; Doadrio, J. C.; Doadrio, A. L.; Izquierdo-Barba, I.; Pérez-Pariente, J.; Solid State Ionics 2004, 172, 435.
67. Andreozzi, R.; Canterino, M.; Marotta, R.; Paxeus, N.; J. Hazard. Mater. 2005, 122, 243.
68. Lu, C. Y.; Feng, C. H.; J. Sep. Sci. 2007, 30, 329.
69. Nägele, E.; Moritz, R.; J. Am. Soc. Mass Spectrom. 2005, 16,
1670.
70. Valvo, L.; Ciranni, E.; Alimenti, R.; Alimonti, S.; Draisci, R.; Giannetti, L.; Lucentini, L.; J. Chromatogr. A 1998, 797, 311. 71. Magureanu, M.; Piroi, D.; Mandache, N. B.; David, V.;
Medvedovici, A; Bradu, C.; Parvulescu, V. I.; Water Res. 2011, 45, 3407.
72. Trovó, A. G.; Pupo Nogueira, R. F.; Agüera, A.; Fernandez-Alba, A. R.; Malato, S.; Water Res. 2011, 45, 1394.
73. Tamilselvi, A.; Mugesh, G.; J. Biol. Inorg. Chem. 2008, 13, 1039.
74. Navarro, P. G.; Hernández Blázquez, I.; Quintero Osso, B.; Martínez De Las Parras, P. J.; Martínez Puentedura, M. I.; Márquez García, A. A.; Int. J. Biol. Macromol. 2003, 33, 159.
Submitted: January 29, 2018
Published online: April 26, 2018