CAMPOLINA AG ETAL.
234 REV ASSOC MED BRAS 2018; 64(3):234-242
ORIGINAL ARTICLE
Quality of life in a sample of Brazilian adults using the generic
SF-12 questionnaire
ALESSANDRO GONÇALVES CAMPOLINA1* , ROSSANA VERONICA MENDOZA LOPEZ1, ELENE PALTRINIERI NARDI2, MARCOS BOSI FERRAZ2
1Center for Translational Research in Oncology – Instituto do Câncer do Estado de São Paulo, Faculdade de Medicina, Universidade de São Paulo, São Paulo, SP, Brazil 2Division of Health Economics and Healthcare Management, Escola Paulista de Medicina, Universidade Federal de São Paulo, São Paulo, SP, Brazil
S
UMMARYStudy conducted at Universidade Federal de São Paulo (Unifesp),
São Paulo, SP, Brazil
Article received: 6/26/2017
Accepted for publication: 7/16/2017
*Correspondence:
Address: Av. Dr. Arnaldo, 251, 8o andar
São Paulo, SP – Brasil
Postal code: 01246-000 [email protected]
http://dx.doi.org/10.1590/1806-9282.64.03.234
Objective: This study describes the summary scores of the Short Form-12
(SF-12) questionnaire, according to socio-demographic factors obtained in a probabilistic and representative sample of the Brazilian urban population. Method: Five thousand (5,000) individuals, over the age of 15, were assessed in 16 capital cities, in the five regions of the country. The selection of households was random. Face-to-face approach was applied in the household interviews. The SF-12 questionnaire was used to assess quality of life. Demographic and socioeconomic characteristics were also evaluated: gender, age, marital status, skin color, region of the country and use of the public health service.
Results: The mean value (SD) of the SF-12 for the entire population was 49.3 (8.7) for the physical component (PCS-12) and 52.7 (9.7) for the mental component (MCS-12). Statistical differences were found for gender (PCS-12 and MCS-12), age (PCS-12) and working status (PCS-12 and MCS-12). Women, elderly, widowed and unemployed individuals, those with lower income and with complaints in the last seven days showed lower mean values (PCS-12 and MCS-12).
Conclusion: From this point forward, we can provide the basis for comparisons with future research that use the SF-12 for quality of life assessment in Brazil. The Brazilian population has a lower degree of quality of life related do the physical component, and the SF-12 is a useful and discriminative instrument for assessing quality of life in different socio-demographic groups.
Keywords: Quality of Life. Surveys and Questionnaires. Brazil. Health Surveys. Socioeconomic Factors.
I
NTRODUCTIONOver the past years, there has been an increased recogni-tion of the patient’s point of view as an important com-ponent in the assessment of health care outcomes. There is now a general consensus that the health of a population cannot be well characterized based on the analysis of mortality and morbidity statistics alone and that there is also a need to view health in terms of people’s assess-ment of their sense of well-being.1
Such acknowledgment has led to the concept of Health-Related Quality of Life (HRQoL), defined as an individual’s perception of their life position in the context of the culture and value systems in which they live and in relation to their goals, expectations, standards and concerns.2 Therefore,
an array of scores representing individual dimensions or
domains of HRQoL can be provided by health profiles (or health status questionnaires). The rationale is that since such questionnaires focus on those aspects of existence that are affected by ill health, they may give some indication of the impact of illness on quality of life.2-4
One of the most widely used and psychometrically sound instruments is the Medical Outcomes Study 36-item Short Form (SF-36). This relatively brief and simple questionnaire contains 36 items covering eight health concepts chosen on the basis of reliability, validity and frequency of measurement in health surveys.5 Two
sum-mary scores have also been developed for the SF-36. The reliability and validity of the SF-36 have been well docu-mented by the developers of the instrument.4-7 As a
QUALITYOFLIFEINASAMPLEOF BRAZILIANADULTSUSINGTHEGENERIC SF-12 QUESTIONNAIRE
REV ASSOC MED BRAS 2018; 64(3):234-242 235
of types and severities of health conditions and can be used to compare patients who have different conditions or to compare patients with the general population.5,6
In order to provide a shorter more user-friendly al-ternative to the SF-36, the Short-Form 12 health survey (SF-12) was purposely designed for large-scale measure-ments for which the SF-36 was too lengthy.7 The SF-12
measures physical and mental health by means of two summary scores; a physical component summary (PCS-12) and mental component summary (MCS-(PCS-12). The SF-12 can be employed in multiple ways, i.e., SF-12 is often used to compare health status between two groups of patients, to identify predictors of health status, and to determine health status in a specific population.7
In Brazil, although some studies have already pro-vided the assessment scores of the SF-12 in regional populations or certain diseases,8-14 a comprehensive and
representative assessment of the Brazilian population is still lacking. Therefore, the objective of this article was to present the descriptive measures of the summary measures composing the SF-12, according to socio-demographic factors obtained in a probabilistic and representative sample of Brazilian urban population.
M
ETHODThis study was part of the Brazilian Copcord Study (BRAZCO), a cross-sectional population-based study conducted between April and May 2013.15-17 We surveyed
5,000 participants over the age of 15 from 16 capitals in the five regions of Brazil: North (Belém, Manaus), North-east (Fortaleza, João Pessoa, Maceió, Natal, Recife and Salvador), Southeast (Belo Horizonte, Rio de Janeiro and São Paulo), South (Curitiba, Florianópolis and Porto Alegre) and Midwest (Brasília and Goiânia).
The sample was comprised of representative quotas of the Brazilian population, proportional to the popula-tion densities of the capitals in each region of the country, based on the Census conducted in 2010 by the Brazilian Institute of Geography and Statistics (IBGE – Instituto Brasileiro de Geografia e Estatística). The quotas of gen-der and age in each capital were based on the Census, and participants of all socioeconomic statuses, educational levels and occupations were included.
The households were randomly selected, with a sys-tematic selection of streets and subjects by randomly choos-ing the census tract with a quota control for the season-ality factor. Regarding the list of households, one household was evaluated per street, with a total of up to ten households in the sector. If an entire sector was covered but not enough households were found to complete the required number,
the process was carried out again in the sector, beginning in the first street, five houses after the house where the first interview took place. In each household, up to three visits were made on different days and at different times. In cases where the interview was not carried out after these three attempts, the household was replaced by another in the same Census sector. If the resident of the selected house-hold could not be interviewed, that househouse-hold was replaced by another in the same Census sector, seeking to ensure a respondent within the same gender and age group.
A success rate of 70% was established, so 42.9% more households than planned were randomly selected to en-sure substitution. Ineligible households, such as collective households (vacant households, hotels, lodges, nursing homes etc.), agricultural, educational and healthcare es-tablishments, and buildings under construction, were replaced by another household in the same Census sector. The maximum sampling error was ±1.39% for the country as a whole, with a 95% confidence level.
Residents who did not speak Portuguese and people with a cognitive disability, thus incapable of reliably and consistently answering the questionnaire, were excluded. Because of the small proportion of people living in rural areas (15.6%) and the difficulty in accessing this scattered population, only households in urban areas were considered. The survey instrument was a household questionnaire conducted face-to-face by a specialized team, consisting of open and closed-ended questions about socioeconom-ic and demographsocioeconom-ic aspects. Ethnsocioeconom-ic group was declared by the respondents themselves (white, black, yellow, brown, or indigenous). Family income was expressed as multiples of minimum wages, where the values of the Brazilian minimum wage, originally in reais (Brazilian currency), were converted to United States dollar (US$) according to the exchange rate in 2013 using data from the Institute of Applied Economic Research (Ipea – Instituto de Pes-quisa Econômica Aplicada).
For the proposed analysis, a translated and validated version for the Portuguese language of SF-12 question-naire was used.18 The SF-12 is a self-reported generic
HRQoL measure consisting of 12 questions that can be scored to provide a physical component summary (PCS-12) score and a mental component summary (MCS-(PCS-12) score.7,19 The SF-12 PCS and MCS scores have been
de-veloped to produce a mean of 50 and a standard deviation of 10 in the adult US population.7,19
CAMPOLINA AG ETAL.
236 REV ASSOC MED BRAS 2018; 64(3):234-242
SPSS for Windows version 20.0 (IBM-SPSS, Chicago, IL) was used for statistical analysis. The variables were descriptively analyzed and data were presented as mean, standard deviation, percentage and confidence intervals for means. Student’s t-test and ANOVA were used to eval-uate scale scores composing the SF-12, according to socio-demographic factors of the Brazilian urban population. The probability level was set at a p<0.05.
All subjects were informed about the study and agreed to participate by signing a written free and informed consent form. The research protocol was examined and approved by the Ethics and Research Committee of Unifesp/EPM (Nº 2013/473524).
R
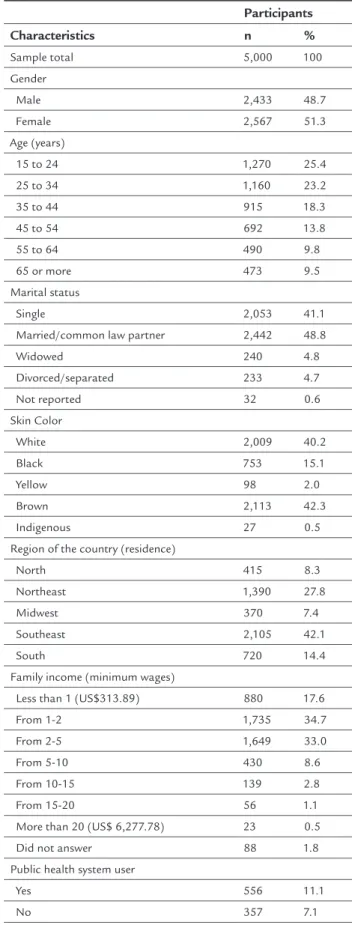
ESULTSTable 1 presents the main demographics and socioeco-nomic characteristics of the surveyed population. A total of 5,000 participants from 16 capitals in five Brazilian geographic regions were surveyed. Most of them from the southeast region (42.1%), 51.3% were women, 32% were married, 48.6% were between 15 and 34 years old, and 52.3% had a family income of up to two minimum wages (US$627.78) (Table 1).
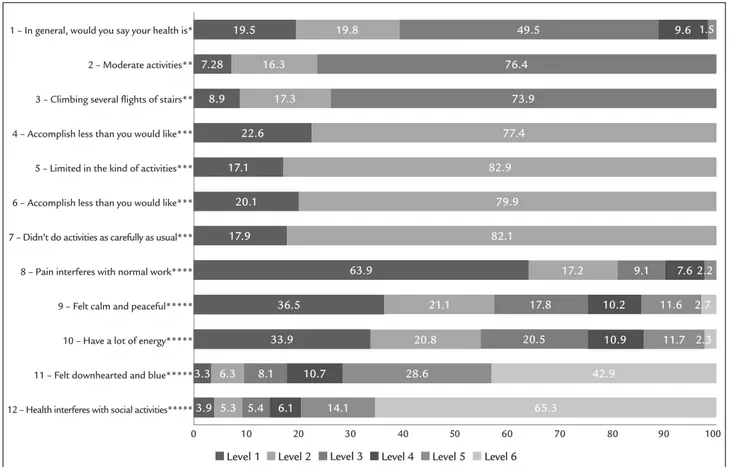
Figure 1 shows the distribution of the SF-12 respons-es for each of the 12 qurespons-estions. It was observed that all possible answers were potentially used. Almost half of the respondents considered their health as good (49.52%).
In regard to physical component, most respondents declared that they had no difficulties in performing moder-ate activities or climbing stairs and no difficulties in perform-ing daily activities or labor tasks because of physical health. In regard to mental component, most respondents did not accomplish less work because of emotional problems, had no pain that interfered with their normal work, felt calm and peaceful all the time or most of the time and had a lot of energy all the time or most of the time. In addition, most respondents said they did not feel downhearted or blue at all, or felt this way in a few occasions (42.90%) in recent weeks and that emotional problems do not interfere with their social activities (65.28%).
The mean (SD), minimum and maximum values of the SF-12 scores are shown in Table 2. The mean SF-12 scores (SD) for the entire population was 49.3 (8.7) for PCS-12 and 52.7 (9.7) for MCS-12. According to socio-demographic factors, there were statistical differences for all research variables (PCS-12 and MCS-12), except for skin color (MCS-12). Furthermore, women, elderly and widowed individuals, those unemployed and people with lower in-come and with complaints in the last seven days showed lower mean values to PCS-12 and MCS-12.
TABLE 1 Demographic and socioeconomic characteristics of a Brazilian urban population sample.
Participants
Characteristics n %
Sample total 5,000 100
Gender
Male 2,433 48.7
Female 2,567 51.3
Age (years)
15 to 24 1,270 25.4
25 to 34 1,160 23.2
35 to 44 915 18.3
45 to 54 692 13.8
55 to 64 490 9.8
65 or more 473 9.5
Marital status
Single 2,053 41.1
Married/common law partner 2,442 48.8
Widowed 240 4.8
Divorced/separated 233 4.7
Not reported 32 0.6
Skin Color
White 2,009 40.2
Black 753 15.1
Yellow 98 2.0
Brown 2,113 42.3
Indigenous 27 0.5
Region of the country (residence)
North 415 8.3
Northeast 1,390 27.8
Midwest 370 7.4
Southeast 2,105 42.1
South 720 14.4
Family income (minimum wages)
Less than 1 (US$313.89) 880 17.6
From 1-2 1,735 34.7
From 2-5 1,649 33.0
From 5-10 430 8.6
From 10-15 139 2.8
From 15-20 56 1.1
More than 20 (US$ 6,277.78) 23 0.5
Did not answer 88 1.8
Public health system user
Yes 556 11.1
Q
U
AL
IT
Y
O
F
LIF
E
IN
A
SA
M
PL
E
O
F
B
R
AZ
IL
IA
N
AD
U
LT
S
U
SIN
G
TH
E
G
EN
ER
IC
S
F-1
2
Q
U
ES
TIO
N
N
AIR
E
R
EV
A
SS
O
C
M
ED
B
R
AS
2
0
1
8
; 6
4
(3
):2
3
4
-2
4
2
2
3
7
TABLE 2 Scores assessed by the SF-12 in the Brazilian population according to gender, age, marital status, regions, skin color, working status, family income and incidence of complaints.
PCS-12* MCS-12**
Characteristics N Mean SD Minimum Maximum CI p-value Mean SD Minimum Maximum CI p-value
Sample total 4,990 49.3 8.7 13.7 65.4 49.1-49.6 52.7 9.7 14.7 68.3 52.4-52.9
Gender
Male 2,429 50.7 7.8 18.3 63.6 50.4-51.1 <0.01 54.7 8.2 18.1 67.7 54.4-55.0 <0.01
Female 2,561 48.0 9.4 13.7 65.4 47.6-48.4 50.7 10.5 14.7 68.3 50.3-51.1
Age (years)
15 to 24 1,269 52.7 5.5 22.9 65.4 52.4-53.1 <0.01 54.4 8.1 18.9 67.7 54.0- 54.9 <0.01
25 to 34 1,158 51.0 7.0 20.8 62.2 50.6-51.4 53.0 9.2 18.1 67.4 52.4-53.5
35 to 44 913 49.5 8.4 19.2 62.4 49.0-50.1 52.6 9.9 17.8 68.3 51.9-53.2
45 to 54 690 47.0 10.0 13.7 62.8 46.2-47.7 51.2 10.4 16.3 64.6 50.4-52.0
55 to 64 489 44.5 10.5 17.4 61.2 43.6-45.5 50.6 11.0 14.7 65.3 49.7-51.6
65 or more 471 44.0 10.7 14.2 60.2 43.1-45.0 51.5 10.5 18.9 67.4 50.6-52.5
Marital status
Single 2,049 51.4 7.3 13.7 65.4 51.1-51.7 <0.01 53.6 9.1 14.7 67.7 53.2-54.0 <0.01
Married 1,629 48.1 9.0 18.8 62.5 47.6-48.5 52.6 9.5 20.7 67.4 52.1-53.0
Common law partner 809 49.1 8.7 18.3 63.7 48.5-49.7 52.2 10.0 16.3 68.3 51.5-52.9
Widowed 239 43.4 11.4 14.2 61.9 42.0-44.9 49.5 11.4 18.9 67.2 48.0-50.9
Divorced / separated 232 46.8 10.1 19.5 62.8 45.5-48.1 50.2 11.1 17.8 64.6 48.8-51.7
Not reported 32 49.8 8.2 24.3 57.9 46.8-52.7 54.5 9.4 24.1 63.1 51.1-57.9
Region of the country (residence)
North 414 49.0 7.8 18.3 60.4 48.2-49.7 <0.01 53.6 8.8 20.0 68.3 52.8-54.5 <0.01
Northeast 1,389 48.8 9.2 17.4 63.6 48.3-49.3 52.5 9.7 17.8 67.4 52.0-53.0
Midwest 368 49.5 8.7 19.1 62.1 48.6-50.4 50.4 9.7 21.3 64.1 49.4-51.4
Southeast 2,100 49.5 8.7 13.7 65.4 49.1-49.8 52.4 9.9 14.7 67.4 52.0-52.8
South 719 50.2 8.3 14.2 62.8 49.6-50.8 54.3 8.9 18.1 64.6 53.7-55.0
C
AM
PO
LIN
A
A
G
ET
AL
.
2
3
8
R
EV
A
SS
O
C
M
ED
B
R
AS
2
0
1
8
; 6
4
(3
):2
3
4
-2
4
2
TABLE 2 (Cont.) Scores assessed by the SF-12 in the Brazilian population according to gender, age, marital status, regions, skin color, working status, family income and incidence of complaints.
PCS-12* MCS-12**
Characteristics N Mean SD Minimum Maximum CI p-value Mean SD Minimum Maximum CI p-value
Skin color
White 2,007 49.7 8.5 14.2 65.4 49.4-50.1 0.01 52.7 9.6 16.3 67.4 52.3-53.1 0.69
Black 749 49.6 8.6 13.7 61.1 48.9-50.2 53.0 9.4 19.4 65.8 52.3-53.7
Yellow 98 50.2 8.0 23.8 59.7 48.6-51.8 51.9 10.5 21.0 64.1 49.8-54.0
Brown 2,109 48.9 9.0 17.5 63.7 48.5-49.3 52.6 9.7 14.7 68.3 52.2-53.0
Indigenous 27 47.9 10.3 22.8 57.8 43.8-51.9 49.5 12.7 20.8 60.8 44.5-54.5
Working status
Working 2,389 50.4 7.7 19.1 62.8 50.1-50.7 <0.01 53.9 8.6 16.3 67.2 53.6-54.3 <0.01
Not working 2,601 48.4 9.5 13.7 65.4 48.0-48.8 51.5 10.4 14.7 68.3 51.1-51.9
Family income (minimum wages)
Less than 1*** 879 48.0 9.6 13.7 65.4 47.4-48.7 <0.01 51.3 10.8 19.4 68.3 50.6-52.1 0.02
From 1-2 1,729 48.6 9.1 14.2 62.8 48.2-49.1 52.5 9.7 14.7 67.4 52.0-52.9
From 2-5 1,647 49.8 8.3 18.3 62.5 49.4-50.2 52.8 9.4 18.1 67.2 52.3-53.3
From 5-10 429 51.1 7.1 22.6 63.6 50.5-51.8 53.8 8.9 18.9 64.1 53.0-54.7
From 10-15 139 51.1 6.9 29.0 61.2 49.9-52.3 54.1 8.2 22.9 64.3 52.7-55.5
From 15-20 56 51.5 8.2 24.9 60.0 49.3-53.7 54.9 7.5 29.2 65.5 52.9-56.9
More than 20**** 23 52.1 6.3 36.5 56.6 49.4-54.8 53.9 7.4 38.7 60.8 50.7-57.1
Not reported 88 53.7 5.9 24.9 61.1 52.4-54.9 57.9 6.1 24.2 67.7 56.6-59.2
Incidence of complaints
In the last 7 days 761 44.4 9.4 18.8 61.6 43.8-45.1 <0.01 48.3 10.6 18.6 65.8 47.5-49.0 <0.01
In the past 871 50.6 6.9 20.7 63.7 50.2-51.1 53.7 8.5 19.6 67.2 53.1-54.3
In the last 7 days and in the past 855 40.5 10.4 13.7 62.5 39.8-41.2 47.0 11.6 14.7 67.2 46.2-47.8
No complaints 2,503 53.4 4.6 20.8 65.4 53.2-53.6 55.6 7.4 17.8 68.3 55.3-55.9
*Physical component summary of the SF-12. **Mental component summary of the SF-12. ***Less than 1 = US$313.89.
****More than 20 = US$6,277.78.
QUALITYOFLIFEINASAMPLEOF BRAZILIANADULTSUSINGTHEGENERIC SF-12 QUESTIONNAIRE
REV ASSOC MED BRAS 2018; 64(3):234-242 239
FIGURE 1 Frequency distribution of responses in the 12 items of the SF-12 (%). *1) Excellent; 2) Very good; 3) Good; 4) Fair; 5) Poor.
**1) Yes, limited a lot; 2) Yes, limited a little; 3) No, not limited at all. ***1) Yes; 2) No.
****1) Not at all; 2) A little bit; 3) Moderately; 4) Quite a bit; 5) Extremely.
*****1) All of the time; 2) Most of the time; 3) Good bit of the time; 4) Some of the time; 5) A little of the time; 6) None of the time.
D
ISCUSSIONOur study provides the mean values for the two sum-mary scores of the SF-12, according to different socio-demographic factors, in the Brazilian population. Brazil is a country of continental dimensions with socioeco-nomic differences in their various regions and therefore the importance of an assessment that is representative of the different regions of the country.
The use of a quality-of-life measure to describe the health of a population makes it possible to identify the most compromised dimensions of well-being and to establish health policies.5,20 Measures that offer normalized scores,
such as the SF-12, also enable a direct comparison of the results to a reference population, allowing losses in quality of life to be interpreted in terms of deviations from normality.21-23 Scores can be understood as
separa-tion from expected or typical scores. So, norm-based interpretation answers the questions of whether or not an observed score is typical: Is the score expected for this individual or group of individuals? In the present study,
the assessment of the quality of life in a sample of the Brazilian population can be directly compared to that of the population of the United States, where the SF-12 was validated.19
The SF-12 values observed in our study are relatively low for the physical component and high for the mental component, namely 49.3 (8.7) for PCS-12 and 52.7 (9.7) for MCS-12 in the general Brazilian population. Similar to our results, the SF-36 version 2 normative data for Brazil, the study by Laguardia et al.24 found the value of
49.3 (95CI 49.1-49.5) for physical scores (PCS) and 51.1 (95CI 50.9-51.3) for mental scores (MCS), but in another study evaluating specifically the SF-12 scores in 2,459 people of working age in the state of Minas Gerais, city of Montes Claros, the scores found were 49.6 (9.0) and 51.9 (8.6), respectively.9 In another study, in the city of
Belo Horizonte, the final score for the physical component of the SF-12 varied from 20.5 to 64.9, with a median of 50.56. The final score for the mental component varied from 11.0 to 65.5, with a median of 48.43.11
1 – In general, would you say your health is*
2 – Moderate activities**
3 – Climbing several flights of stairs**
4 – Accomplish less than you would like***
5 – Limited in the kind of activities***
6 – Accomplish less than you would like***
7 – Didn’t do activities as carefully as usual***
8 – Pain interferes with normal work****
9 – Felt calm and peaceful*****
10 – Have a lot of energy*****
11 – Felt downhearted and blue*****
12 – Health interferes with social activities*****
0 10 20 30 40 50 60 70 80 90 100
19.5
63.9
36.5
33.9 7.28
8.9
22.6
17.1
20.1
17.9 16.3
17.2
21.1
20.8
17.8
20.5
10.2
10.9
11.6
11.7
3.3
3.9 6.3
5.3 8.1
5.4
10.7
6.1
28.6
14.1
42.9
65.3
9.1 7.6
17.3
77.4
82.9
79.9
82.1 76.4
73.9
19.8 49.5 9.6
Level 1 Level 2 Level 3 Level 4 Level 5 Level 6
1.5
2.2
2.7
CAMPOLINA AG ETAL.
240 REV ASSOC MED BRAS 2018; 64(3):234-242
The distribution of the SF-12 responses as presented in Figure 1 shows that there was little impairment of the items evaluated, and for the questions about moderate activities, climb flights, accomplished less (physical), lim-ited in kind of work and accomplished less (emotional), the frequency of individuals without impairment was greater than 70%. In other Brazilian studies, similar results were observed.9-12,14
The summary measures reveal a lower quality of life related to physical component among Brazilians. Some studies have shown that low socioeconomic development can lead to lower expectations in relation to health, caus-ing individuals to assess their quality of life with values higher than expected. This effect has been noted mainly in males, so that different values assigned to the body, the pressing need of work, can be observed.25,26 Thus, the
ob-served values may be overestimated in relation to the US population, where the best socioeconomic status cannot exert the same influence as in Brazil.
We note that there is proportionality between the gen-ders, with a slightly higher number of females, and, con-sistent with other studies, the female gender had worse quality of life scores than males.27-29 The SF-12 scores were
similar to another Brazilian study: self-perception of physical and mental health among women studied showed a mean score of 47.6 (SD = 8.9) and 43.6 (SD = 11.8), re-spectively.14 The scientific literature has demonstrated that,
although women have a longer life expectancy, they have shorter periods than males in which they are free of dis-abilities, which suggests a gender difference in terms of compromised quality of life. The factors commonly ad-dressed to explain the poorer quality of life among wom-en are related to gwom-ender differwom-ences in social opportunities and higher mortality rates among men at younger ages.29,30
A different distribution of chronic diseases and func-tional capacity by gender may also influence these differ-ences between men and women. In a population-based study conducted in Brazil to evaluate the quality of life of seniors based on the SF-36, women were in a worse situation than men in all SF-36 scales. According to the authors, the fact that women exhibit a worse self-assessed level of health may be attributed to the greater perception and knowledge that they have regarding diseases and symptoms, consider-ing their role as family health caregivers, which makes women dedicate more attention to the signs of diseases.26
The summary scores systematically fall according to age, which also occurs in the population of other coun-tries.21-23,31,32 PCS-12 was more influenced by advances in
age. This suggests that losses related to normal ageing may be more related to the physical component, which
under-goes inexorable transformations over time.28 In Brazil, the
assessment of primary health care received by the elderly and health-related quality of life, based on SF-12 scores, showed a PCS 38.1 ± 11.6 and a MCS 48.7 ± 10.4.8
Com-promised mental health, on the other hand, is more re-lated to health complications, which become more preva-lent in old age, compared with age per se, as demonstrated in previous studies carried out in Brazil.13,29,33
Another important factor is the employment status, because, according to the results found, being employed gives a better perception of quality of life compared to the group of inactive individuals. This was also observed in Portugal.34 Although being employed is a positive
impact factor on assessment, if a person has health prob-lems that prevent him/her from performing their jobs, there is strong impairment of the perceived quality of life. This was observed in a study of health-related qual-ity of life and working conditions on public transport workers in the Metropolitan Region of Belo Horizonte, Brazil. Using the SF-12, the mean values and 95% confi-dence intervals for the physical scores (PCS) and mental scores (MCS) for the whole sample were 39.90 (95CI 34.27-45.53) and 34.70 (95CI 23.41-45.99), respectively.10
Family income had an influence over the physical com-ponent. The economic factor has been addressed in a num-ber of studies that compare the expectation of a healthy life in populations from regions with different socioeconomic levels.35-37 The influence of income on health and well-being
is well-known and our data underscore the importance of this aspect in a large country with striking social dispar-ity, such as Brazil. In this sense, studies conducted in Brazil showed that the higher the presence of low income and lower educational levels, the worse the quality of life.25-27
QUALITYOFLIFEINASAMPLEOF BRAZILIANADULTSUSINGTHEGENERIC SF-12 QUESTIONNAIRE
REV ASSOC MED BRAS 2018; 64(3):234-242 241
be interpreted with caution, concerning the influence of socio-demographic factors on quality of life.
Although the SF-12 method was developed in an-other culture, the use of this tool in our environment facilitates the comparison of quality of life of the Brazil-ian population with other international studies using the same measures. In addition, the norm-based score allows for an interpretation of population data as deviations of normality and they have the advantage of a direct inter-pretation in this regard, which facilitates decision-making. The major contribution of this study is that, up to now, this is the first study assessing a large and represen-tative sample of the Brazilian population in the various regions and subpopulations, and from this point forward, we can provide the basis for comparisons with future research that use this measure for quality of life assess-ment in Brazil.
C
ONCLUSIONThe Brazilian population has a lower degree of quality of life related do the physical component, and the SF-12 is a useful and discriminative instrument for assessing health-related quality of life in different socio-demographic groups.
R
ESUMOQualidade de vida em uma amostra de adultos brasileiros utilizando o questionário genérico SF-12
Objetivo: Este estudo descreve os escores sumários do questionário Short Form-12 (SF-12), de acordo com os fatores sociodemográficos obtidos em uma amostra pro-babilística e representativa da população urbana brasileira. Método: Cinco mil (5.000) indivíduos, com idade superior a 15 anos, foram avaliados nas cinco regiões do país, em 16 capitais. A seleção dos domicílios foi aleatória. A coleta de dados foi realizada através de entrevistas domiciliares. O questionário SF-12 foi utilizado para a avaliação de quali-dade de vida. Características demográficas e socioeconô-micas também foram avaliadas: sexo, idade, estado civil, cor da pele, região do país e uso do serviço público de saúde.
Resultados: O valor médio (DP) do SF-12 para a
popu-lação total foi de 49,3 (8,7) para o componente físico (PCS-12) e 52,7 (9,7) para o componente mental (MCS-12). Foram encontradas diferenças estatísticas para sexo (PCS-12 e MCS-(PCS-12), idade (PCS-(PCS-12) e estado laboral (PCS-(PCS-12 e MCS-12). Mulheres, idosos, viúvos, indivíduos que não estavam trabalhando, pessoas com menor renda e queixas nos últimos sete dias apresentaram valores médios mais baixos (PCS-12 e MCS-12).
Conclusão: Os resultados apresentados fornecem bases
populacionais para comparações com pesquisas futuras que utilizem o SF-12 para a avaliação da qualidade de vida no Brasil. A população brasileira tem um menor grau de quali-dade de vida relacionada ao componente físico, e o SF-12 é um instrumento útil e discriminativo para a avaliação de qualidade de vida em diferentes grupos sociodemográficos.
Palavras-chave: Qualidade de Vida. Inquéritos e
Ques-tionários. Brasil. Inquéritos Epidemiológicos. Fatores Socioeconômicos.
R
EFERENCES1. Walton MK, Powers JH 3rd, Hobart J, Patrick D, Marquis P, Vamvakas S, et al; International Society for Pharmacoeconomics and Outcomes Research Task Force for Clinical Outcomes Assessment. Clinical Outcome Assessments: Conceptual Foundation-Report of the ISPOR Clinical Outcomes Assessment - Emerging Good Practices for Outcomes Research Task Force. Value Health.
2015;18(6):741-52.
2. The World Health Organization Quality of Life Assessment (WHOQOL): development and general psychometric properties. Soc Sci Med. 1998;46(12):1569-85.
3. Leplège A, Hunt S. The problem of quality of life in medicine. JAMA. 1997;278(1):47-50.
4. Coons SJ, Rao S, Keininger DL, Hays RD. A comparative review of generic quality-of-life instruments. Pharmacoeconomics. 2000;17(1):13-35. 5. Campolina AG, Ciconelli RM. SF-36 and the development of new assessment
tools for quality of life. Acta Reumatol Port. 2008;33(2):127-33. 6. Ciconelli RM, Ferraz MB, Santos W, Meinão I, Quaresma MR. Tradução para
a língua portuguesa e validação do questionário genérico de avaliação de qualidade de vida SF-36 (Brasil SF-36). Rev Bras Reumatol. 1999;39(3):143-50. 7. Ware Jr JE, Kosinski M, Keller SD. SF-12: how to score the SF-12 physical and mental health summary scales. Boston: QualityMetric Inc.; Health Assessment Lab; 2002.
8. Carvalho VCHS, Rossato SL, Fuchs FD, Harzheim E, Fuchs SC. Assessment of primary health care received by the elderly and health related quality of life: a cross-sectional study. BMC Public Health. 2013;13:605.
9. Silveira MF, Almeida JC, Freire RS, Haikal DS, Martins AE. Psychometric properties of the quality of life assessment instrument: 12-item health survey (SF-12). Cien Saude Colet. 2013;18(7):1923-31.
10. Silva LS, Assunção AÁ. Health-related quality of life and working conditions on public transport workers in the Metropolitan Region of Belo Horizonte, Brazil, 2012. J Occup Health. 2015;57(1):39-50.
11. Silva LS, Barreto SM. Adverse psychosocial working conditions and poor quality of life among financial service employees in Brazil. J Occup Health. 2012;54(2):88-95.
12. Arenson-Pandikow HM, Oliveira LT, Bortolozzo CR, Petry S, Schuch TF. Perception of quality of life among anesthesiologists and non-anesthesiologists. Rev Bras Anestesiol. 2012;62(1):48-55.
13. Fleck MP, Lima AF, Louzada S, Schestasky G, Henriques A, Borges VR, et al. Association of depressive symptoms and social functioning in primary care service, Brazil. Rev Saude Publica. 2002;36(4):431-8.
14. Aquino NM, Sun SY, Oliveira EM, Martins MG, Silva JF, Mattar R. Sexual violence and its association with health self-perception among pregnant women. Rev Saude Publica. 2009;43(6):954-60.
15. Chopra A. The COPCORD world of musculoskeletal pain and arthritis. Rheumatology (Oxford). 2013;52(11):1925-8.
16. Senna ER, Barros AL, Silva EO, Costa IF, Pereira LV, Ciconelli RM, et al. Prevalence of rheumatic diseases in Brazil: a study using the COPCORD approach. J Rheumatol. 2004;31(3):594-7.
17. Riera R, Ciconelli RM, Ferraz MB. COPCORD studies. Acta Reumatol Port. 2006;31(2):119-23.
CAMPOLINA AG ETAL.
242 REV ASSOC MED BRAS 2018; 64(3):234-242
19. Ware J Jr, Kosinski M, Keller SD. A 12-Item Short-Form Health Survey: construction of scales and preliminary tests of reliability and validity. Med Care. 1996;34(3):220-33.
20. Makai P, Brouwer WB, Koopmanschap MA, Stolk EA, Nieboer AP. Quality of life instruments for economic evaluations in health and social care for older people: a systematic review. Soc Sci Med. 2014;102:83-93. 21. Mols F, Pelle AJ, Kupper N. Normative data of the SF-12 health survey with
validation using postmyocardial infarction patients in the Dutch population. Qual Life Res. 2009;18(4):403-14.
22. Ramírez-Vélez R, Agredo-Zuniga RA, Jerez-Valderrama AM. The reliability of preliminary normative values from the short form health survey (SF-12) questionnaire regarding Colombian adults. Rev Salud Publica (Bogota). 2010;12(5):807-19.
23. Schmidt S, Vilagut G, Garin O, Cunillera O, Tresserras R, Brugulat P, et al. Reference guidelines for the 12-Item Short-Form Health Survey version 2 based on the Catalan general population. Med Clin (Barc). 2012;139(14):613-25. 24. Laguardia J, Campos MR, Travassos C, Najar AL, Anjos LA, Vasconcellos
MM. Brazilian normative data for the Short Form 36 questionnaire, version 2. Rev Bras Epidemiol. 2013;16(4):889-97.
25. Alves LC, Rodrigues RN. Determinants of self-rated health among elderly persons in São Paulo, Brazil. Rev Panam Salud Publica. 2005;17(5-6):333-41. 26. Lima MG, Barros MB, César CL, Goldbaum M, Carandina L, Ciconelli RM. Health related quality of life among the elderly: a population-based study using SF-36 survey. Cad Saude Publica. 2009;25(10):2159-67.
27. Camargos MC, Perpétuo IH, Machado CJ. Life expectancy with functional disability in elderly persons in São Paulo, Brazil. Rev Panam Salud Publica. 2005;17(5-6):379-86.
28. Kaarlola A, Tallgren M, Pettila V. Long-term survival, quality of life, and quality-adjusted life-years among critically ill elderly patients. Crit Care Med. 2006;34(8):2120-6.
29. Campolina AG, Adami F, Santos JL, Lebrão ML. Effect of eliminating chronic diseases among elderly individuals. Rev Saude Publica. 2013;47(3):514-22. 30. Alexandre TS, Corona LP, Nunes DP, Santos JL, Duarte YA, Lebrão ML.
Gender differences in incidence and determinants of disability in activities of daily living among elderly individuals: SABE study. Arch Gerontol Geriatr. 2012;55(2):431-7.
31. Frieling MA, Davis WR, Chiang G. The SF-36v2 and SF-12v2 health surveys in New Zealand: norms, scoring coefficients and cross-country comparisons. Aust N Z J Public Health. 2013;37(1):24-31.
32. Vilagut G, Valderas JM, Ferrer M, Garin O, López-García E, Alonso J. Interpretation of SF-36 and SF-12 questionnaires in Spain: physical and mental components. Med Clin (Barc). 2008;130(19):726-35.
33. Alves LC, Leimann BCQ, Vasconcelos MEL, Carvalho MS, Vasconcelos AGG, Fonseca TCO, et al. The effect of chronic diseases on functional status of the elderly living in the city of São Paulo, Brazil. Cad Saude Publica. 2007;23(8):1924-30.
34. Ferreira LN, Ferreira PL, Pereira LN, Brazier J. An application of the SF-6D to create heath values in Portuguese working age adults. J Med Econ. 2008;11(2):215-33.
35. Gutiérrez-Fisac JL, Gispert R, Solà J. Factors explaining the geographical differences in Disability Free Life Expectancy in Spain. J Epidemiol Community Health. 2000;54(6):451-5.
36. Davis P, Graham P, Pearce N. Health expectancy in New Zealand, 1981-1991: social variations and trends in a period of rapid social and economic change. J Epidemiol Community Health. 1999;53(9):519-27.
37. Bronnum-Hansen H, Davidsen M. Social differences in the burden of long-standing illness in Denmark. Soz Praventivmed. 2006;51(4):221-31.