Frailty profile in Brazilian older adults:
ELSI-Brazil
Juliana Mara AndradeI,VI, Yeda Aparecida de Oliveira DuarteII, Luciana Correia AlvesIII, Flávia
Cristina Drumond AndradeIV, Paulo Roberto Borges de Souza JuniorV, Maria Fernanda
Lima-CostaI,VI, Fabíola Bof de AndradeI,VI
I Fundação Oswaldo Cruz. Instituto René Rachou. Programa de Pós-Graduação em Saúde Coletiva. Belo
Horizonte, MG, Brasil
II Universidade de São Paulo. Escola de Enfermagem. São Paulo, SP, Brasil
III Universidade Estadual de Campinas. Departamento de Demografia do Instituto de Filosofia e Ciências
Humanas. Campinas, SP, Brasil
IV University of Illinois at Urbana-Champaign. Kinesiology and Community Health. Champaign, IL, USA V Fundação Oswaldo Cruz. Instituto de Comunicação e Informação Científica e Tecnologia em Saúde. Rio de
Janeiro, RJ, Brasil
VI Fundação Oswaldo Cruz. Instituto René Rachou. Núcleo de Estudos em Saúde Pública e Envelhecimento. Belo
Horizonte, MG, Brasil
ABSTRACT
OBJECTIVE: To estimate the prevalence of frailty and to evaluate the associated factors in the non-institutionalized Brazilian population aged 50 years or older.
METHODS: The analyses were conducted in 8,556 participants of the baseline survey of the Longitudinal Study of Health of the Brazilian Elderly (ELSI-Brazil) conducted in 2015 and 2016. Frailty was defined based on five characteristics: weight loss, weakness, slowness, exhaustion and low level of physical activity. Participants with three or more characteristics were classified as frail. A Poisson regression model was used to examine the association between frailty and sociodemographic and health factors.
RESULTS: The prevalence of frailty was 9.0% (95%CI 8.0–10.1) among participants aged 50 years or over. Among the older adults aged 60 or over, the prevalence was 13.5% (95%CI 11.9–15.3) and 16.2% (95%CI 14.3–18.3) among those 65 aged years or over. Factors associated with higher prevalence of frailty were low schooling, residence without a partner, health conditions (poor self-rated health and two or more chronic diseases) and limitation to perform basic activities of daily living.
CONCLUSIONS: The prevalence of frailty among Brazilians aged 65 years or older is similar to their European counterparts. Poor health conditions, functional limitation and low schooling emerge as the factors most strongly associated with the frailty in this population.
DESCRIPTORS: Aged. Aging. Health Status. Socioeconomic Factors. Health Surveys.
Correspondence: Fabíola Bof de Andrade
Av. Augusto de Lima, 1715 Barro Preto 30190-002 Belo Horizonte, MG, Brasil Email: [email protected]
Received: Dec 13, 2017 Approved: May 18, 2018
How to cite: Andrade JM, Duarte YAO, Alves LC, Andrade FCD, Souza-Junior PRB, Lima-Costa MF, et al. Frailty profile in Brazilian older adults: ELSI-Brazil. Rev Saude Publica. 2018;52 Suppl 2:17s
Copyright: This is an open-access article distributed under the terms of the Creative Commons Attribution License, which permits unrestricted use, distribution, and reproduction in any medium, provided that the original author and source are credited.
INTRODUCTION
Frailty is characterized as an energy decline syndrome resulting from changes that occur due to aging. These changes predispose the elderly to a marked reduction in muscle mass and to a chronic inflammatory state, which, when associated with diseases, immobility or other extrinsic factors, results in a decrease in the energy reserve and an increase in physical vulnerability1. Different studies show that this syndrome is associated with advanced age1-4
and worse socioeconomic conditions, such as insufficient income and low educational levels1,5,6.Moreover, frailty is related to the presence of chronic diseases and disability, either
by predisposing to them or resulting from them1.
In Brazil, the aging process occurs under unfavorable economic, social and health conditions7. This scenario creates conditions conducive to the development of serious health complications as people age8. In the last decade, due to the rapid aging of the population
and the increase in the costs related to the health of the elderly, there has been an increase in scientific interest in the study of frailty4,9.
Population-based frailty studies in Brazil were conducted in cities previously selected as part of the Elderly Frailty (FIBRA) and the Health, Wellbeing and Aging (SABE)4,9 projects.
Therefore, there are no studies to establish a national estimate of the prevalence of frailty and the factors associated with this condition. These factors deserve to be evaluated by virtue of the different conditions in which people grow old in the country. In clinical practice, evaluating and identifying the frailty syndrome in the elderly can help prevent the progression of this syndrome and minimize its adverse consequences5,10.
Knowledge about the epidemiological profile of frailty will allow future assessments of the impact of services and policies for the prevention and control of this syndrome. Thus, the objective of the present study was to estimate the prevalence of frailty and to evaluate the factors associated with this condition in a national representative sample of the population aged 50 years or older.
METHODS
A cross-sectional study was conducted with data from the baseline of the Brazilian Longitudinal Study of Aging (ELSI-Brazil) conducted between 2015 and 2016. ELSI-Brazil is a prospective cohort study, conducted in a representative sample of the Brazilian population aged 50 years or older, living in 70 municipalities in the five major geographic regions of the country. This nationally representative sample used a multistate stratified cluster sampling design. All residents in the selected households, aged 50 years or older, were eligible for interviews, anthropometric evaluation, blood pressure measurements, and strength, balance and gait tests (n = 9,412). More details can be seen on the research websiteaand previously published11.
Study Variables
Dependent variable
Frailty was defined as the presence of three or more of the following components: weight loss, weakness, low gait speed, exhaustion and low level of physical activity1. In the present study, each of these components was defined according to the criteria presented in a previous publication12.
Weight loss was assessed by self-report of weight loss in the last three months. Weakness was measured by the force of the hand grip using a manual dynamometer on the dominant upper limb. Each participant was asked to apply the highest possible force in three attempts, considering the best performance. Weakness was defined by the strength of the hand grip in the lower quintile [after adjusting for gender and body mass index (BMI) quartiles], as well
a Fundação Oswaldo Cruz.
as the condition of being bedridden and the inability to perform the test. The gait speed was measured by a timer to record the time spent (in seconds) to walk three meters, considering the smallest measure between two measurements. Low gait speed was defined by the highest quintile of time, stratified according to gender and height, as well as the inability to perform the test13. Exhaustion was defined by responses to the following questions from
the Center for Epidemiological Studies’ (CES-D) depression questionnaire: “In the last week, how often did you feel that you could not carry things forward (started something but could not finish)?”; “In the last week, how often did your routine activities require a major effort to be completed?”. Exhaustion was attributed to those with frequencies greater than 3-4 days14. The physical activity score was calculated in metabolic equivalents per week
and expressed in kilocalorie (kcal) based on the Short Form of the International Physical Activity Questionnaire (IPAQ)15. The IPAQ questions seek to evaluate the time (minutes and hours) and the intensity (mild, moderate and vigorous) of physical activity practices performed during the last week, based on work activities, to get from one place to another, in leisure, as a sport, as an exercise or as part of household chores15. Individuals in the lower quintile of expenditure in weekly kcal, stratified by gender, were considered to have a low level of physical activity. In the present study, the dependent variable was categorized as frail (three or more components) and not frail (two or fewer components). More details can be seen in a previous publication12.
Covariates
The covariates of this study included sociodemographic characteristics (age, sex, years of schooling, marital status, and perception of income sufficiency for household expenses), health behaviors and conditions [current tobacco consumption, self-rated health, multimorbidity, and ability to perform basic activities of daily living (BADL)]. Current smoker status was attributed to those who reported smoking daily. Self-rated health was assessed by the standard question ”How would you judge the state of your general health?”. The respondents used a five-point scale to answer, which were categorized into three groupsgood or very good, regular and poor or very poor. Multimorbidity was defined as the presence of two or more chronic diseases (versus one or none) as previously proposed16,17. The number
of chronic diseases was defined by a history of medical diagnosis of the following diseases: hypertension, diabetes, heart disease, chronic lung disease, stroke, arthritis, asthma, cancer, and kidney disease. The variable functional disability was constructed by reporting any difficulty (unable, some or little) in performing one or more BADL, including bathing, dressing, feeding, using the toilet, getting out of bed, and crossing a room on the same floor18.
Statistical Analyzes
The analyses of the associations between the independent variables and the outcome variable were based on prevalence ratios and 95% confidence intervals estimated using the univariate and multivariate Poisson regression. All the independent variables were included simultaneously in the final multivariate model. A Venn diagram was developed to describe the concomitance between frailty, BADL limitations, and multimorbidity (two or more chronic diseases). In addition, imputation analysis was performed using the MICE (multiple imputation using chained equations) procedure. A total of 10 imputed datasets were created to assess the influence of missing data on the estimates of the final frailty prevalence.For the imputation, the following variables were considered: age, gender, marital status and perception of income sufficiency. The analyses were performed using the Stata 14.0 program (Stata Corp., College Station, USA), using the svy command, which allows us to consider the complex structure of the sample, including the assignment of sample weights.
Ethical Considerations
RESULTS
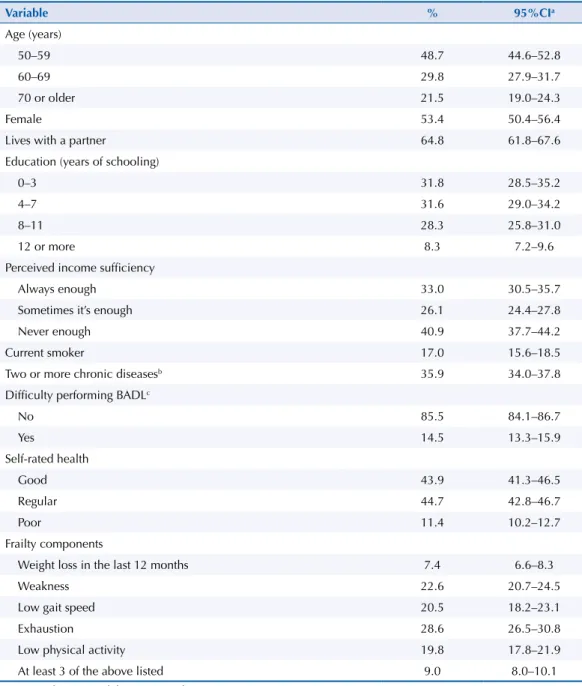
Among the 9,412 participants in the ELSI-Brazil baseline survey, 8,556 had complete information for all variables and were included in the present analysis. The average age of participants was 62.7 years (95%CI 61.9–63.5) and 53.4% were women. The prevalence of weight loss in the last three months, weakness, low gait speed, exhaustion and low level of physical activity were 7.4%, 22.6%, 20.5%, 28.6% and 19.8%, respectively. The overall prevalence of frailty was 9.0%. Other characteristics of study participants are shown in Table 1.
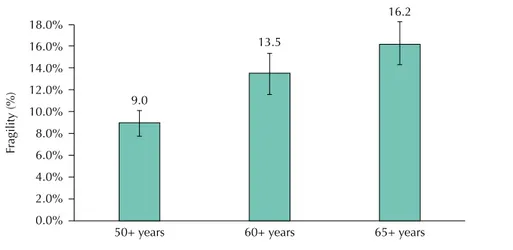
The prevalence of frailty gradually increased with age, from 9.0% (95%CI 8.0–10.1) in the age group of 50 years or older, to 13.5% (95%CI, 11.9–15, 3) in the age group of 60 years or older, and finally to 16.2% (95%CI 14.3–18.3) at age 65 or older (Figure 1).
The results of the unadjusted analysis (Table 2) show statistically significant associations between frailty and age, living with a partner, education, income sufficiency perception,
Table 1. Characteristics of study participants. The Brazilian Longitudinal Study of Aging (ELSI-Brazil), 2015-2016. (n = 8,556)
Variable % 95%CIa
Age (years)
50–59 48.7 44.6–52.8
60–69 29.8 27.9–31.7
70 or older 21.5 19.0–24.3
Female 53.4 50.4–56.4
Lives with a partner 64.8 61.8–67.6
Education (years of schooling)
0–3 31.8 28.5–35.2
4–7 31.6 29.0–34.2
8–11 28.3 25.8–31.0
12 or more 8.3 7.2–9.6
Perceived income sufficiency
Always enough 33.0 30.5–35.7
Sometimes it’s enough 26.1 24.4–27.8
Never enough 40.9 37.7–44.2
Current smoker 17.0 15.6–18.5
Two or more chronic diseasesb 35.9 34.0–37.8
Difficulty performing BADLc
No 85.5 84.1–86.7
Yes 14.5 13.3–15.9
Self-rated health
Good 43.9 41.3–46.5
Regular 44.7 42.8–46.7
Poor 11.4 10.2–12.7
Frailty components
Weight loss in the last 12 months 7.4 6.6–8.3
Weakness 22.6 20.7–24.5
Low gait speed 20.5 18.2–23.1
Exhaustion 28.6 26.5–30.8
Low physical activity 19.8 17.8–21.9
At least 3 of the above listed 9.0 8.0–10.1
a Estimated 95% confidence intervals.
b History of medical diagnosis of hypertension, diabetes, heart disease, chronic lung disease, stroke, arthritis,
asthma, cancer, and kidney disease.
c Difficulty in performing one of the following basic activities of daily living (BADL): bathing, dressing, eating,
50+ years 9.0
13.5
16.2
Fr
agility (%)
18.0%
16.0%
14.0%
12.0%
10.0%
8.0%
6.0%
4.0%
2.0%
0.0%
60+ years 65+ years
Figure 1. Prevalence of frailty according to age groups. The Brazilian Longitudinal Study of Aging (ELSI-Brazil), 2015–2016.
Table 2. Results of the unadjusted analysis of the association between frailty and sociodemographic characteristics, health behaviors and conditions. The Brazilian Longitudinal Study of Aging (ELSI-Brazil), 2015–2016.
Variable Prevalence Prevalence ratio
% 95%CI PRd 95%CIe
Age (years)
50–59 4.3 3.7–5.1 1
60–69 8.1 6.9–9.5 1.87 1.49–2.34b
70 or older 20.9 18.1–24.0 4.82 3.99–5.83b
Gender
Male 8.5 7.3–9.8 1
Female 9.5 8.2–11.0 1.12 0.94–1.34
Lives with a partner
No 11.6 10.2–13.0 1
Yes 7.6 6.7–8.7 0.66 0.59–0.74b
Education (years of schooling)
0–3 14.5 12.4–16.8 1
4–7 8.4 7.3–9.7 0.58 0.47–0.71b
8–11 5.3 4.0–6.9 0.36 0.28–0.47b
12 or more 3.3 1.8–6.1 0.23 0.13–0.43b
Perceived income sufficiency
Always enough 7.8 6.4–9.4 1
Sometimes it’s enough 8.3 6.9–10.0 1.07 0.84–1.37
Never enough 10.5 9.2–11.9 1.35 1.14–1.61c
Current smoker
No 9.0 7.9–10.2 1
Yes 9.2 7.8–10.8 1.03 0.87–1.21
Self-rated health
Good 4.4 3.4–5.5 1
Regular 9.0 7.9–10.2 2.07 1.64–2.61a
Poor 27.0 24.1–30.2 6.21 5.03–7.67a
Number of chronic diseasesf
One or none 5.8 4.7–7.2 1
Two or more 14.7 13.2–16.5 2.54 2.05–3.15a
Difficulty performing BADLg
No 5.8 4.9–6.8 1
Yes 28.1 25.2–31.1 4.87 4.06–5.83a
a p < 0.001 b p < 0.01 c p < 0.05 d Prevalence ratio.
e Estimated 95% confidence intervals.
f History of medical diagnosis of hypertension, diabetes, heart disease, chronic lung disease, stroke, arthritis,
asthma, cancer, and kidney disease.
g Difficulty in performing one of the following basic activities of daily living (BADL): bathing, dressing, eating,
self-rated health, multimorbidity, and difficulty to perform one or more BADL. Gender and smoking status were not statistically associated with frailty.
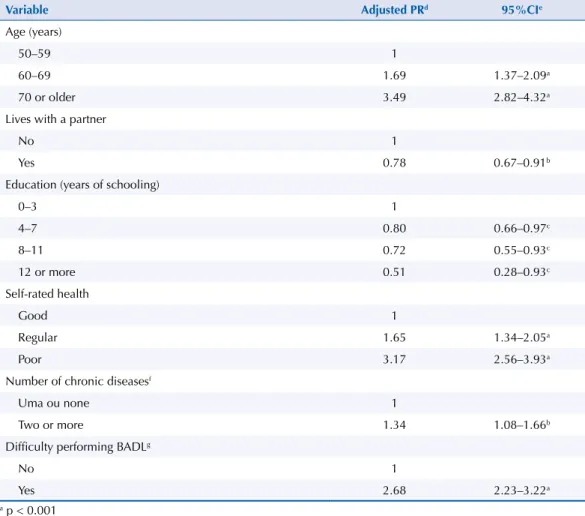
Table 3 presents the results of the multivariate analysis. Positive and statistically significant associations were observed for age (PR = 1.69 for the 60–69 age group and PR = 3.49 for those 70 years or older), worse self-rated health (PR = 1.65 for reasonable and PR = 3.17 for poor or very poor), had two or more chronic diseases (PR = 1.34), and had difficulty performing BADL (PR = 2.68). Negative associations were observed for living with a partner (PR = 0.78) and educational level (PR = 0.80, 0.72 and 0.51 for 4–7, 8–11 and 12 years or more, respectively).
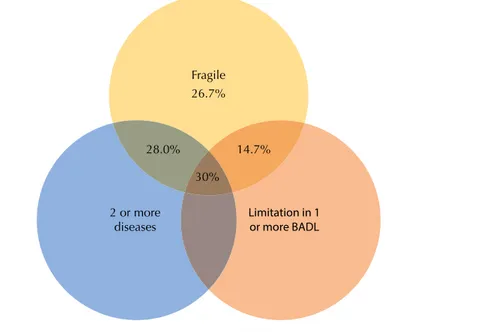
Figure 2 is the Venn diagram, which shows the overlap between frailty, chronic diseases and difficulty to perform BADL. Of the participants with frailty, 28.0% had two or more chronic diseases; 14.7% had limitations to perform BADL; and 26.7% did not have any of these conditions.
The additional analysis shows that the estimated prevalence of frailty, using imputed data to compensate for the information loss of 9% of those eligible for the study, was similar (9.5%; 95%CI 8.4–10.6) to that without imputation previously shown. It is noteworthy that this same analysis showed that the factors associated with frailty are the same as presented in Table 3 (data not shown).
Table 3. Results of the multivariate analysis of factors associated with frailty. The Brazilian Longitudinal Study of Aging (ELSI-Brazil), 2015-2016.
Variable Adjusted PRd 95%CIe
Age (years)
50–59 1
60–69 1.69 1.37–2.09a
70 or older 3.49 2.82–4.32a
Lives with a partner
No 1
Yes 0.78 0.67–0.91b
Education (years of schooling)
0–3 1
4–7 0.80 0.66–0.97c
8–11 0.72 0.55–0.93c
12 or more 0.51 0.28–0.93c
Self-rated health
Good 1
Regular 1.65 1.34–2.05a
Poor 3.17 2.56–3.93a
Number of chronic diseasesf
Uma ou none 1
Two or more 1.34 1.08–1.66b
Difficulty performing BADLg
No 1
Yes 2.68 2.23–3.22a
a p < 0.001 b p < 0.01 c p < 0.05
d Prevalence ratio adjusted by gender and income sufficiency. e Estimated 95% confidence intervals.
f History of medical diagnosis of hypertension, diabetes, heart disease, chronic lung disease, stroke, arthritis,
asthma, cancer, and kidney disease.
g Difficulty in performing one of the following basic activities of daily living (BADL): bathing, dressing, eating,
DISCUSSION
This was the first study to estimate the prevalence of frailty in the Brazilian population aged 50 years or older. The results show a prevalence of 9% of frailty in this population. This prevalence increases with age and reaches 20.9% among those aged 70 years or older. Frailty was associated with less education and different health conditions. In addition, it was observed that about a quarter of the participants presented frailty in the absence of multimorbidity or limitations to perform BADL.
The prevalence of frailty varies markedly among populations. The comparison between the studies should be done with caution because of the different definitions used and the age brackets considered in each of them. In this study, prevalence rates were estimated for different ages, in order to allow comparisons with other investigations, using similar criteria to define the outcome. The prevalence of frailty in this analysis for the 65 years or older age group (16.2%) was similar to that observed in SHARE (The Survey of Health, Aging and Retirement in Europe) conducted in 10 European countries (17.0%)6, but higher
than in the FIBRA study, conducted in seven Brazilian cities, which identified prevalence rates between 7.7% and 10.8%2. The prevalence found in this analysis was lower than that observed in other Latin American countries (19.6%)3, but higher than that observed in the
SABE study (8.5%), conducted in the city of São Paulo12.
Frailty is one of the major syndromes associated with aging19 because as people age,
they accumulate deficiencies in various physiological systems and become increasingly vulnerable to disease complications. With age, there’s an increase in the likelihood of neuromuscular changes, neuroendocrine dysregulation, and dysfunctions in the immune system. Thus, the likelihood of the development of disabilities and of chronic diseases onset also increases1,4,20. These conditions, as well as frailty, undergo the cumulative effects of
risks present throughout life, associated, for example, with age and gender1,4. In the present
study, there was a positive association between frailty and age, but there was no association with gender.
The results of this study corroborate the relationship between frailty and the presence of disabilities and chronic diseases1,4,9. However, as observed in previous studies1,21, our
results show a significant proportion (26.7%) of individuals with frailty do not present multimorbidity, nor limitations to perform BADL. This proportion is comparable to those
Fragile
Limitation in 1 or more BADL 2 or more
diseases
26.7%
30%
14.7% 28.0%
found in the United States (26.6%)1 and in Hong Kong (23.1%)21. These findings reinforce the hypothesis that frailty is a distinct condition associated with physiological dysregulation and that functional diseases and limitations are not necessarily synonymous with frailty1,20.
In this analysis, the poor self-rated health was associated with a higher prevalence of frailty, confirming the evidence available in the literature1,4,5. Self-rated health has been
used as an important marker for the assessment of frailty since the self-perception of good general health is associated with protective effects on the neurological, immunological and endocrine systems22. People who negatively assess their own health usually invest less in self-care, do not practice physical activity, go less to the doctor, have no healthy eating habits and exhibit low psychosocial development. Thus, they are more likely to develop frailty23.
The results of this study show that the frailty is associated with lower levels of education. As evidenced in other studies1,5,6,24, individuals with lower education had a higher prevalence
of frailty. Education is a social determinant of health often used in inequity analyses. The low level of education in Brazil compromises access to health and also to better employment and financial conditions, interfering with the style and quality of life of the individual. Consequently, individuals with a lower educational level have higher levels of unhealthy behaviors and develop more chronic diseases, which have an influence on the process of developing frailty25.
The association between lower prevalence of frailty and living with a partner calls attention to the importance of social relations and social support for the prevalence4,9 and the
incidence of frailty26. Among the possible explanations for the lower prevalence of frailty
and the presence of marital relationship, we can highlight the favorable effects of structural support from social relations. Moreover, part of the association between marital status and health comes from positive affection and happiness, and not only from social support27. The presence of a partner may also favor health care, such as increasing adherence to medication treatment28.
This study has strengths and limitations. The main advantage of the study is its large population base, which allows for the estimation of prevalence rates for the Brazilian population. In addition, frailty was measured using a well-known and standard method, allowing comparisons with other investigations. The limitations are related to the cross-sectional nature of the study, which limits the assessment of causality between associated factors and frailty.
In sum, the prevalence of frailty among Brazilians aged 65 years or older is similar to that observed in the corresponding age group in European countries. Worse health conditions, functional limitation and lower education emerge as the factors most strongly associated with the frailty in this population. The results also show that frailty can occur in the absence of multimorbidity and functional limitations. These findings constitute the first estimate of frailty for the Brazilian population and can provide important information for the planning and implementation of health care interventions and actions to promote better quality of life and active aging among older Brazilians.
REFERENCES
1. Fried LP, Tangen CM, Walston J, Newman AB, Hirsch C, Gottdiener J, et al. Frailty in older adults: evidence for a phenotype. J Gerontol A Biol Sci Med Sci. 2001;56(3):M146-57.
2. Neri AL, Yassuda MS, Araújo LF, Eulálio MC, Cabral BE, Siqueira MEC, et al. Metodologia e perfil sociodemográfico, cognitivo e de fragilidade de idosos comunitários de
sete cidades brasileiras: Estudo FIBRA. Cad Saude Publica. 2013;29(4):778-92. https://doi.org/10.1590/S0102-311X2013000400015
4. Moreira VG, Lourenço RA. Prevalence and factors associated with frailty in an older population from the city of Rio de Janeiro, Brazil: the FIBRA-RJ Study. Clinics (Sao Paulo). 2013;68(7):979-85. https://doi.org/10.6061/clinics/2013(07)15
5. Mello AC, Engstrom EM, ALVES LC. Fatores sociodemográficos e de saúde associados à fragilidade em idosos: uma revisão sistemática de literatura. Cad Saude Publica. 2014;30(6):1143-68. https://doi.org/10.1590/0102-311X00148213
6. Santos-Eggimann B, Cuenoud P, Spagnoli J, Junod J. Prevalence of frailty in middle-aged and older community-dwelling Europeans living in 10 countries. J Gerontol A Biol Sci Med Sci. 2009;64(6):675-81. https://doi.org/10.1093/gerona/glp012
7. Lima-Costa MF, Facchini LA, Matos DL, Macinko J. Mudanças em dez anos das desigualdades sociais em saúde dos idosos brasileiros (1998-2008). Rev Saude Publica. 2012;46 Supl 1:100-7. https://doi.org/10.1590/S0034-89102012005000059
8. Organização Mundial da Saúde. Envelhecimento ativo: uma política de saúde. Brasília (DF): Organização Pan-Americana da Saúde; 2005 [cited 2017 Out 20]. Available from: http://bvsms. saude.gov.br/bvs/publicacoes/envelhecimento_ativo.pdf
9. Alvarado BE, Zunzunegui MV, Béland F, Bamvita JM. Life course social and health conditions linked to frailty in Latin American older men and women. J Gerontol A Biol Sci Med Sci. 2008,63(12):1399-406. https://doi.org/10.1093/gerona/63.12.1399
10. Pegorari MS, Tavares DMS. Factors associated with the frailty syndrome in elderly individuals living in the urban area. Rev Lat Am Enfermagem. 2014;22(5):874-82. https://doi.org/10.1590/0104-1169.0213.2493
11. Lima-Costa MF, Andrade FB, Souza Jr PRB, Neri AL, Oliveira Duarte YA, Castro-Costa E, et al. The Brazilian Longitudinal Study of Aging (ELSI-Brazil): objectives and design. Am J Epidemiol. 2018;187(7):1345-53. https://doi.org/10.1093/aje/kwx387
12. Andrade FB, Lebrão ML, Santos JLF, Duarte YAO. Relationship between oral health and frailty in community-dwelling elderly individuals in Brazil. J Am Geriatr Soc. 2013;61(5):809-14. https://doi.org/10.1111/jgs.12221
13. Simonsick EM, Maffeo CE, Rogers SK, Skinner EA, Davis D, Guralnik JM, et al. Methodology and feasibility of a home-based examination in disabled older women: the Women’s Health and Aging Study. J Gerontol A Biol Sci Med Sci.1997;52(5):M264-74.
14. Orme JG, Reis J, Herz EJ. Factorial and discriminant validity of the Center for Epidemiological Studies Depression (CES-D) scale. J Clin Psychol. 1986;42(1):28-33. https://doi.org/10.1002/1097-4679(198601)42:1<28::AID-JCLP2270420104>3.0.CO;2-T
15. Fan M, Lyu J, He P; The IPAQ Group. Guidelines for data processing and analysis of the International Physical Activity Questionnaire (IPAQ) – short and long forms. IPAQ Research Committee; 2005 [cited 2017 Out 20]. Available from: http://www.ipaq.ki.se
16. World Health Organization. Multimorbidity. Geneva: WHO; 2016 [cited 2017 Out 20]. Available from: http://www.who.int/iris/handle/10665/252275
17. Violan C, Foguet-Boreu Q, Flores-Mateo G, Salisbury C, Blom J, Freitag
M, et al. Prevalence, determinants and patterns of multimorbidity in primary care: a systematic review of observational studies. PLoS One. 2014;21;9(7):e102149. https://doi.org/10.1371/journal.pone.0102149
18. Katz S, Ford AB, Moskowitz RW, Jackson BA, Jaffe MW. Studies of illness in the aged. The index of ADL: a standardized measure of biological and psychosocial function. JAMA. 1963;185:914-9. https://doi.org/10.1001/jama.1963.03060120024016
19. Clegg A, Young J, Iliffe S, Rikkert MO, Rockwood K. Frailty in ederly people. Lancet. 2013;381(9868):752-62. https://doi.org/10.1016/S0140-6736(12)62167-9
20. Fried LP, Ferrucci L, Darer J, Williamson JD, Anderson G. Untangling the concepts of disability, frailty and comorbidity: implications for improved targeting and care. J Gerontol A Biol Sci Med Sci. 2004;59(3):255-63. https://doi.olrg/10.1093/gerona/59.3.M255
21. Woo J, Leung J. Multi-morbidity, dependency, and frailty singly or in combination have different impact on health outcomes. Age (Dordr). 2014;36(2):923-31. https://doi.org/10.1007/s11357-013-9590-3
23. Melo DM, Falsarella GR, Neri AL. Autoavaliação de saúde, envolvimento social e fragilidade em idosos ambulatoriais. Rev Bras Geriatr Gerontol. 2014;17(3):471-84. https://doi.org/10.1590/1809-9823.2014.13172
24. Hoogendijk EO, Hout HP, Heymans MW, Horst HE, Frijters DH, Broese van Groenou MI, et al. Explaining the association between educational level and frailty in older adults: results from a 13-year longitudinal study in the Netherlands. Ann Epidemiol. 2014;24(7):538-44.e2. https://doi.org/10.1016/j.annepidem.2014.05.002
25. Szanton SL, Seplaki CL, Thorpe Jr RJ, Allen JK, Fried LP. Socioeconomic status is associated with frailty: the Women’s Health and Aging Studies. J Epidemiol Community Health. 2010;64(1):63-7. https://doi.org/10.1136/jech.2008.078428
26. Lurie I, Myers V, Goldbourt U, Gerber Y. Perceived social support following myocardial infarction and long-term development of frailty. Eur J Prev Cardiol. 2015;22(10):1346-53. https://doi.org/10.1177/2047487314544575
27. Ramsey MA, Gentzler AL. An upward spiral: bidirectional associations between positive affect and positive aspects of close relationships across the life span. Dev Rev. 2015;36:58-104. https://doi.org/10.1016/j.dr.2015.01.003
28. Wu JR, Lennie TA, Chung ML, Frazier SK, Dekker RL, Biddle MJ, et al. Medication adherence mediates the relationship between marital status and cardiac event-free survival in patients with heart failure. Heart Lung. 2012;41(2):107-14. https://doi.org/10.1016/j.hrtlng.2011.09.009
Funding: The ELSI-Brazil baseline study was supported by the Brazilian Ministry of Health (DECIT/SCTIE – Department of Science and Technology from the Secretariat of Science, Technology and Strategic Inputs (Grant 404965/2012-1); COSAPI/DAPES/SAS – Healthcare Coordination of Older Adults, Department of Strategic and Programmatic Actions from the Secretariat of Health Care) (Grants 20836, 22566 and 23700); and the Brazilian Ministry os Science, Technology, Innovation and Communication.
Authors’ Contribution: JMA, FCDA, FBA participated in the study concept and design, data analysis and interpretation, drafting of the manuscript. YAOL, LCA, MFLC, PRBJ participated in data interpretation, drafting of the manuscript. All authors approve the final submitted version.