Maria João Marques Soares
Modeling a renewable electricity system:
the Portuguese case
Mar ia João Mar ques Soar es Janeiro de 2014 UMinho | 201 4 Modeling a r ene w able electr icity sys tem: t he P or tuguese case
Janeiro de 2014
Tese de Mestrado
Mestrado Engenharia Industrial - Ramo Gestão Industrial
Trabalho efetuado sob a orientação da
Professora Doutora Paula Varandas Ferreira
Maria João Marques Soares
Modeling a renewable electricity system:
the Portuguese case
iii
Acknowledgements
I express my gratitude to all those who in one way or another, were the pillars that made me capable doing this work, with all the hours and effort that I had to dedicate to it.
Thank you Dra. Paula Varandas Ferreira, supervisor of this dissertation. All you availability and commitment, even at late hours, were crucial for this work.
Thank you REN for the technical availability in providing essential data to develop this work.
Thank you all my mission colleagues and friends in São Tomé and Príncipe that inspired me and, even far way, gave me the strength to continue and to push myself up.
Thank you to all the people that is in the project of my heart, “O Grão”, you really inspire me every day of my life since I met you.
Thank you mom and dad for put up with me in the most difficult moments and never let me give up.
Thank you all my friends for the understanding when I couldn’t go out with you or even be present in your birthday parties, it was for a good cause.
v
Abstract
Renewable energies play a unique role in the sustainable development of countries, promoting the exploitation of natural resources for the production of electricity, heat and biofuels.
Portugal is a country with limited energy resources. The reduction of the external energy dependence is one of the main goals for the future, justifying an increasing cross sector application of renewable energy sources (RES), covering the transport, heating/cooling and electricity production systems.
The present work addresses the Portuguese electricity production sector and aimed to propose and analyze different renewable energy scenarios. For this, the Sustainable Electricity Planning Model was adapted in order to include different RES technologies and following a cost minimization approach, for a 10 years planning period. The work required the collection of data for the full characterization of the technologies, including the estimated power potential, seasonal availability of the resources and costs. The monthly demand projections for the planning models were also required to be estimated departing from the annual forecast for the sector for the next 10 years.
Four scenarios were obtained, each one representing a different contribution of RES to the electricity production. In the first scenario the RES share was assumed to remain equal to 37%, a value close to the one obtained in 2012. As for the other three scenarios, the RES share was increased until reaching 86%, the maximum value possible according to the constraints assumed in the model.
The results demonstrate that the increase of RES will have a strong impact on the total cost of the system, mainly due to the required investment costs. The total cost of the maximum RES scenario is more than double than the one obtained under scenario 1 assumptions. However, the CO2 emissions would be less than 3% of the total value obtained for scenario 1. Another relevant conclusion of the work is that the increasing of RES power in the system, leads to an increase of both the total installed power and of the electricity production. This demonstrates the need to integrate the electricity system allowing to include the possibility of importations and exportations.
vii
Resumo
As energias renováveis desempenham um papel crucial no desenvolvimento sustentável dos países, promovendo a exploração dos recursos naturais para a produção de eletricidade, calor e biocombustíveis.
Portugal é um país com recursos energéticos limitados. A redução da dependência energética externa é uma das principais metas para o futuro, o que justifica uma aplicação intersectorial crescente de fontes de energia renováveis (FER), que abrange o transporte, aquecimento e sistemas de produção de energia elétrica.
O presente trabalho aborda o setor de produção de eletricidade Português e teve como objetivo propor e analisar diferentes cenários de energia renovável. Para isso, o Modelo de Planeamento Sustentável de Eletricidade foi adaptado para incluir diferentes tecnologias FER, seguindo uma abordagem de minimização de custos por um período de 10 anos de planeamento. Para o trabalho foi necessário a recolha de dados para a caracterização completa das tecnologias, incluindo o potencial de energia estimada, a disponibilidade sazonal dos recursos e custos. As projeções mensais da procura para os modelos de planeamento também foram estimadas, tendo como base as previsões anuais para o setor para os próximos 10 anos.
Simularam-se quatro cenários diferentes, cada um representando uma contribuição diferente das FER para a produção de eletricidade. No primeiro cenário a participação FER foi assumida como igual a 37%, um valor próximo ao existente em 2012 em Portugal. Quanto aos outros três cenários, a participação FER foi aumentada até atingir 86%, valor máximo possível definido de acordo com as limitações assumidas no modelo.
Os resultados demonstram que o aumento das FER terá um forte impacto sobre o custo total do sistema, principalmente devido aos custos de investimento necessários. O custo total obtido do cenário com a máxima percentagem de FER é mais do dobro do que o custo obtido no cenário 1. No entanto, as emissões de CO2 seriam inferiores a 3 % do valor total obtido para o cenário 1. Outra conclusão relevante do trabalho é que o aumento de potência FER no sistema, leva a um aumento tanto da potência instalada como da produção de energia elétrica. Isso demonstra a necessidade de integrar ao sistema elétrico a possibilidade de importações e exportações.
Palavras-chave: Fontes de energia renováveis (FER), Modelo de Planeamento
ix
Table of contents
Acknowledgements ... iii Abstract ... v Resumo ... vii Table of contents ... ixList of tables ... xiii
List of abbreviations ...xv
PART I – INTRODUCTION ... 1
I.1 Introduction ... 3
I.2 Main objectives ... 5
I.3 Structure ... 5
PART II – LITERATURE REVIEW ... 7
II.1 – Electricity generation Technologies ... 9
II.1.1.1 - Biomass ... 11
II.1.1.2 - Geothermal ... 15
II.1.1.3 - Hydropower ... 19
II.1.1.4 - Energy from de Ocean ... 22
II.1.1.5 - Solar Energy ... 24
II.1.1.6 - Wind Energy ... 26
II.1.1.7 - Non-RES ... 28
II.2 – The inclusion of RES in the electricity systems ... 30
II.2.1 - RES market trends ... 30
II.2.2 - 100% RES electricity systems ... 33
PART III – MODEL IMPLEMENTATION ...35
III. 1 - Detailed Methodology ... 37
III.2 - Modeling a renewable electricity system: the Portuguese case ... 38
III.2.1 - Context of the problem ... 38
III.2.1.1. - The Portuguese electricity system ... 38
III.2.2 - The strategic electricity planning model (SEPP) ... 42
III.2.2.1 - HOMER energy ... 42
III.2.2.2 - RETScreen software ... 43
III.2.2.3 - EnergyPLAN ... 44
x
III.2.2.5 - SEPP UM ... 47
III.2.3. - Case study: Modeling a renewable electricity system - the Portuguese case 49 III.2.3.1- Model formulation ... 50
III.2.3.2- Results ... 58
III.2.3.3- Results analysis ... 66
PARTE IV – CONCLUSIONS AND FUTURE WORK ...77
IV.1 - Final Considerations ... 77
IV.2 - Proposals for future work ... 79
xi
List of figures
Fig. 1 - World net electricity generation by source (trillion kwh)... 10
Fig. 2 - Europe net electricity generation by source (trillion kWh) ... 11
Fig. 3 - Multiple energy options from biomass. ... 13
Fig. 4 - Achievement of geothermal energy ... 16
Fig. 5 - The Lindal diagram on typical fluid temperatures for direct applications of geothermal resources ... 17
Fig. 6 - Diagram of a Run of river power plant ... 22
Fig. 7 - Power Generation Structure in Europe ... 31
Fig. 8 - Power Generation from RES in Europe ... 31
Fig. 9 - RES Indicators ... 32
Fig. 10 - Energy dependence rate (%) ... 38
Fig. 11 - Evolution of Primary Energy consumption in Portugal ... 39
Fig. 12 - Electricity produced from RES (TWh) ... 40
Fig. 13 - Production of electricity from renewable sources by district in 2012 (GWh) ... 41
Fig. 14 - H2RES model ... 46
Fig. 15 - Cost evolution for different scenarios ... 67
Fig. 16 - Emissions evolution for different scenarios ... 68
Fig. 17 - Electricity production for the different scenarios in 2023 (MWh) ... 69
Fig. 18 - Distribution of RES for electricity production for scenario 1 in 2023 70 Fig. 19 - Distribution of RES for electricity production for scenario 2 in 2023 70 Fig. 20-Distribution of RES for electricity production for scenario 3 in 2023 .. 71
Fig. 21 - Distribution of RES for electricity production for scenario 4 in 2023 72 Fig. 22 - Monthly RES electricity production for scenario 1 in 2023 ... 73
xiii
List of tables
Table 1 - Major advantages and disadvantages of biomass. ... 14
Table 2 - Advantages and disadvantages of geothermal energy. ... 18
Table 3 - Economic advantages and disadvantages of hydropower. ... 19
Table 4 - Social advantages and disadvantages of hydropower. ... 20
Table 5 - Environmental advantages and disadvantages of hydropower. ... 20
Table 6 - Advantages and disadvantages of solar energy for electricity production. ... 25
Table 7 - Advantages and disadvantages of wind energy for electricity production. ... 27
Table 8 - Advantages and disadvantages of cogeneration. ... 29
Table 9 - SCGT advantages and disadvantages. Source: ... 29
Table 10 - International comparison among OECD countries. ... 41
Table 11 - Changes in the initial formulation of the SEPP model ... 50
Table 12 - Modular capacity of new thermal power groups (MW) ... 52
Table 13 – Cost data for the new power plants ... 52
Table 14 - Cost data for the existing power plants ... 53
Table 15 - CO2 emissions value of each unit in t/MWh ... 54
Table 16 - RES unavailability factor ... 55
Table 17 - Monthly demand (MGWh) ... 55
Table 18 - Installed power of existing units (MW) ... 56
Table 19 - Assumed SRP production 2014-2023 (MWh) ... 57
Table 20 - Installed power potential for RES power plants (MW) ... 58
Table 21 - Optimal solutions for scenario 1 ... 58
Table 22 - Installed power of new units for scenario 1 (MW) ... 59
Table 23 – 2023 Electricity production for scenario 1 (MWh) ... 59
Table 24 - Optimal solutions for scenario 2 ... 60
Table 25 - Installed power of new units for scenario 2 (MW) ... 61
Table 26 - Electricity production for scenario 2 in 2023 (MWh) ... 61
Table 27 - Optimal solutions for scenario 3 ... 62
Table 28 - Installed power of new units for scenario 3 (MW) ... 62
Table 29 - Electricity production for scenario 3 in 2023 (MWh) ... 63
xiv
Table 31 - Installed power of new units for scenario 4 (MW) ... 64 Table 32 - Electricity production for scenario 4 in 2023 (MWh) ... 65 Table 33 – New installed power added per year and per scenario ... 68
xv
List of abbreviations
ºC – Degree CelsiusCCGT – Combined cycle gas turbine CFC - chlorofluorocarbon
CHP - Combined Heat and Power
DGEG – Direcção Geral da Energia e Geologia EU – Europe Union
GHG – Green House Gases GWh – Giga Watt hour
HCFC - Hydrochlorofluorocarbon
HOMER - Hybrid Optimization Model for Electric Renewables
Km – Kilometer M - Million
MWh – Mega Watt Hour
NSE - National Strategies for Energy
O&M - Operations and maintenance
OECD - Organisation for Economic Co-operation and Development
OTEC - Ocean Thermal energy conversion
PV – Photovoltaic
REN – Rede Elétrica Nacional RES – Renewable Energy Sources SCGT – Simple cycle gas turbine
SEPP - Sustainable Electricity Power Planning
SHP – Small Hydro Power SRP – Special regime production t – ton
xvii
List of equations
Equation 1 - biomass production ... 12 Equation 2 - Availability factor ... 54
1 Maria João Soares
PART I – INTRODUCTION
I.1 - Introduction
I.2 - Main objectives
I.3 - Investigation Methodology
3 Maria João Soares
PART I – INTRODUCTION
I.1 Introduction
There are two types of energy: the renewable and non-renewable energy. Both can be used to produce electricity, which is the most popular way too transfer energy from one place to another. Renewable energy is energy which comes from natural resources such as sunlight, wind, rain, tides, waves and geothermal heat, which are naturally replenished. There are many advantages in the use of renewable energies and although the ecological ones are the most reported ones, others such as local and regional development or reduction of the energy deficit of countries should not be overlooked. On the other side, the non-renewable energy is the one that is taken from the sources that are available on the earth in limited quantity or their production is less than its consumption rate. It can be divided into two types: fossil fuels and nuclear fuel. The cost impact is definitely the major argument favoring high fossil fuel scenarios for the energy sector (Ribeiro, Ferreira, & Araujo, 2011) (Connolly D. , Lund, Mathiesen, & Leahy, 2011).
In the past few years we have been called to attention to a phenomenon that is global warming. Global warming is the rise in the average temperature of Earth's atmosphere and oceans that is caused by the changes in atmospheric composition (e.g., increased concentrations of greenhouse gases like CO2). This is a major challenge facing human kind and is one the strongest arguments in favor of the renewable energy investments.
Another problem we have to try to reach a solution is the external energy dependence of countries or regions. The integrated use of the existing renewable and non-renewable energy technologies would make it possible to reduce dependency on imported fossil fuels or on limited domestic resources, decarbonize electricity, enhance energy efficiency and reduce emissions in the industry, transport and buildings sectors. This would contribute significantly to dampen surging energy demand, reduce imports, strengthen domestic economies, and over time dramatically reduce greenhouse gas (GHG) emissions (Mathiesen, Lund, & Karlsson, 2011) (International Energy Agency, 2012) .
Portugal, in particular, has a relatively dense river network and a highly favorable annual sun exposure. Also, the country has a wide seafront benefiting from
4 Maria João Soares
the Atlantic winds, which gives it the ability to harness the potential energy of water, sun, waves and wind. Although still strongly relying in fossil fuel consumption, these unique natural conditions in the country are allowing for the use of alternative forms of energy. Therefore, Portugal is in a unique position not only to compensate the deficit of natural non-renewable energy sources but also to be a pioneer in reducing energy dependence on non-renewable energy sources and pollutants, putting themselves at the forefront of the demand for a sustainable development (A página da educação, 2003)
But the fact is that Portugal, according to Direcção Geral da Energia e Geologia (DGEG), in 2011 still had an index of dependence on foreign energy above 75% in terms of sources primary energy. This high dependence on foreign fuels allied to the increasing importance of the themes of sustainability resources and climate change, and also to the need to provide competitive energy services prices to the Portuguese economy can explain the effort to reduce this dependence, focusing mainly on promoting both the use of renewable energy sources (RES) and energy efficiency measures (DGEG - Direcção Geral de Energia e Geologia, 2013).
The National Strategies for Energy (NSE) objectives for Portugal in 2020 included (Gabinete de Estratégia e Estudos, 2011):
Reducing dependence on foreign energy to 74%, producing 31% of the final energy consumption from renewable resources;
Increasing, the share of electricity produced from renewables to 60%;
Increasing energy efficiency by 20%,
Reducing the energy import balance by 25%, equivalent to reducing imports by 2000 million euros per year.
Other objectives relate to the achievement of targets for reducing energy consumption (20%) and emissions of greenhouse gases (reduction of CO2 by 20 million t). The strategy also aims to promote the creation of added value and creating sector employment, as well as increase the exportations.
It is already certain that the renewable energies are the solution for the future. The question that remains is why not a 100% RES electricity system? Even under the policies drawn for Portugal, fossil fuel remains as dominant sources of primary energy. It might be wise to accept the eventual depletion of oil (sooner or later) and to reduce demand and improve renewable energy systems. Recent studies addressed in the literature this 100% RES possibility for different countries as surveyed in Cosic and
5 Maria João Soares
Duic (2012) and the general conclusion is that this option is feasible even with the current technologies. Energy planning becomes then a fundamental tool to support defensible future strategies (Cosic & Duic, 2012).
To have a future electricity scenario with 100% RES we have to link energy demand, storage and harvesting perfectly. Still it is important to diversify and to combine all the renewable energies such as solar, wind and biomass perfectly. It is a challenge and it is important to provide essential supports for planning a 100% RES electricity system, building different scenarios and analyzing which one would be the most advantageous for Portugal based on economic, environmental and social effects (Krajacic, Duic, & Carvalho, 2011).
I.2 Main objectives
This research project aims to approach the possible development of an electrical system based on 100% renewable production in Portugal, designing scenarios and analyzing them from the cost and emissions perspectives. The research was supported the electricity planning model previous developed and demonstrated for the Portuguese case, adapted to this study with the inclusion of new data and RES technologies (Pereira, Ferreira, & Vaz, 2013) (Pereira, Ferreira, & Vaz, 2011).
The present project has then the following objectives:
Selection and characterization of renewable technologies for electricity generation;
Construction of 100% renewable electricity generation scenarios in Portugal;
Analysis of the economic and environmental performance of the proposed scenarios.
I.3 Structure
This project is divided into 4 parts: Introduction, Literature Review, Model Implementation and Conclusions.
6 Maria João Soares
The first part (Part I) corresponds to the introduction and scope of the project, and is composed of four points: framing the problem, identifying the main objective and the present structure.
The second part (Part II) covers the literature review required for a good understanding of all the concepts and present studies on the project. This part presents a contextualization of the electricity generation technologies, with particular attention being given to RES technologies, trends and 100% RES scenarios.
The third part (Part III) corresponds to the case study, and it is here that we find the detailed study of all the objectives listed in Part I. The Portuguese electricity system is briefly introduced and the model implementation is detailed. In this part, the results of the study are presented and analyzed.
The fourth part (Part IV) presents the main conclusions of the research and point directions for future work.
7 Maria João Soares
PART II – LITERATURE REVIEW
II.1 – Renewable energy technologies
9 Maria João Soares
PART II – LITERATURE REVIEW
Energy sector activities have impact on the environment, particularly in climate changes and, therefore, the definition of energy and environmental policies that should seek to meet the existing synergies, taking into account the implicit contradictions in their respective impacts, are crucial to reduce all the impacts that pollution can create.
An integrated strategy of energy and environmental policies must strike a balance between the technical and economic feasibility and environmental conditions, with due regard to cost-effectiveness and social and economic promotion of sustainable development, bearing in mind security of supply and competitiveness. The electricity sector is particularly relevant and the importance of RES to electricity production is strongly underlined by the European Commission (European Comission, 2014). The forecasts for the electricity sector in Europe indicate an increasing reliance on RES, with fossil fuel and nuclear accounting for about 50% of total electricity generation in 2050 (European Comission, 2013).
The following chapters address different technologies for electricity generation giving a short explanation of how they work and listing the advantages and disadvantages of each. The largest section is dedicated to RES technologies but there is also a section to refer other types of non-renewable energy also important to the electricity economy and production. The inclusion of RES in the electricity systems is addressed discussing models and approaches debated in the literature.
II.1 – Electricity generation Technologies
In the world we are living, energy is crucial and, without it, the society that we know would crumble. As the population grows, the need of energy will exponentially grow a well.
Problems with energy supply and use are related not only to global warming, but also to such environmental concerns as air pollution, acid precipitation, ozone depletion, forest destruction, and emission of radioactive substances.
These issues must be taken into consideration simultaneously if humanity wants to achieve a bright energy future with minimal environmental impacts (Dincer, 2000).
10 Maria João Soares
Worldwide speaking, electricity generation will increase by 93% from 2010 to 2040. Coal is the most prominent source of energy and tends to increase. After coal, RES, natural gas and nuclear power are the next fastest-growing generation sources. Fig. 1 demonstrates these forecasts from the International Energy Agency (2013).
The outlook for coal could be altered substantially, however, by any future national policies or international agreements aimed at reducing or limiting the growth of greenhouse gas emissions.
Fig. 1 - World net electricity generation by source (trillion kwh). Source: (International Energy Agency, 2013)
Specifically in Europe, electricity generation increases an average of 1% per year and coal and nuclear are the predominant in 2010 but tend to decrease while renewable energies tend to increase and be the prominent sources for electricity production with an average growth rate of 2.2% per year from 2010 to 2040. As long as European governments support price premiums for renewable electricity, robust growth in renewable generation is likely to continue (International Energy Agency, 2013). Fig. 2 demonstrates these European forecasts and put in evidence the increasing reliance on RES for electricity production.
11 Maria João Soares
Fig. 2 - Europe net electricity generation by source (trillion kWh) Source: (International Energy Agency, 2013)
II.1.1 - Renewable Energy Sources (RES)
RES that use indigenous resources have the potential to provide energy services with zero or almost zero emissions of both air pollutants and greenhouse gases.
There are different kinds of renewable energy technologies for electricity production, namely: Biomass; Geothermal; Hydropower; Ocean; Solar Energy; Wind. II.1.1.1 - Biomass
The planet Earth has on its surface a zone where the organisms prosper alive: the biosphere. Biosphere is divided in two different parts: the autotrophy area, where organisms develop living green plants, and the heterotrophic area, in which organisms
12 Maria João Soares
that directly or indirectly depend on living chlorophyllous plants live. The mass of the biosphere is called biomass (Klass, 1988).
Biomass includes simultaneously both living beings as well as the entire organic product generated by those living beings but which are not completely decomposed into elementary molecules. This biomass contains a chemical energy that, to green plants, comes from the conversion of light energy through the photosynthesis (Klass, 1988).
Solar energy is important for the growth of all of these living beings and thanks to photosynthesis, they produce their biomass though sun light and it is depicted by the following equation:
Equation 1 - biomass production
In the previously represented equation, the essential components to photosynthesis are: carbon dioxide (CO2), light in the visible region of the electromagnetic spectrum, the sensitizing catalyst clorophyll, water (H2O) and a living plant. Carbohydrate (CH2O) is the primary organic product from the chemical reaction. Oxygen (O2) liberated in the process comes from the water (Klass, 1988).
Researches characterize biomass in very different ways, but there is one simple method supported on defining the main types according to biological diversity and similar source and origin. The main types are (Vassilev, Baxter, Andersen, & Vassileva, 2010) (McKendry, 2002):
Woody plants;
Herbaceous and agricultural biomass – Grasses and flowers, straws and other residues (like fruits and corn);
Aquatic biomass - Marine or freshwater algae, macroalgae or microalgae and others;
Animal and human biomass wastes – bones, manures, etc.
Biomass mixtures
Biomass is a complex resource that can be processed in many ways leading to a variety of products. Biological routes can convert the carbohydrate portion of the lignocellulosic feedstock into ethanol, an oxygenate that can also be used as a fuel
13 Maria João Soares
additive. The lignin component cannot be used this way and it is combusted to generate heat and electricity. Gasification provides a way to generate syn-gas and from it the clean conventional fuels: Fischer–Tropsch liquids, methanol, and others. In the next diagram it is possible to see some examples of products according to the process type (Chum & Overend, 2001):
Fig. 3 - Multiple energy options from biomass. Source: own elaboration based on: (Chum & Overend, 2001)
Biomass
Production
•Forestry: •thinning; •residues; •Agriculture •grains; •straws; •Trade and Industry: •sawn industry reduction; •wood industry residue; •use wood; •organic residue.Biomass
Processing
•Mechanical: •chipping; •cleaving; •celleting; •briquetting; •pressing. •Thermal and/or chemical: •drying; •gasification; •pyrolysis; •esterification. •Biological: •alcohol fermentation; •methane fermentation.Biomass
fuels
•Solid Fuels: •pellets; •charcoal. •Gaseous fuels: •Biogas; •woodgas; •hydrogen. •Liquid fuels: •ethanol; •methanol; •Fischer-Tropsch liquids;•Oil from plants; •Oil from pyrolysis; •Esters.
Biomass
convertion
•Heat: •single stove; •central heating; •heating plant. •Electricity and heat •CHP plant with: •steam turbine; •gas turbine; •steam and gas turbine; •stirling engine; •combusting engine; •fuel cell14 Maria João Soares
Some of the major advantages and disadvantages of biomass are shown in table 1.
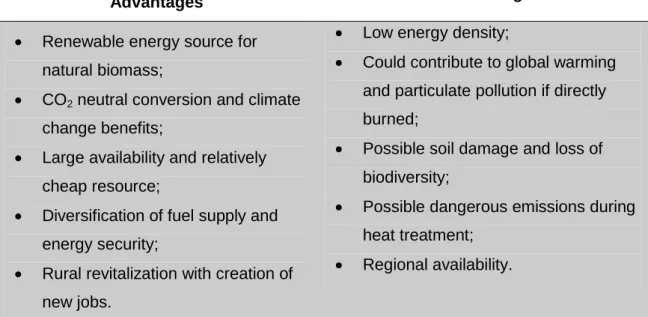
Table 1 - Major advantages and disadvantages of biomass. Source: own elaboration based on: Saidur, Abdelaziz, Demirbas, Hossain, & Mekhiler, 2011 and Vassilev, Baxter, Andersen, & Vassileva, 2010
Advantages Disadvantages
Renewable energy source for natural biomass;
CO2 neutral conversion and climate change benefits;
Large availability and relatively cheap resource;
Diversification of fuel supply and energy security;
Rural revitalization with creation of new jobs.
Low energy density;
Could contribute to global warming and particulate pollution if directly burned;
Possible soil damage and loss of biodiversity;
Possible dangerous emissions during heat treatment;
Regional availability.
The major advantages of biomass are related to the environmental benefits and its renewable characteristics. However, aspects such as the potential for diversification of fuel supply and the contribution to regional development though local job creation should also be considered. On the other hand, the biomass CO2 neutrality is not consensual and its burning can pose air pollution problems. The competition with food crops for land and the soil damages are also frequently seen as important drawbacks for dedicated biomass production (Rathmann, Szklo, & Schaeffer, 2010). Regional availability can be an issue because the production of biomass products require some land where they can easily be planted and raised. As biomass use for energy can release gases like methane in atmosphere, it can only be produced in those areas which are quite far from residential homes (Vassilev, Baxter, Andersen, & Vassileva, 2010).
15 Maria João Soares
II.1.1.2 - Geothermal
Geothermal energy is the heat that comes from Earth’s interior. The heat is brought close to the surface, due to crustal movements, by intrusion of molten magma and the movement of groundwater and reservoirs of hot water where the heat accumulation is due to particular geological conditions of the crust such that the geothermal gradient reaches anomalously high values. Although this fact is generally not noticed, we are not aware of its existence because the temperature of rocks increases with depth, proving that a geothermal gradient exists: this gradient averages 30°C/km of depth (Barbier, 2002).
Fig. 4 describes this geothermal electricity generation process. The use of geothermal electricity is achieved through drilling wells so that they reach reservoirs, bringing to the surface the steam from the hot high pressure water, driving the steam and hot water to separate units in geothermal power turbines. The thermal energy is converted into electrical energy. The geothermal cooled fluid is injected back to the reservoir where it is reheated, preserving the equilibrium and sustainability of the resource. Geothermal fields are generally systems with a continuous circulation of heat and fluid, where fluid enters the reservoir from the recharge zones and leaves through discharge areas (hot springs, wells) (Barbier, 2002).
16 Maria João Soares
Fig. 4 - Achievement of geothermal energy (Barbier, 2002)
There two types of geothermal energy (Barbier, 2002):
High enthalpy geothermal energy – is the geothermal application with more visibility and perhaps, the most important in economic terms. It is related to the production of electricity from water vapor from geothermal origin with a temperature superior than 150ºC, in power plants with steam turbines and condensing unit.
Low enthalpy geothermal energy – results from the existence of average or slightly higher than the average geothermal gradients. These gradients appear due to the existence of deep aquifers (between 1000 to 2000 m), with fluid temperatures between 50 to 100°C. The fluid (water, sometimes with high salinity) is extracted by means of pumps circulators of water.
Geothermal utilization is divided into two categories: electricity production and direct uses. Conventional electricity power production is limited to fluid temperatures above 150°C, but considerably lower temperatures can be used in binary cycle
17 Maria João Soares
systems, also called organic Rankine cycles, (in this case the outlet temperatures of the geothermal fluid are commonly above 85°C). For direct uses, the ideal temperature of thermal waters for space heating is about 80°C. However, larger radiators in the houses or the use of heat pumps or auxiliary boilers means that thermal water with temperatures only a few degrees above ambient temperature can be used beneficially (Barbier, 2002). Fig. 5 shows possible geothermal applications according to the different temperatures.
Fig. 5 - The Lindal diagram on typical fluid temperatures for direct applications of geothermal resources Source: Own elaboration based on: (Barbier, 2002)
18 Maria João Soares
Some of the major advantages and disadvantages of biomass are shown in Table 2.
Table 2 - Advantages and disadvantages of geothermal energy. Source: Own elaboration based on (Portal Energia, 2013)(Akorede, Hizam, & Pouresmaeil, 2010)
Advantages Disadvantages
Geothermal power stations do not require fuel burning to manufacture the steam to move the turbines;
Electricity generation with geothermal energy reduces emissions;
The area of land required for geothermal power stations is smaller per MW than almost every other type of power plants;
Geothermal power plants are projected to work 24 hours per day, all year;
The process is resistant to energy interruptions due to atmospheric conditions, natural catastrophes or political decisions that can interrupt fuel transportation;
Power plants can have modular designs, with additional units installed in increments as needed to fit the growing demand of electricity;
Running costs for the plants are very low as there are no costs for purchasing, transporting, or cleaning up of fuels to generate the power;
If not used in small areas where the heat from the Earth's interior comes to the surface through geysers and volcanoes, soil drilling for pipes can be expensive;
This system has a high initial cost. The maintenance of the heat suction pump is cheap against the high cost of maintenance of the pipes (where water causes corrosion and mineral deposits);
Anti-gelling used in cold areas are pollutants: although they have low toxicity, some of them produce CFCs and HCFCs;
In many cases, a plant that has been extracting steam and turning it into power for many years may suddenly stop producing steam.
As in other RES the major disadvantage of geothermal power production seems to be related to the high investment costs. The economic interest of these projects largely depends on the availability of high enthalpy geothermal energy resources, which is limited to few regions in the planet.
19 Maria João Soares
II.1.1.3 - Hydropower
Moving water creates energy that can be captured and transformed into electricity that is called hydropower. Rain or melted snow, usually originating in hills and mountains, create streams and rivers that eventually run to the ocean. The energy of that moving water can be substantial.
Atypical hydropower plant is a system that has three main parts: an electricity plant where the electricity is produced; a dam that can be opened or closed to control water flow; and a reservoir where water can be stored. The water behind the dam flows through an intake and pushes against blades in a turbine, causing them to turn. The turbine spins a generator to produce electricity. The amount of electricity that can be generated depends on how far the water drops and how much water moves through the system. Theelectricity can then be transported over long-distance electric lines to homes, factories, and businesses (National Geographic, 2013).
Hydropower industry is used both for water management and electricity production. The advantages and disadvantages of hydropower utilization can be divided into 3 categories: Economic, social and environmental aspects, as described in the following tables 3 to 5 (Yüksel, 2008).
Table 3 - Economic advantages and disadvantages of hydropower. Source: Own elaboration based on (Yüksel, 2008)
Advantages Disadvantages
It does not require a lot of maintenance which reduces the costs;
Provides high energy efficiency rate;
Hydro Plants have a very long life of around 50- 100 years;
Avoids fossil fuel consumption;
Provides reliable service.
High initial investment;
Requires long term planning and agreement.
20 Maria João Soares
Table 4 - Social advantages and disadvantages of hydropower. Source: Own elaboration based on: (Yüksel, 2008) (Koch, 2002)
Advantages Disadvantages
Secure water supply, irrigation for food production and flood control;
Increasing of recreational opportunities, improved navigation, the development of fisheries, cottage industries, etc.
Creates jobs opportunities.
Involuntary displacement of people from the area to be inundated;
Waterborne disease signs must be checked;
Requires management of competing water uses.
Table 5 - Environmental advantages and disadvantages of hydropower. Source: own elaboration based on (Yüksel, 2008) (Koch, 2002)
Advantages Disadvantages
No Greenhouse Gas Emissions/Air Pollution;
Neither consumes nor pollutes the water;
Often creates new freshwater ecosystems with increased productivity.
Can have negative effects on aquatic and riparian ecosystems;
Barriers for fish migration;
Sediment composition and transport may need to be monitored;
Water quality needs to be managed.
Large hydropower investments, although being a renewable energy option, are frequently prone to controversy and face negative reaction from local population and environmental groups. This is mainly due to the impacts on the ecosystem, the loss of land and the need to displace people from their homelands. However, hydropower plants present important advantages related to their long life, the ability to manage watercourses, their energy storage capacity and their contribution to the dynamic management of the electricity system due to their quick reaction time.
Small hydro power plants (SHP) usually do not have any dam or barrage. If they exist, they are small, usually just a weir, and generally little or no water is stored.
21 Maria João Soares
Normally SHP has a capacity up to 10 MW. The power available is directly proportional to the product of pressure head and volume flow rate.
Water is diverted through an intake at a weir that is barrier across the river which maintains a continuous flow through the intake. Before descending to the turbine, the water passes through a settling tank which the water is slowed down sufficiently for suspended particles to settle out. A pressure pipe, known as a penstock, conveys the water to the turbine that converts the mechanical energy into electricity (Paish, 2002).
Pumped hydroelectricity power plants store energy as water in an upper reservoir, pumped from another reservoir at a lower elevation. During periods of high electricity demand, power is generated by releasing the stored water through turbines in the same manner as a conventional hydropower station. During periods of low demand (usually nights or weekends when electricity is also lower cost), the upper reservoir is recharged by using lower-cost electricity from the grid to pump the water back to the upper reservoir.
The difference between pumped storage stations and traditional hydroelectric stations is that the first ones are a net consumer of electricity, due to hydraulic and electrical losses incurred in the cycle of pumping from lower to upper reservoirs. However, these plants are typically highly efficient (round-trip efficiencies reaching greater than 80%) and can prove very beneficial in terms of balancing load within the overall power system (Electric Storage Association, 2013).
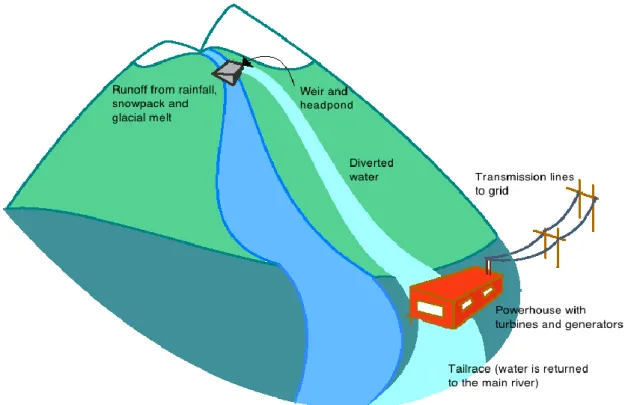
Run of river are those hydro power plants which have no water reservoir, or have it in smaller dimensions. Opting for the construction of this plants means to choose not to keep a stock of water that could be accumulated in a dam. The power comes from the potential energy of water driving a water turbine and generator (Faria, 2012).
Run-of-river power plants need to be built on a river with a steady flow. These plants can only have storage for a maximum of 48 hours of water supply. Fig. 6 describes the operation of a run-of-river power plant. The main structure is simply to redirect water flow from a dam (a small headpond) towards the penstock (delivery pipe), which feeds the water downhill to the power station. The natural force of gravity generates the energy used to spin the turbines located in the power station which
22 Maria João Soares
converts the energy to electricity. After this process, the water is redirected back to the natural flow of the river (Cleantech, 2013).
Fig. 6 - Diagram of a Run of river power plant (EnergyBC, 2013)
Run of river does not require damming like large hydro projects and it has low transportation costs because electricity can be transmitted simply by connecting to the local grid with a small percentage of transmission loss. However, Run of river projects normally produce at a smaller scale than other forms hydro power plants with dams and it can also affect natural habitats.
II.1.1.4 - Energy from de Ocean
There are different sources of renewable energy from the ocean, namely ocean thermal energy conversion (OTEC), wave energy or tidal energy.
OTEC was formulated long ago as a way to recover some of the solar energy stored in warmer oceans. It generates electricity indirectly from solar energy by harnessing the difference of temperature between the sun-warmed surface of tropical
23 Maria João Soares
oceans and the colder deep waters. This procedure happens with the mechanical work in a Rankine cycle, a process which converts thermal energy into kinetic energy via turbines. The turbines can then be used to drive generators, producing electricity (Pelc & Fujita, 2002).
Because of the low efficiency of the process, electricity generation would require very large seawater flow rates of the order of several cubic meters per second per megawatt (Nihous, 2007).
There are two major OTEC facility designs:
Open-cycle - Warm surface boils and generates steam water due to the exposition to a vacuum. The cold water from the ocean is then pumped through a condenser, to condense the team. This constant vaporization and condensation is used to drive a turbine, converting thermal energy into mechanical energy.
Closed-cycle – Creates fresh water as a byproduct. A working fluid with a low boiling point (i.e., ammonia) is used in place of seawater. Both the warm and cold water are passed through heat exchangers which transfer the heat to the working fluid, which then vaporizes and condenses as in the open-cycle facility, driving a turbine and converting thermal energy into mechanical energy.
The main difference between closed and open cycles relies on the relative efficiency. In spite of the higher complexity of closed-cycles, they are significantly more efficient and result in greater output due to the greater efficiency of the working fluid ( National Oceanic and Atmospheric Administration, 2009).
Wave energy comes from the winds as they blow across the oceans. This energy transfer provides a natural concentration of wind energy in the water near the surface. Once created, waves can travel thousands of kilometers and loose only a few of their energy.
The energy fluxes occurring in deep water sea waves can be very high. The power in a wave is proportional to the square of the amplitude and to the period of the motion. Therefore, long period (~7–10 s), large amplitude (∼2 m) waves have energy fluxes normally averaging between 40 and 70 kW per m width of oncoming wave. Nearer the coastline the average energy intensity of a wave decreases due to interaction with the seabed. Energy dissipation in near shore areas can be
24 Maria João Soares
compensated for by natural phenomena such as refraction or reflection, leading to energy concentration (’hot spots’) (Clément, et al., 2002). An important advantage of wave power is that it is available up to 90 percent of the time (Pelc & Fujita, 2002).
Tidal energy is the energy dissipated by tidal movements, which derives directly from the gravitational and centrifugal forces between the three elements: earth, moon and sun. A tide is the regular rise and fall of the surface of the ocean due to the gravitational force of the sun and moon on the earth and the centrifugal force produced by the rotation of the earth and moon about each other (Rourke, Boyle, & Reynolds, 2010).
Tidal power has the distinct advantage of being highly predictable, compared to solar, wind, and wave energy because it occurs twice a day. The energy caption is made through a dam that only captures the energy of the water flowing out of the estuary from high to low tide.
Pelc and Fujita (2002) argue that it is now known that tidal barrages can harm the environment so, recent innovations explore the options of tidal fences and tidal turbines. Tidal fences consist of turbines stretching entirely across a channel where tidal flow sets up relatively fast currents. The turbines are designed to allow the passage of fish, water and sediment through the channel.
II.1.1.5 - Solar Energy
The sun is our main source of energy, ensuring the existence of life on earth. This is a feature virtually inexhaustible and perpetual when compared with our existence on this planet.
In its center, in a region called the solar photosphere, the energy from fusion reactions of the nuclei of hydrogen atoms, helium nuclei, is radiated into space in the form of electromagnetic energy, in a speed of 300000 km per second. This energy, to reach the Earth's atmosphere can be absorbed or reflected by its various components. The spectral distribution of the radiation is composed by radiation in the range of ultraviolet rays (7%), visible light (47%) and infrared rays (46%).
25 Maria João Soares
After going through the atmosphere, on a day of relatively clean sky, solar radiation reaches the Earth's surface with a lower power than 30% in top of the same, that is, approximately 1000 W/m2 (DGEG - Direcção Geral da Energia e Geologia, 2013).
The Sun supplies annually, to the Earth's atmosphere, an enormous amount of energy (valued at 1.5 x 10¹⁸ kWh), corresponding to about 10,000 times the world energy consumption recorded during the same period. However, this source is considered too dispersed, with the advantages and disadvantages that it gives (DGEG - Direcção Geral da Energia e Geologia, 2013).
The sun energy is used mostly for (DGEG - Direcção Geral da Energia e Geologia, 2013):
Heating and lightning buildings, heating water to swimming pools, especially in social equipment, supplying domestic hot water domestic sectors, services, industry and agriculture;
Producing high temperatures used for processing steam or generating electricity, through technologies of radiation concentration.
Producing electricity though the photovoltaic effect converting solar radiation into electricity
Table 6 describes the main advantages and disadvantages of the use of the solar energy for electricity production.
Table 6 - Advantages and disadvantages of solar energy for electricity production. Source: Own elaboration based on (Portal das Energias Renováveis, 2013)
Advantages Disadvantages
It does not cause pollution during its use;
Low maintenance;
Solar collector technology have high power while its cost is reducing;
Availability in remote or difficult places to reach avoiding high investments in transmission lines.
Locations in medium and high latitudes suffer sudden production falls during the winter months due to lower daily availability of solar energy.
Places with frequent cloud cover, tend to have daily production variations.
The storage of electricity from solar energy is still inefficient when
26 Maria João Soares
compared for example to fossil fuels.
There is a production quantity variation according to climate conditions (rain, snow) which requires a storage solution for places where solar panels are not connected to the power transmission network.
Solar power plants can represent an important contribute to ensure access to electricity in remote regions, avoiding high grid transmission expansion costs. However, the costs remain as a fundamental barrier to the effective spreading of these technologies. Also the storage requirements impose higher costs to the system and pose additional technical challenges.
II.1.1.6 - Wind Energy
The power of the wind has been used for at least the past 3000 years. But it was on the 20th century that the first wind turbine was developed. It was evolving through the years and, by the end of the 90’s, wind energy has re-emerged as one of the most important sustainable energy resources (Herbert, Iniyan, Sreevalsan, & Rajapandian, 2007). The wind is in fact a form of solar energy. It is originated from the uneven heating of the atmosphere by the Sun, associated to the irregularities of the Earth's surface and the movement of Earth's rotation. The wind regime is influenced by the shape of the ground, by the plans of water and the ground cover (DGEG - Direcção Geral de Energia e Geologia, 2013).
Wind turbines convert the kinetic energy of the wind into mechanical energy. This mechanical energy can be used for many activities (grinding grain, pumping water) or to power a generator that turns it into electricity that can be injected into the electricity field and distributed to population. Wind power can also have a decentralized application, used only to provide electricity at a particular location located far from the electricity distribution network to consumers.
27 Maria João Soares
Wind turbines have blades that are put in motion by the action of passage of the wind. With this movement, mechanical energy powers an electricity generator that produces electricity. Wind turbines of today can be one of two types (Ackermann & Söder, 2000):
Horizontal-axis - like the old mills. They consist of a tower and a nacelle that is mounted on the top of a tower. The nacelle contains the generator, gearbox and the rotor. Different mechanisms exist to point the nacelle towards the wind direction or to move the nacelle out of the wind in case of high wind speeds.
Vertical-axis - Known by the French scientist Darrieus that invented it, this turbines have the advantage that they operate independently of the wind direction and that the gearbox and generating machinery can be placed at ground level.
The technology of wind turbines has evolved greatly due to technological advances of materials, engineering, electronics and aerodynamics. In general the wind turbines are grouped in a certain place, where the wind conditions are favorable. The energy produced by any wind turbine substantially increases with wind speed. So wind turbines are installed in areas where the wind potential is higher. As the wind speed is affected by soil, relief and increases with height above the ground, the turbines are mounted on high towers (DGEG - Direcção Geral de Energia e Geologia, 2013).
Electricity produced by them is incorporated into the power grid and distributed to consumers in the same way that conventional thermal power stations do.
Table 7 summarizes the main advantages and disadvantages of the use of wind energy for electricity production.
Table 7 - Advantages and disadvantages of wind energy for electricity production. Source: Own elaboration based on (Portal Energia - Energias Renováveis, 2013)
Advantages Disadvantages
It is inexhaustible;
It does not emit greenhouse gases or generate waste during electricity production;
The intermittency, i.e., electricity is produced whenever the wind blows, turning difficult to manage their integration in the grid;
28 Maria João Soares The wind farms are compatible with
other land uses such as agriculture and animal creation;
Wind turbines do not require fuel supply and require few maintenance;
the shock of these in blades and changes in habitats;
Impact noise: the sound of the wind hitting the blades producing a continuous noise;
Visual impact, especially for the residents around, as the installation of wind farms generates a large modification of the landscape.
As most RES, the cost of wind power plants can still be a problem. However the technology is already operating in a commercial scale and is largely disseminated which allowed reducing costs significantly and increasing its economic interest. The variability of the electricity production is a major disadvantage for the grid managers and local and regional negative impacts, such as noise or landscape effects are frequently reported as negative aspects of these plants.
II.1.1.7 - Non-RES
It is also important to highlight other sources of electricity generation technologies that can resource fossil fuel, such as cogeneration, Simple Cycle Gas Turbine (SCGT), Combined Cycle Gas Turbine (CCGT) and coal power plants.
Cogeneration (Combined Heat and Power or CHP) is an electricity production process that combines head and power from renewable or fossil fuels. The main difference between cogeneration and the regular dedicated electricity production is the percentage of energy waste. Cogeneration has as efficiency that can reach 90% or more against 40% of the regular process, as the heat is also used.
To implement a cogeneration process is necessary to have a consuming installation that can make good use of the heat which is provided from the unit.
Cogeneration systems can be divided into three main types of technologies, namely: Alternative engines, gas turbine and steam turbines.
The alternative engines can be diesel cycle or Otto cycle. The first ones are fueled primarily by fuel oil or diesel and the second ones are with gaseous fuels (natural gas,
29 Maria João Soares
biogas or propane). Gas turbines run mainly with natural gas and steam turbines generate electricity by the expansion of the steam produced in a boiler, resourcing to different renewable or non-renewable fuels (COGEN Portugal, 2013).
Table 8 describes the main advantages and disadvantages of the cogeneration Technologies.
Table 8 - Advantages and disadvantages of cogeneration. Source: Own elaboration based on (COGEN Europe, 2013)
Advantages Disadvantages
Low emissions in particular of CO2;
Move towards more decentralized forms of electricity generation;
High efficiency, avoiding transmission losses and increasing flexibility in system use.
Only suitable where there is a need for both electricity and heat on site;
High capital costs;
Not long term sustainable when based on fossil fuel technology.
SCGT consist of a gas turbine that is connected to an electrical generator. Modern gas turbines use a gas compressor, fuel combustors and a gas expansion turbine. Energy is added to the compressed air by burning liquid or gaseous fuel in the combustor which allows air compression. The hot, compressed air is expanded through a gas turbine, which drives both the compressor and an electricity power generator (Siemens, 2013). Table 9 describes the main SCGT advantages and disadvantages.
Table 9 - SCGT advantages and disadvantages. Source: Own elaboration based on (Siemens, 2013)
Advantages Disadvantages
Low investment costs;
High operational flexibility, allowing to be started up quickly, bringing electricity on-line whenever it is needed;
Less efficient than combined cycles;
30 Maria João Soares
Combined cycle power plants are characterized by combining the operation of a gas turbine and subsequent electricity generation and a steam turbine making use of the waste heat from the gas turbine to produce steam and subsequently generating electricity. This combination of two power generation cycles enhances the efficiency of the plant.
Most of the CCGT and SCGT operate using clean energy sources as is the case of natural gas. However, other fossil fuels can also be used for thermal power production, in particular resourcing to steam turbines technologies. Such is the case of coal.
Coal is a combination of solid, combustible, sedimentar and organic rocks that are composed mainly of carbon hydrogen, oxygen, sulphur and moisture and other components. Coal is formed from vegetation that has been consolidated between other rocks and modified by the effects of pressure and heat over millions of years.
Coal has many important uses worldwide. One of most significant uses of coal is electricity generation. Nowadays40% of the electricity consumption is provided by coal and its use has been growing. The last decade’s growth in coal use has been driven by the economic growth of developing economies because it is cheap, abundant, accessible, widely distributed and easy energy to transport, shore and use (International Energy Agency, 2013).
II.2 – The inclusion of RES in the electricity systems
In this chapter, RES power market trends are the focus, addressing the forecasts for the sector and reviewing a few papers debating the possibility of achieving full renewable electricity systems.
II.2.1 - RES market trends
According to the European Commission, the structure of power generation will change significantly in the future. The RES target will cause a major increase in generation from renewables, which continues up to 2030 and will result on a reduction
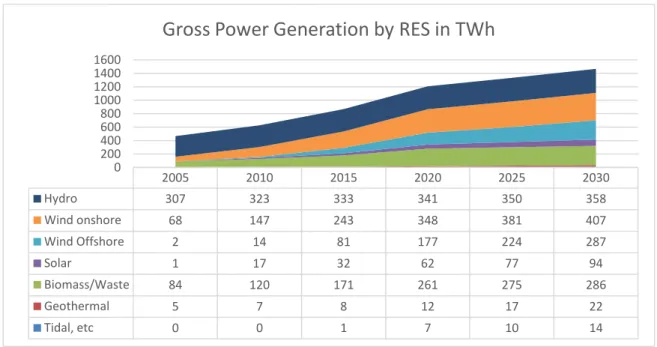
31 Maria João Soares 2005 2010 2015 2020 2025 2030 Hydro 307 323 333 341 350 358 Wind onshore 68 147 243 348 381 407 Wind Offshore 2 14 81 177 224 287 Solar 1 17 32 62 77 94 Biomass/Waste 84 120 171 261 275 286 Geothermal 5 7 8 12 17 22 Tidal, etc 0 0 1 7 10 14 0 200 400 600 800 1000 1200 1400 1600
Gross Power Generation by RES in TWh
of the share of other power technologies. Fig. 7 presents some figures for the power sector, demonstrating the important role of RES in the next years.
Fig. 7 - Power Generation Structure in Europe (European Commission, 2009)
Fig. 8 describes the expected RES evolution from the year 2005 to 2030, detailing the forecasted electricity production from each technology in Europe.
32 Maria João Soares
In general, the electricity generation from RES is expected to present a major expansion. Hydropower production will remain stable but is shares will be decreasing considerably. Wind onshore, wind offshore and solar photovoltaic should present a major growth. Geothermal and tidal technologies both expand but its contribution remains relatively low. . Biomass will have a high increase due to the further implementation of the cogeneration directive. Biomass is seen as a particularly interesting technology as it represents a non-intermittent RES supply option (European Commission, 2009).
RES are expected to reach a 20% share of the total gross final energy demand according to the target for that year. The 10% renewable energy in the transport sector target is also expected to be met in 2020. To achieve the 20% overall target the percentage of RES in heating and cooling should increase to about 21% and the share of RES should further increase to 22.2% by 2030, driven mainly by a stable rise in the electricity sector and a slight increase in the transport sector (European Commission, 2009). Fig. 9 presents a few RES indicators, demonstrating the expected rising importance of RES for heating and cooling, for transports and for electricity sectors. In fact, between 2000 and 2030 the contribution of RES to the total demand will pass from 7.6% to 22.2% in Europe.
33 Maria João Soares
II.2.2 - 100% RES electricity systems
To achieve a 100% RES system in the future departing from the complex power system of today, there is no singular definitive or correct route, but rather a number of differing but complementary paths ( Krajacˇic, Duic, & Carvalho, 2011).
From a technical and operational perspective, optimization criteria include fuel savings, CO2 emissions, reserve/back-up capacity, required condensing mode power generation, minimization of import/export, and the elimination of excess power generation.
Beside economic issues, technical problems are another challenge because of the intermittency of some resources (wind, solar and wave) even on minute or hourly levels. Other sources like hydropower and biomass are not intermittent but are more variable on a seasonal level ( Krajacˇic, Duic, & Carvalho, 2011)
.
In addition, fuel importations and CO2 prices are essential for the analysis.According to Mathiesen, Lund and Karlson (2011), it is possible to divide in three parts the methodology for analyzing the technologies in the renewable energy systems:
The data and technology input phase: this phase has a creative sub-phase that can involve the inputs from experts, a detailed analytical phase involving the technical and economic analyses of the overall system, and possible feed-back regarding each individual proposal.
Adjusting energy systems technically and insuring flexibility: it is crucial to ensure the flexibility and balance between electricity production and consumption with regard to the system’s efficiency and its ability to ensure stability of the electricity grid.
Main technological and social results: strategic electricity planning model that simulates different scenarios with an input/output model. Inputs can be demands, capacities of the technologies included, demand distributions, and fluctuating renewable energy distributions. A high number of technologies can be included for simulation. Outputs can be energy balances, resulting annual productions, fuel consumption, and import/exports.
The calculations in the Energy Plan have been made by comparing different scenarios considering some aspects like costs, CO2 emissions and the different technologies (Mathiesen, Lund, & Karlsson, 2011).
34 Maria João Soares
Some authors studied the possibility to implement a 100% RES system in different countries. In 2010 Ireland had only 3% of renewable energy. Connolly, Lund, Mathiesen and Leahy (2011) used the tool EnergyPlan to simulate all energy-systems behavior that need to be considered when integrating renewable energy: the electricity, heat, and transport sectors. This study illustrated the options available to Ireland to achieve a 100% renewable energy-system. It also demonstrated the importance of designing an effective energy-system, as the same demand can be supplied with much less energy if the energy-system is designed correctly.
Also in 2010, The Australian case was studied in order to achieve a 100% RES power system. This research demonstrated that 100% renewable electricity in 2010 was possible with some particular renewable energy generation mixes including high levels of variable resources such as wind and solar. The principal challenge is found to be meeting peak demand on winter evenings following overcast days when Concentrating Solar Thermal storage is partially charged and sometimes wind speeds are low. The model handles these circumstances by combinations of an increased number of gas turbines and reduction in winter peak demand (Ellsiton, Diesendorf, & MacGill, 2012).
New Zealand was also a target of a study in 2010. Between 2005 and 2007, the country hydro generation dominated energy production with 60% of installed capacity and only 32% of energy was produced by Non-RES technologies. Generation mixes providing 100% renewable electricity system for New Zealand were proposed, and the generation mixes comprised 53–60% hydro, and replacing the 32% of non- RES by 22–25% wind, 12–14% geothermal, 0–12% additional peaking plant, 0.8–0.9%, wood thermal and 0.2–0.3% biogas generation. Wind spillage was minimized, however, a degree of residual spillage was considered to be an inevitable part of incorporating non-dispatchable generation into a stand-alone grid system. Load shifting was shown to have considerable advantages over installation of new peaking plant (Mason, Page, & Williamson, 2010).
The topic of fully RES power system is then being debated across Europe and although a few studies Krajacˇic, Duic, & Carvalho (2011) and Fernandes and Ferreira (2014) already made an attempt to address the Portuguese case, the issue remains far from being fully explored. Next sections will focus on the proposal and application of an optimization approach to analyze high RES systems for the Portuguese electricity system.
35 Maria João Soares
PART III – MODEL IMPLEMENTATION
III.1 - Detailed Methodology