M
ASTER
M
ANAGEMENT AND
I
NDUSTRIAL
S
TRATEGY
M
ASTER
’
S
F
INAL
W
ORK
DISSERTATION
DESIGN IN BUSINESS: AN ON-LINE SURVEY TO PORTUGUESE
INNOVATION-DRIVEN FIRMS ABOUT DESIGN MATURITY
M
ASTER
M
ANAGEMENT AND
I
NDUSTRIAL
S
TRATEGY
M
ASTER
’
S
F
INAL
W
ORK
DISSERTATION
DESIGN IN BUSINESS: AN ON-LINE SURVEY TO PORTUGUESE
INNOVATION-DRIVEN FIRMS ABOUT DESIGN MATURITY
R
UI
M
IGUEL
M
OREIRA DA
S
ILVA
S
UPERVISION
:
P
H
.D.
M
ANUEL
D
UARTE
M.
M
ONTEIRO
L
ARANJA
P
H
.D.
R
ITA
A
SSOREIRA
A
LMENDRA
AKNOWLEDGEMENTS
Writing a Master’s Thesis whiledeveloping one’s personal and professional life is a demanding
challenge. Regardless the effort, such work would not be possible without the support of some key people that made this entire journey possible.
First I would like to express my gratitude to my supervisor Ph.D. Manuel Laranja, whose availability and interest in this research was priceless. His guidance and advices were essential to simplify key research points. Gratitude also to my co-supervisor Ph.D. Rita Almendra, for her contagious enthusiasm and for sharing her experience in the De.:SID research project and related support documentation.
I am also thankful to all the survey participants, since without their collaboration this research would simply not be possible; to Ph.D. Francesco Zurlo, who kindly shared his doctoral thesis, a remarkable document about the strategic dimension of Design; to my work colleagues, in particular to Catarina, Sandra and Thilo whose support and understanding was very important and also to Martin, whose help and feedback about the survey was highly constructive; to my master colleagues João, Rui and Paulo, for all the shared moments and friendship.
I am grateful to all my friends and family for their continuous encouragement and support. Finally I would like to thank to Joana with all my heart. Being a designer, her words: there is
nothing that is not design(ed), sparked my curiosity in researching the links between Design
and Business. I am truly blessed by our friendship and mutual support.
EPIGRAPH
“The dogmas of the quiet past are inadequate to the stormy present. The occasion is piled high
with difficulty, and we must rise with the occasion. As our case is new, so we must think anew
and act anew. We must disenthrall ourselves, and then we shall save our country.”
President Abraham Lincoln, in the Annual Message to Congress, December 1st, 1862
“Design is to design a design to produce a design.”
John Heskett, in Design: A Very Short Introduction, 2005, p.3
“Design in its broadest sense is the most important mental operation for the future. Judgment
thinking is not enough in a changing world because judgment is based on the past. We need to
design the way forward.”
ABSTRACT
In recent years, the Design field and professional designers have been acknowledged as a driver and enabler of innovation, and thus important to key business activities and to firms’
performance and competitiveness. The complex nature of Design still raises obstacles to the comprehension of its activity and results. Research revealed that different firms can have
different understanding of Design’s value potential and that their perception and usage (design
maturity) might play a decisive role in the way design activity is practiced in a firm.
This research intended to investigate and provide insights regarding Portuguese business firms’
perception and usage of Design. For that purpose, the current Design Maturity level of Portuguese innovation-driven firms was described, using the Danish Design Ladder (DDL) framework. A survey strategy was applied, by a self-administered on-line questionnaire based on the De.:SID survey, to a group of 226 innovation-driven SMEs - COTEC Portugal’s Rede
PME Inovação1. A response rate of 33% was achieved and interesting insights were found
about the importance Design can have in a business context.
The main conclusion is that respondents' design maturitycorresponds to the DDL’s third stage:
Design as Process. Moreover, data suggests a difference between firm’s perception and the
actual importance and usage of the Design role in their business, which reveals a certain lack of knowledge and experience in working with Design.
Keywords: Design, Design Maturity, Design Ladder, SMEs, Survey
RESUMO
Nos últimos anos, o campo do Design e os profissionais desta área têm sido reconhecidos como impulsionadores e facilitadores de inovação, possuindo consequentemente um papel relevante nas atividades-chave das empresas, na sua performance e competitividade. A complexa natureza do Design continua a criar obstáculos à sua compreensão e aos seus resultados. Investigações revelam que diferentes empresas têm diferentes noções do potencial valor do Design e que a sua perceção e utilização (design maturity) pode desempenhar um papel
decisivo na forma como as atividades de Design são praticadas na empresa.
Esta pesquisa pretende investigar e contribuir para a melhoria da compreensão, relativamente à perceção e utilização do Design nas empresas Portuguesas. Para tal, o atual nível de design
maturity das empresas Portuguesas orientadas para a Inovação, foi descrito utilizando a
abordagem do Danish Design Ladder (DDL).
A estratégia de inquérito foi aplicada através de um questionário online autoadministrado, baseado no inquérito do De.:SID a um grupo de 226 PME orientadas para a inovação – Rede PME Inovação COTEC da COTEC Portugal. Foi alcançada uma taxa de resposta de 33% e algumas conclusões interessantes foram extraídas sobre a importância que o Design pode ter num contexto empresarial.
A principal conclusão é que a design maturity dos respondentes corresponde ao terceiro estágio
do DDL: Design como Processo. Adicionalmente os dados sugerem que existe uma diferença
entre a perceção das empresas e a real importância e utilização do papel do Design no seu negócio, revelando alguma falta de conhecimento e experiência na sua aplicação.
TABLE OF CONTENTS
ABSTRACT ... iii
RESUMO ... iv
1. INTRODUCTION ... 1
1.1. Research and Problem Contextualization ... 1
1.2. Problem Statement... 2
1.3. Research relevance and objectives ... 2
1.4. Thesis structure ... 3
2. LITERATURE REVIEW ... 3
2.1. The complex definition and nature of Design ... 3
2.2. The relation between Design, Innovation and Competitiveness ... 5
2.3. Design Maturity: The Danish Design Ladder framework ... 9
2.4. The De.:SID research project survey ... 11
2.5. Definition of research questions (RQs)... 12
3. RESEARCH METHODOLOGY ... 13
3.1. A descriptive study of Portuguese firms’ Design Maturity... 13
3.2. Research Design: a survey strategy ... 13
3.2.1. Target Population: innovation-driven business firms ... 13
3.2.2. Sampling: COTEC Portugal’s Innovative SME Network ... 14
3.2.3. Research data collection: self-administered online questionnaire ... 15
3.2.3.1. Pilot-survey ... 16
3.2.3.2. Questionnaire administration ... 16
3.2.3.3. Questionnaire validation procedures ... 17
3.2.4. Data analysis: descriptive statistics & Design Ladder Framework... 18
4. RESULTS ANALYSIS ... 19
4.1. Respondents’ general characteristics ... 19
4.2. Respondents’ perception of Design’s role (RQ1)... 20
4.3. Design activities mostly used by respondent firms (RQ2) ... 26
4.4. Design importance in firms’ innovation activities (RQ3) ... 28
4.5. Firm's evaluation of barriers to Design usage (RQ4) ... 29
4.6. Design Maturity using the Danish Design Ladder framework ... 31
5.1. Main conclusions ... 33
5.2. Research Limitations and future recommendations... 35
BIBLIOGRAPHIC REFERENCES ... 36
APPENDICES ... 40
Appendix A – Self-administered On-line Questionnaire ... 40
Appendix B –Respondents’ General Characteristics ... 45
Appendix C –SPSS Output of Cronbach’s Alpha Coefficient Analysis ... 47
INDEX OF TABLES
TABLE I-MAIN FINDINGS OF DE.:SID SURVEY ...12
TABLE II-ADVANTAGES & LIMITATIONS OF SELF-ADMINISTERED EMAIL QUESTIONNAIRE ...15
TABLE III –CORRESPONDENCE BETWEEN RESEARCH AND SURVEY QUESTIONS ...15
TABLE IV –RESEARCH ACTIVITIES TIMETABLE ...16
TABLE V –CRONBACH’S ALPHA COEFFICIENT ...18
TABLE VI –MAIN CONCEPTS ASSOCIATED WITH DESIGN ...20
TABLE VII –RATING OF ASSOCIATIONS WITH DESIGN ...21
TABLE VIII –MAIN DRIVERS OF DESIGN INSIDE THE FIRMS ...22
TABLE IX –RESPONDENT’S YEARS USING DESIGN ...22
TABLE X –PERCEPTION OF DESIGN IN THE FIRM (2011-2013)...23
TABLE XI –PERCEPTION OF DESIGN IN THE FIRM (2014-2016) ...23
TABLE XII –DESIGN’S IMPACT IN FIRM ...25
TABLE XIII –SOURCE OF DESIGN ACTIVITY...26
TABLE XIV –PEOPLE THAT MOST DIRECTLY WORK WITH DESIGN...27
TABLE XV –PROCESS PHASE WHEN DESIGN STARTS TO BE USED ...27
TABLE XVI –TOP MANAGEMENT INVOLVEMENT WITH DESIGN ...28
TABLE XVII –FUNCTIONS WHO LEAD INNOVATION PROJECTS ...28
TABLE XVIII –RESPONDENTS’ INNOVATION RATE IN PRODUCTS AND PROCESSES ...29
TABLE XIX –DESIGN’S PRESENCE IN INNOVATION ACTIVITIES ...29
TABLE XX –FIRMS PERCEIVED BARRIERS TO THE USE OF DESIGN ...30
TABLE XXI –DESCRIPTIVE STATISTICS OF DESIGN LADDER VARIABLE ...31
TABLE XXII –RESPONDENTS’DESIGN MATURITY LEVEL ...32
TABLE XXIII –COMPARISON DESIGN LADDER VS FIRMS’ PERCEPTION (SQ13) ...32
TABLE XXIV – RESPONDENTS’ MAIN LOCATION ...45
TABLE XXV – RESPONDENTS’ STARTING YEAR ACTIVITY ...45
TABLE XXVI –RESPONDENTS’ SECTOR OF ACTIVITY...45
TABLE XXVII –RESPONDENTS’CLASSES OF EMPLOYEES (2013) ...46
TABLE XXVIII –RESPONDENTS’BUSINESS VOLUME (2011-2013) ...46
TABLE XXIX –RESPONDENT’S TYPE OF CUSTOMERS (2011-2013) ...46
TABLE XXX –SQ15PRINCIPAL COMPONENTS AFTER PCA ANALYSIS ...49
TABLE XXXI -SQ17PRINCIPAL COMPONENTS AFTER PCA ANALYSIS ...49
INDEX OF FIGURES FIGURE 1–THE DANISH DESIGN LADDER (KRETSCHMAR,2003).ADAPTED ILLUSTRATION. ...10
LIST OF ACRONYMS AND ABBREVIATIONS
APD – Associação Portuguesa de Designers2 CPD – Centro Português de Design3
DDL- Danish Design Ladder
De.:SID - Design as a Company’s Strategic resource: Study of the Impacts of Design DGEEC - Direcção-Geral de Estatísticas da Educação e Ciência4
FCT - Fundação para a Ciência e Tecnologia5 FTSE - Financial Times Stock Exchange
GPEARI - Gabinete de Planeamento, Estratégia, Avaliação e Relações Internacionais6 KMO - Kaiser-Meyer-Olkin
PCA - Principal Components Analysis R&D – Research and Development RQs - Research Questions
SMEs - Small and Medium Enterprises
SPSS - Statistical Package for the Social Sciences SQs - Survey Questions
2
Association of Portuguese Designers (free translation)
3
Portuguese Design Centre (free translation)
4
Directorate General of Education and Science Statistics (free translation)
5
Portuguese national funding agency for science, research and technology (free translation)
6
1. INTRODUCTION
1.1. Research and Problem Contextualization
To achieve sustainable growth and prosperity, business firms must adapt to globalization, increasing competition and diverse consumer demand. In this context, innovation is seen as the key driver of competitiveness, economic growth and part of the solution to environmental and social challenges (European Commission, 2009). However, the complexity of the innovation process requires holistic approaches to innovation, particularly from SMEs often with fewer resources available (European Commission, 2009).
In recent years, the development of concepts such as strategic design (Zurlo, 1999; Meroni, 2008), design-driven innovation (Verganti, 2009), design thinking (Kelley, 2001; Brown, 2009; Martin, 2009) and design management (Gorb, 1986; Mozota, 2003), accentuated business
firms’ attention upon Design field as a driver and enabler of innovation activities (European Commission, 2009) in a business context. In fact, the Design field and professional designers, previously considered as a powerful but neglected strategic tool (Kotler and Rath, 1984), are now acknowledged as important to all key business activities (Bruce & Bessant, 2002; Cooper & Press, 1995; Walsh et al., 1992) and thus to firms’ performance and competitiveness
(European Commission, 2009; 2012).
However, the complex nature of Design makes difficult the comprehension of its activity and its results (Cross, 2006; Mozota, 2003). Recent empirical research revealed that different firms can have different understanding of Design’s value potential (Kretzschmar, 2003; Nieminen et
al., 2005; De.:SID, 2007). Business managers might consider Design as (a) not important at all
product/service development process, and; (d) as strategically important to the firm’s identity,
corporate/business strategy and value chain, acting as a permanent catalyst for innovation and sustainability (Kretzschmar, 2003). It is possible thus to infer that the contribute of Design and professional designers to the business field is all but linear and well defined, with different realities existing at the same time at the same place (Heskett, 2005).
It is business managers’ Design awareness that will determine its scope of activity in a business
firm’s value chain (Walsh et al., 1992). In other words, a firm’s design maturity (Walker, 1990)
might play a decisive role in the way design activity is practiced and the contribution strategic designers, design managers and other design professionals can offer to a firm.
1.2. Problem Statement
The Portuguese business industry has in recent years faced economic difficulties caused by severe austerity measures, mostly due to a national debt crisis. In this context, Design’s
potential is recognized by the European Commission (2009; 2012), who aims to enable Design to become an integral part of Europe’s innovation policy, mainly due to its contribute to innovation, quality and to business firm’s non-cost competitiveness (Augusto Mateus & Associados, 2013). This research intends to make a diagnosis of Portuguese business firms’
perception and usage of Design, which from now on will be referred as Design Maturity.
To meet this challenge, this study attempts to provide insights to the following main question:
- What is the current level of Portuguese innovation-driven firms’ Design Maturity?
1.3.Research relevance and objectives
The general objective and main motivation of this research is to analyze and describe the
Design Maturity of Portuguese business firms, in particular innovation-driven firms. Its
in today’s organizations. By “Portuguese business firms” it is meant firms operating in the
Portuguese territory, regardless of its headquarters’ nationality. It is not expected to achieve a general and definitive conclusion but to rise, if possible, interesting ideas and insights about the role and importance of Design in a business context. In the future, this research’s findings may
be useful (a) for promoting the integration of business management and design teaching; (b) for promoting the potential of professional designers; and (c) to inquire if Portuguese
innovation-driven firms are aligned with the European Commission’s innovation agenda for 2020.
1.4.Thesis structure
This research is divided in five sections: (1) the contextualization of the topic, the problem
statement and research’s objectives and relevance; (2) a literature review regarding the aspects that make Design strategically relevant to business firms and the research questions derived from it; (3) the methodology used to address them; and (4) the disclosure of the applied methodology’s results. Finally, (5) the last section discloses this research’s main conclusions, its limitations and recommendations for future investigations.
2. LITERATURE REVIEW
2.1. The complex definition and nature of Design
Although Design’s epistemology and praxiology (Cross, 2006) are not in the scope of this research, it is essential to address Design’s complex definition, nature and goals to facilitate a
more complete and accurate perspective of Design’s value, in a business context. Design is
constantly present in people’s lives since almost everything is designed: work tools, clothes,
Etymologically, “Design” is derived from the Latin de + signare which means to mark out, to
sign (Terzidis, 2007), to designate or to give significance by assigning to a use, a user, or an owner (Krippendorff, 2006). In the English language, depending of the context, the word can refer to (a) a verb or (b) a noun (Flusser, 1999; Mozota, 2003), what is a frequent source of
confusion (Mozota, 2003). Design as a verb can mean “to feign or simulate, to draft, to sketch,
to shape or to proceed strategically”, indicating an intentional activity or process. As a noun it
refers to a “plan, goal, form or fundamental structure”, the outcome of that process (Flusser & Cullars, 1995). This research focuses in the former interpretation, the verb dimension.
Design’s object of study, methods and techniques are not immutable, but always evolving and
adapting to the world’s increasing complexity (Krippendorff, 2006), to the economic and cultural context and to its practitioners and users (Cooper & Press, 1995).
Krippendorff argues that Design is making sense of things (1989; 2006) which implies that
Design intervention is not restricted to products’ properties (form, structure, function and utility). Design can address to other artifacts such as goods, services and identities; interfaces
(e.g. between users and machines); systems and networks, projects and even discourses. Each design discipline can address one or more of these artifacts.
Design’s object of study is thus the artificial world (Cross, 2006; Krippendorff, 2006; Simon, 1969), since its main goal is to create something new (an artifact) that “would not come
naturally” (Krippendorff, 2006, p.25), by generating and communicating specific design proposals (Cross, 2006). For instance, designing a lever to overcome gravity (Flusser, 1999) or changing user’s behaviour towards an object’s manoeuvre. In this sense, “Design is primarily
concerned with problem solving” (Bruce & Bessant, 2002, p.19).
other structured problems; and to (b) ill-defined or wicked problems (Rittel & Webber, 1973;
Conklin, 2006), i.e. unstructured or complex problems: environmental degradation, terrorism and poverty (Rittel & Webber, 1973) and also corporate strategy issues (Camillus, 2008). According to Cross (2006) and Thomas & Carrol (1979), designers tend to treat problems as being ill-defined even when the problems are well-defined, following a solution-focused strategy by iteratively reframing the problem, redefining constraints and goals (Cross, 2006) and generating a series of what if hypothesis, until a promising one emerges for further inquiry
(Schön, 1983), instead of “merely accepting the problem as given” (Cross, 2006, p.77).
The above statements imply that the idea of Design as simply an output, as aesthetics or as art is a partial perspective. Design can also refer to a process of inquiry (Schön, 1983); a core business process (Bruce & Bessant, 2002; Mozota, 2003); a problem solving and creative activity that links consumer’s needs with the potential of a firm. Hence, Design lies in the core of the innovation process (OCDE, 1982; Walsh et al., 1992) and in the heart of the firm itself
(Cooper & Press, 1995).
This research adopts the European Commission’s definition of Design, sufficiently broad to consider all the different roles that design activity can engage in a business firm:
“Design for user-centred innovation is the activity of conceiving and developing a plan for a
new or significantly improved product, service or system that ensures the best interface with
user needs, aspirations and abilities, and that allows for aspects of economic, social and
environmental sustainability to be taken into account.” (European Commission, 2009, p.58).
2.2.The relation between Design, Innovation and Competitiveness
Regarding the role of Design in the innovation process, Walsh et al. (1992) argues that
In fact, while R&D focuses in producing new knowledge that is not necessarily applied to a practical ending and thus it may not lead to innovation, Design can be also important to every innovation, being it radical/disruptive or incremental (Mozota, 2003), and has or can have a more widespread presence in the innovation process, contributing into and outside R&D function (Walsh et al., 1992).
A considerable overlap exists therefore between the two activities, since (a) much of the development work in R&D involves design, such as in providing information on new technological options, new user requirements, new materials and processes, that can guide R&D on new research directions (Cooper & Press, 1995); and (b) Design creates and tests experimental prototypes and other activities that translate the novel idea into a configuration of materials and components (Walsh et al.,1992).
According to Mozota (2003), Design acts as a thermostat for innovation, since it modulates, controls, and encourages creativity in a firm. Design is, however, far from being only focused in technological innovation, as the European Commission report (2009) clearly states. In the last 10 to 15 years, the report argues, there has been a shift towards Design as an essential activity for user-centred innovation in business, by studying users and/or by involving them
through participatory design techniques, such as co-creation, focusing human needs, aspirations and abilities, striving for holistic and visionary solutions (European Commission, 2009), and towards a more strategic perspective of Design in business.
This shift resulted in the development of new design disciplines such as Strategic Design
(Zurlo, 1999; Meroni, 2008), Design-driven innovation (Verganti, 2009), Design Thinking
(Kelley, 2001; Brown, 2009; Martin, 2009) and Design Management (Gorb, 1986; Mozota,
and contribution in a business firm, being therefore impossible to address them in this document, due to space restrictions. However, they all agree that Design can be a holistic, multidisciplinary and cross-functional innovation activity, due to the designers’ skills of acting as gatekeepers (Walsh & Roy, 1985) or knowledge brokers (Mozota, 2003), constantly maintaining
the firm’s focus on the customer (European Commission, 2009).
This allows Design to be present throughout industry in general, and in any firm in particular, becoming more pervasive than innovation itself, in the sense that it is present in other
organizational departments, for example, marketing, manufacturing and corporate strategy (Walsh et al.,1992; Cooper & Press, 1995; Bruce & Bessant, 2002).
The notion of Design and the strategic role of a designer become thus much broader and depart significantly from the popular misconception of Design as simply stylish physical products. It
has an important role in both technological and technological innovation and also in non-innovative activities, which means Design can be important both for research intensive industries, such as consumer electronics, and also to more traditional sectors not concerned with R&D or technological innovation, such as furniture or pottery (Walsh et al., 1992).
This is significant also for SMEs because, although design activity is less capital intensive and has shorter pay-back periods than technological research, it still has the potential to drive and enable innovation and thus firm’s competitiveness (European Commission, 2009).
A number or studies have been developed on the economic importance and value of Design, with some of them focusing in the micro-economic effects of Design, i.e. on firm’s
performance, others on its macro-economic effects. This literature review section focuses on the findings of micro-economic research that conclude Design usage has a positive impact on
employment or exports (European Commission, 2009). Some of these studies are based on self-assessment surveys of firm’s perception and usage of Design and others on statistical analysis. Dosi et al. (1988) showed a correlation between top performing firms and design investment,
which leads to growth and success. Studying firms investing in Design, Roy & Potter (1993) concluded: (a) 60% ran a profitable project; (b) 90% of projects that entered into production were profitable; (c) 40% had increased sales and (d) 13% increased exports. Design is a profitable investment since the return on investment is less than three years, with an
average period of fifteen months (Potter et. al., 1991).
Bruce & Bessant (2002) argue that Design investment allows benefits such as: (a) the increase of profits by increasing sales or by decreasing manufacturing costs; (b) increase market share; (c) gain a competitive advantage; (d) revamp mature and failing products; and (e) provide a strategy for growth facilitating the launching of a new products or services.
The Design Council (2004) studied the impact of Design on stock market performance of U.K. publicly listed business firms. Following the performance of 166 firms, with different Design usage categories, over a period of ten years, the key finding of the study was that a group of 63 firms, identified as being effective users of Design, outperformed the FTSE 100 index over the entire period by 200%.
The Design Innovation Group (Walsh et al., 1992) performed an extensive research on
Design. Design is, they argue, “the vital link between a market need, an invention or innovative idea and its translation into a product suitable of manufacture and use” (Walsh et al.,1992, p.3).
Second, that product design and technological innovation, however well resourced, are not sufficient to ensure, at least in the longer term, the success of a product firm or economy. This is because paying attention to Design enables firms of all sizes, and across many sectors, the opportunity to differentiate from their competitors, and gain competitive advantages.
The third main conclusion is that to be competitive, the critical issue is not to be
design-conscious, but to match the level of their competitors’ commitment and investment in Design,
and specially, to manage Design properly and integrate it with other key business activities. To achieve this, “senior management of the company should fully understand the role of design
and product development in their business and hence make sure that there is clear responsibility
for these activities” (Walsh et al.,1992, p.9). This conclusion is supported by Cooper and Press
(1995), as they argue that “a strategic approach to design at board level elevates design to an innovative process with a long-term horizon.” (Cooper & Press, 1995, p.3)
However, the potential of Design to improve business firm’s competitiveness and innovation performance depends on the firms’ perception and usage of Design. In this context, the Danish
Design Ladder is often used to illustrate the level of design usage in business firms.
2.3.Design Maturity: The Danish Design Ladder framework
The Danish Design Ladder (DDL) was developed by the Danish Design Council as a
Design in firms. The higher a firm was ranked on the DDL, the greater strategic importance they attributed to Design. Hence Danish firms were categorized into four stages of design maturity, depending on their approach to design investment: (a) No Design, (b) Design as
Styling, (c) Design as Process and (d) Design as Innovation, as illustrated in figure 1 below.
Figure 1 – The Danish Design Ladder (Kretschmar, 2003). Adapted illustration.
To a firm or organization at DDL’s first stage, No Design, Design plays a negligible role in the
company, since product development is performed by employees without design-specific education or experience. Additionally, user or stakeholder’s perspectives do not influence the development process. In the second stage, Design as Styling, Design is used as a mean to
develop the form, usability and aesthetics of a product. At this level design activities are developed by designers but most of the remaining people participating in the process have no particular design training or experience. The third stage, Design as Process, is achieved when
firms are able to apply design as a methodology rather than a tool, within its projects. The design process can be adapted to the task and involves a strong consideration of users and stakeholder needs. In the final stage of the ladder, Design as Innovation (or Strategy), Design
aspects and stakeholders of the firm. Hence, the design process is not limited to products, but fused with the firm’s key objectives, playing a role at every stage of the firm’s development. By linking performance data with investment in design, the survey revealed a correlation between high company performance and a higher ranking on the design ladder (Kretzschmar, 2003) and allowed the comparison of firms on a standard scale in terms of their perspective and application of Design. The DDL is a framework that can be used to determine the level of Design Maturity of an organization. Although it is generic and it does not provide insights or instructions on how to integrate design in a firm, the framework also serves as a model to explain that Design is more than merely product styling, allowing firms to reflect about the potential value and incorporation of Design into their business know-how and structure.
2.4.The De.:SID research project survey
The Portuguese research project De.:SID (2007) - Design as a Company’s Strategic Resource:
a Study of the Impacts of Design, funded by FCT - Fundação para a Ciência e Tecnologia7,
intended to make a diagnosis of Design’s use inside the Portuguese Manufacturing Industry.
One of its activities was the development of an on-line questionnaire, by a group of nine researchers from several scientific areas (Design, Economics, Management, Marketing, Engineering and Artificial Intelligence) and two partners: CPD –Centro Português de Design8
and APD – Associação Portuguesa de Designers9. The questionnaire addressed firm’s design
activities and its role in the business between 2005 and 2007, mainly in terms of their perception of (a) Design usage; (b) Design’s drivers and enablers; (c) management’s attitude and action towards design usage; and (d) the evaluation of design’s usage results and barriers (cf. Almendra et al., 2007; Urbano & Rodrigues, 2008). The questionnaire was sent to a sample
of 1405 Portuguese manufacturing firms, of which 99 firms responded (7% response rate). The main findings are shown in the table I below:
TABLE I-MAIN FINDINGS OF DE.:SID SURVEY
Survey Topic Conclusion
Design usage experience Two thirds of firms with less than 19 years Mental associations with Design Innovation; product development; functionality
Drivers for Design usage Firms’ image/reputation; innovation capability
Design maturity level Design as a competitive factor of the firm’s business
Top management involvement 78% with a high or medium involvement with Design Innovation projects leadership 14% lead by designers, only behind top managers
Design integration Conceptual phase - 51%; Development phase - 26%
Design Impacts Firm’s image; communication with clients; customers' satisfaction
Barriers to Design usage Resistance to change; high costs of using design
Each question had a score not visible to the respondents, allowing their design maturity diagnosis, using the DDL framework presented in section 2.3 above.
From the survey’s results, the researchers concluded that Portuguese manufacturing firms, in
general, still underestimated the potential of Design as a strategic resource. Among other factors, this conclusion was due to (a) the reduced experience of firms that use design; (b) the
deficit of designers’ participation both in the strategic level of design intervention and in
innovation projects leadership; with (c) only half of the respondents integrating design in the concept phase, as well as (d) the main barriers identified by the firms to Design usage: resistance to change and high costs of design.
2.5.Definition of research questions (RQs)
Almost a decade after De.:SID’s research, it is interesting therefore to update the assessment of
gathering data to answer these questions will allow achieving the general objective and research problem. The research questions (RQs) are the ones presented below:
RQ1:What is the perception of Design’s role in Portuguese innovation-driven firms?
RQ2:Which and how design activities are most used by these firms?
RQ3:Is design activities’ input considered significant in these firms’ innovation activities?
RQ4:What are the main barriers to design activities identified by the same firms?
3. RESEARCH METHODOLOGY
3.1.A descriptive study of Portuguese firms’ Design Maturity
Following a deductive approach, some theoretical associations between Design and other concepts (e.g. Innovation, Quality), served as basis for this inquiry. In order to classify the
current level of business firms’ Design Maturity, the Danish Design Ladder (DDL) framework
(Kretzschmar, 2003) was applied. The purpose of this research is descriptive, usually used to
“to portray an accurate profile of persons, events or situations” (Robson, 2002, p.59) and to
generate further knowledge about the current status of a subject of study (Gay & Diehl, 1992).
3.2. Research Design: a survey strategy
The Design Maturity phenomenon in a group of Portuguese firms is here studied following a survey strategy, using a cross-sectional and mono-method (Saunders et al., 1997), through a
quantitative data collection technique (questionnaire), analyzed afterwards with a corresponding quantitative data analysis procedure (descriptive statistics).
3.2.1. Target Population: innovation-driven business firms
a higher awareness of Design’s potential and have also more invested resources in acquiring,
developing and using design activities. This was confirmed in a 2008 survey of Swedish firms (SVID in European Commission, 2009) that concluded innovative firms are more likely than non-innovative firms to regard design as a strategy (a high stage on the DDL, cf. section 2.3).
Furthermore, considering the time span available for this research it is more appropriate to focus on a smaller target population.
3.2.2. Sampling: COTEC Portugal’s Innovative SME Network
The sampling method used in this study was a non-probability, purposive, critical case technique (Saunders et al., 1997). COTEC Portugal’s Rede PME Inovação10, with 226
participant firms, was selected as an appropriate sample of Portuguese innovation-driven firms. Created in 2005 by COTEC Portugal - Associação Empresarial para a Inovação11, the network
aims to promote the development of SMEs, through the development and practice of innovation activities. The network has a strong predominance of the Information and Communication
Technologies sector with 81 firms, that represents 36% of the network’s total participants, and
of Industrial equipments (19 firms - 8%), Agriculture and food and Plastics and Moulds (both
with 15 firms - 7%) sectors. The networks’ participants are geographically based across fifteen Portuguese districts, although the two most represented districts, Lisbon (65 firms) and Oporto
(44 firms), account for 48% of the network’s total number of participants12. Being a network of
SMEs, the group presents a certain homogeneity, in terms of firms’ dimension, more similar to
the Portuguese business context: in 2012, SMEs represented 99,9% of the Portuguese business context and 78,1% of its total employment (INE, 2014).
10 Innovative SME Network (free translation)
11 COTEC Portugal – Business Association for Innovation (free translation)
12
3.2.3. Research data collection: self-administered online questionnaire
Considering the research objectives and resources limitations, the self-administered online questionnaire technique was selected. This technique has several advantages but also some limitations, that are highlighted in table II below:
TABLE II-ADVANTAGES & LIMITATIONS OF SELF-ADMINISTERED EMAIL QUESTIONNAIRE
ADVANTAGES LIMITATIONS
Reaches a widely dispersed sample Risk of questions misunderstanding due to absence of interviewer
Respondents more confortable due to the indirect sharing of answers with interviewer
Risk of gap between answers and real practice (Foddy, 1996; Fowler, 1993)
Low requirement of respondents’ availability Risk of survey forfeit before completion
Application of complex skipping logic and other features Risk of respondents being different from adressed target Process speed, cost and flexibility (Couper, 2000) Risk of survey not accessible due to software updates/conflicts
An option was necessary between creating a new or adopting/adapting an existent questionnaire whose scope would match this research’s requirements. De.:SID’s questionnaire, presented in
the literature review (section 2.4), was considered as appropriate since (a) it intended to study the same subject (Design Maturity); (b) it was tested and validated by a group of experts; and (c) it was designed for a similar group of respondents (Portuguese manufacturing firms).
Since the extension of De.:SID’s questionnaire (52 questions) was inappropriate to this research’s constraints, a group of 24 questions that directly addressed the firm’s relationship
with Design was selected from it and can be seen in full detail in appendix A.
Their correspondence with all four research questions is illustrated in table III below:
TABLE III –CORRESPONDENCE BETWEEN RESEARCH AND SURVEY QUESTIONS
Research questions (RQ) Survey questions (SQ) RQ1: What is the perception of Design’s role in Portuguese
innovation-driven business firms? SQ9, SQ10, SQ11, SQ12, SQ13, SQ14, SQ15
RQ2: Which and how design activities are most used by
these business firms? SQ22, SQ23, SQ24, SQ25, SQ26
RQ3: Is design activities’ input considered significant in
these firms’ innovation activities? SQ27, SQ28, SQ29 RQ4: What are the main barriers to design activities
De.:SID questionnaire’s questions and main functionalities and logic were reproduced using
Qualtrics survey platform13. The addition of SQ29, to measure firm’s perception of Design presence in innovation activities, was the only change to the original questionnaire.
3.2.3.1. Pilot-survey
A pilot test was performed to refine the questionnaire and minimize the possibility of
respondent’s difficulties and other unpredicted errors. The pilot survey was sent on April, 2014
to 45 firms (20%) of COTEC’s Innovative SME Network. The response rate of 24% made clear
the need of a strategy to increase the interest on participating in the survey.
Thus Qualtrics survey platform was programmed to provide a brief diagnosis to each participant of its Design Maturity level following the DDL framework, as an immediate incentive for their participation.
3.2.3.2. Questionnaire administration
In the end of April, 2014, a personalized email was sent to the sample through Qualtrics survey platform presenting the study and requesting cooperation in the survey of a top manager or someone who participated in the strategic decision-making process of the firm. The time span of the research activities’ phases is illustrated in table IV.
TABLE IV –RESEARCH ACTIVITIES TIMETABLE
Duration
Preparation January 2014 - April 2014 Data collection April 2014 - June 2014 Data Analysis July 2014 - August 2014
Research Activities
Questionnaire
No definition of Design was provided since the goal was to understand respondent’s main
concepts and associations made with it. Two reminders were sent in May and June, encouraging participation before the deadline of June 30th. A 32,7% response rate was
13
achieved: 74 collected responses from a sample of 226 network participants, which is significant when compared to similar surveys: Designium’s study (Nieminen et al., 2005) with
19,6% and De.:SID (2007) survey with 6,6%.
Respondents’ job roles were mainly CEOs but also quality, innovation, marketing and strategy managers. There were two unfinished surveys that were considered since they were near completion. Apart the display and skip logic cases, there were no unanswered questions due to the platform internal validations. Finally, 77% of the respondents displayed interest in receiving
a copy of this research’s final report.
3.2.3.3. Questionnaire validation procedures
Content validityof construct “Design Maturity” was reinforced since the basis of this research’s questionnaire was De.:SID’s questionnaire, previously developed, tested and validated by a
multi-disciplinary group of experts (cf. Almendra et al., 2007; Urbano & Rodrigues, 2008).
After data collection, factorial validity, a subcategory of construct validity, was assessed
through Principal Components Analysis (PCA), a variable reduction technique that was applied to survey questions SQ15 and SQ17. Further details of PCA analyzes are disclosed in the results analysis section (section 4.5).
Regarding external validity, according to Saunders et al (1997) in a purposive sampling, the
probability of each case being selected from the total population is not known and thus generalization cannot be done based on statistical grounds, but only on logic. Hence this
research’s results and respective findings are only applicable to the survey respondents and not
possible to generalize to other research settings.
Regarding reliability procedures, the internal consistency was examined using Cronbach's alpha
TABLE V –CRONBACH’S ALPHA COEFFICIENT
Survey Question Construct Nr of Questions Cronbach's alpha
SQ15 Design’s Market Impact 8 0,916
SQ15 Design’s Internal Impact 6 0,844
SQ17 Financial Barriers to Design 3 0,817 SQ17 Knowledge Barriers to Design 4 0,896
As illustrated in table V, all Likert-scales used to measure constructs “Design’s Market Impact” and “Design’s Internal Impact” (in SQ15) and “Financial Barriers” and “Knowledge Barriers”
(in SQ17) had a high level of internal consistency as determined by a Cronbach's alpha higher than 0,7 (DeVillis, 2003; Kline, 2005), what indicates SQ15 and SQ17 scale items were well grouped together to measure the respective underlying constructs. Further details of Cronbach's alpha analysis are disclosed in appendix C.
3.2.4. Data analysis: descriptive statistics & Design Ladder Framework
The Design Maturity level of the respondent firms’ was reached by two complementing methods: (a) respondent’s answers direct analysis: after the collection phase, data was automatically transferred from Qualtrics survey platform to SPSS - Statistical Package for
Social Sciences software and analyzed using descriptive statistics, mainly with frequency
results, drawn in tabular and graphical form to identify patterns and trends; (b) dependent variable Design Ladder built upon respondents’ answers: using the collected answers as
independent variables, a score not visible to the respondents was attributed to each response in
Qualtrics survey platform (appendix A).
The scores were based in the De.:SID’s (2007) survey. After the completion of the
questionnaire, each respondent’s overall score was determined by computing the average score
of his answers to a final number between 1 and 4. Thus, the Design Ladder variable corresponds to each respondent’s Design Maturity level, using the four levels of the DDL
Regarding the Design Ladder variable referred above, all questions were scored with the
exception of characterization questions (SQ1 to SQ8) and “end of survey” section (SQ18 to
SQ21). Questions related to barriers to Design usage (SQ16 and SQ17) were also not scored due to the following reasons: (a) questions were not presented to all respondents due to skip logic and (b) stating barriers do not exist does not clarify if that perception is due to a more strategic view of Design or simply because Design activity is not used at all.
4. RESULTS ANALYSIS
4.1.Respondents’ general characteristics
Regarding the demography of the 74 respondents, about 72% are concentrated in three Portuguese administrative districts: Lisbon (24 respondents), Oporto (15) and Aveiro (14). The remaining 28% are distributed between 10 districts (table XXIV).
A significant group (74%) started their business activity until the late nineties and beginning of the XXI century and 19 firms started operating in the last decade (table XXV). The respondent firms operate mainly in the sectors of Information and Communication Technologies (20 respondents), Consultancy (15) and Agriculture and food (5) which accounts for 47% of the respondents (table XXVI).
About 80% have less than 150 employees, being the most relevant class: “10 to 50 employees”
(50%) (table XXVII). In the period 2011-2013, the most represented business volume class (31
firms) was “one million to five million” Euros (table XXVIII) and its main origin (91%) were from other business firms and governmental entities (8%) (table XXIX).
4.2. Respondents’ perception of Design’s role (RQ1)
The following section analysis the results of survey questions SQ9 to S15 that aims to respond to RQ1: What is the perception of Design’s role in Portuguese innovation-driven business
firms?
The first design related survey question (SQ9) addressed the five most immediate mental associations made with Design, from a group of concepts, illustrated in table VI.
TABLE VI –MAIN CONCEPTS ASSOCIATED WITH DESIGN
Score N Frequency Percent Rank
Product development 3 74 51 68,9% 1º
Innovation 3 74 51 68,9% 1º
Marketing 2 74 49 66,2% 3º
Brand building 3 74 48 64,9% 4º
Functionality 2 74 32 43,2% 5º
Concept development 3 74 24 32,4% 6º
Quality 4 74 23 31,1% 7º
Aesthetics 1 74 22 29,7% 8º
Trendy issues 1 74 19 25,7% 9º
Technological development 2 74 18 24,3% 10º
Costs saving 4 74 13 17,6% 11º
Sustainability 4 74 7 9,5% 12º
Research 4 74 6 8,1% 13º
Formgiving 1 74 5 6,8% 14º
Process 2 74 2 2,7% 15º
Other. Which one? 1 74 0 0,0% 16º
Product development and Innovation share the first place of associations made with Design. Marketing, Brand building and Functionality complete the five most selected associations with Design.
According to these results, the association between Design and Innovation, which was the
reason for selecting COTEC Portugal’s Innovative SME Network as this research’s sample, is
TABLE VII –RATING OF ASSOCIATIONS WITH DESIGN
Main concept Score N Min
Value Max
Value Average
Standard Deviation
Coefficient Variation Rank
Product development 3 51 1 5 3,51 1,51 0,43 1º Brand building 3 48 1 5 3,29 1,49 0,45 2º Aesthetics 1 22 1 5 3,18 1,56 0,49 3º Marketing 2 49 1 5 3,14 1,40 0,45 4º Concept development 3 24 1 5 3,08 1,10 0,36 5º Innovation 3 51 1 5 3,04 1,34 0,44 6º Functionality 2 32 1 5 3,03 1,20 0,40 7º Formgiving 1 5 1 5 2,80 1,79 0,64 8º Costs saving 4 13 1 4 2,69 1,38 0,51 9º Research 4 6 2 5 2,67 1,21 0,45 10º Process 2 2 2 3 2,50 0,71 0,28 11º Quality 4 23 1 5 2,48 1,16 0,47 12º Trendy issues 1 19 1 5 2,21 1,51 0,68 13º Technological development 2 18 1 5 2,17 1,25 0,58 14º Sustainability 4 7 1 5 2,14 1,57 0,73 15º
Product development, with an average of 3,51, remained as the strongest association, contrary to Innovation, ranked now in sixth place with an average of 3,04. Brand building (3,29) and Marketing (3,14) continue in the top five. Aesthetics and Concept development complete the five strongest associations.
Despite SQ9 results, when the ranking of those associations (SQ10) is considered, data suggests the association between Design and Innovation is not considered as the most important. Additionally, Sustainability and Research, the two most strategic concepts in the list, were among the least selected and ranked options.
SQ11 inquired about the 10 most relevant factors that act as an engine (drivers) to Design’s
usage in a business context. Following other studies, as Designium (Nieminen et al., 2005) and
TABLE VIII –MAIN DRIVERS OF DESIGN INSIDE THE FIRMS
Driver Category Score N Frequency Percent Rank
Differentiation strategy Strategy 2 74 70 94,6% 1º
Image / reputation Firm 2 74 64 86,5% 2º
Product / Service Firm 2 74 62 83,8% 3º
Company culture Firm 4 74 61 82,4% 4º
Quality requested by the clients Quality 4 74 51 68,9% 5º
Internationalization Strategy 4 74 47 63,5% 6º
Competitors innovation capactiy Competition 4 74 46 62,2% 7º
Diversification strategy Strategy 3 74 44 59,5% 8º
Product's life cycle Industry 3 74 41 55,4% 9º
Clients' complexity Clients 3 74 39 52,7% 10º
Level of rivalry in the industry Industry 4 74 35 47,3% 11º
Technology used in the industry Industry 3 74 35 47,3% 11º
Top Management Firm 4 74 30 40,5% 13º
Learning and Competences Firm 4 74 22 29,7% 14º
Clients / Suppliers business power Industry 2 74 22 29,7% 15º
Company's dimension (production scale) Firm 4 74 18 24,3% 16º
Competitors competences Competition 3 74 18 24,3% 17º
Costs saving Strategy 3 74 16 21,6% 18º
Process Firm 3 74 15 20,3% 19º
Suppliers' complexity Suppliers 1 74 4 5,4% 20º
In the respondents’ context, the main drivers are in a descending order of importance:
differentiation strategy (94,6%), firm’s image or reputation (86,5%), firm’s product or service
(83,8%), firm’s culture (82,4%) and, finally, quality requested by clients (68,9%). These results
are in accordance with De.:SID’s findings: the reason for Design’s use is more related with the
firm’s sphere of influence and less on the firm’s industry, contrary to what was observed in the
Designium survey (Nieminen et al., 2005). Since the experience in Design usage affects not
only the intensity of its usage but also its results (Nieminen et al., 2005), SQ12 asked the
number of years the respondent’s firm used Design. Table IX below shows the existence of a diversified range of Design experience among respondents:
TABLE IX –RESPONDENT’S YEARS USING DESIGN
Frequency % % Cumulative
Less than 10 30 40,5% 40,5%
10 to 19 29 39,2% 79,7%
20 and more 15 20,3% 100,0%
Total 74 100,0%
Missing 0 0,0%
In terms of Design experience 40,5% of the firms have less than 10 years, of which two have no experience at all. 39,2% of firms have between 10 and 19 years of experience and 20,3% use Design for more than two decades, where one firm affirms to have 107 years of Design experience, using Design since its first year of business.SQ13 and SQ14 were related with the perception of Design in the firms. SQ13 inquired the Design activity regarding the period between 2011 and 2013 and SQ14 inquired the prevision for the next three years. The options were directly related with the four stages of DDL.
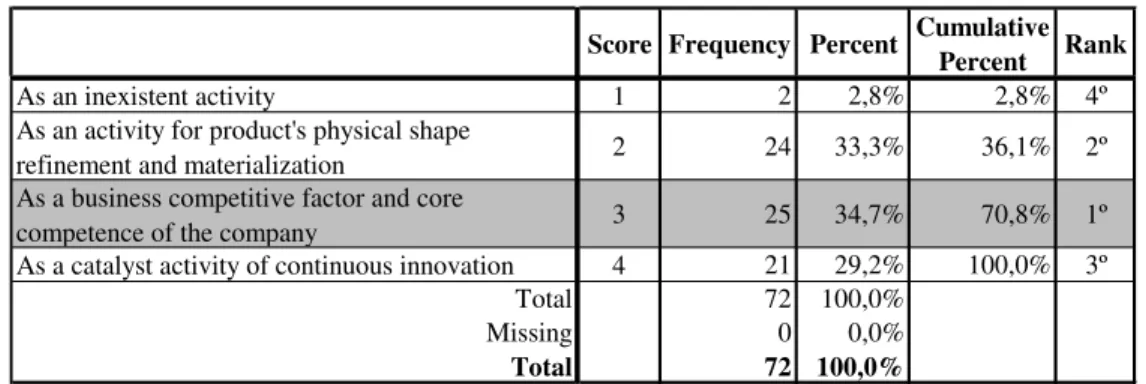
TABLE X –PERCEPTION OF DESIGN IN THE FIRM (2011-2013)
Score Frequency Percent Cumulative Percent Rank
As an inexistent activity 1 2 2,8% 2,8% 4º
As an activity for product's physical shape
refinement and materialization 2 24 33,3% 36,1% 2º
As a business competitive factor and core
competence of the company 3 25 34,7% 70,8% 1º
As a catalyst activity of continuous innovation 4 21 29,2% 100,0% 3º
Total 72 100,0%
Missing 0 0,0%
Total 72 100,0%
Table X above illustrates that Design is perceived by 97% of the firms as present in the firms’
business. 35% indicate Design as a business competitive factor and a core competence, 33%
consider it as an activity mostly used in the product’s shape refinement and materialization and
29% state Design acts as a catalyst of continuous innovation. Only two firms state Design
activity was not developed in the last three years, what is coherent with SQ12 results.
TABLE XI –PERCEPTION OF DESIGN IN THE FIRM (2014-2016)
Score Frequency Percent Cumulative Percent Rank
No 1 4 5,4% 5,4% 4º
As an activity for product's physical shape
refinement and materialization 2 20 27,0% 32,4% 3º As a business competitive factor and core
competence of the company 3 24 32,4% 64,9% 2º As a catalyst activity of continuous innovation 4 26 35,1% 100,0% 1º
0% 5% 10% 15% 20% 25% 30% 35% 40%
As an inexistent activity As an activity for product's physical shape
refinement and materialization As a business competitive factor and core
competence of the company As a catalyst activity of continuous innovation
5%
27% 32%
35%
3%
33% 35% 29%
COTEC (2011-2013)
COTEC (2014-2016)
SQ14 results are displayed in table XI above. Comparing answers between SQ13 and SQ14, the intention to use Design as an innovation driver increases 6%, becoming the most selected
option. The usage of Design as a core competence (32%) and as a product’s shaping activity (27%) decreases. The intention of not developing Design activities increases from 3% to 5%.
Figure 2 –Design’s perceived role in the Firm. Comparison of SQ13 and SQ14
In figure 2 above, the reinforcement of the relationship of Design and innovation dynamics is more clearly shown. The respondents with no Design activity during 2011-2013 and with no foreseen evolution for 2014-2016, skipped questions related with design usage and were directly guided to SQ16 related with barriers to Design usage inside the firms.
SQ15 inquired respondents how they evaluated the impact during the period between 2011 and
2013 of Design’s usage about a group of parameters, using a Likert-scale from 1 to 5. A PCA
was run on a 14-question questionnaire that measured design's usage impact on 69 firms. The suitability of PCA was assessed prior to analysis. Inspection of the correlation matrix showed that all variables had at least one correlation coefficient greater than 0,3. The overall Kaiser-Meyer-Olkin (KMO) measure was 0,86 with individual KMO measures all greater than
0,7, classifications of “middling” to “meritorious” according to Kaiser (1974).
PCA revealed three components that had eigenvalues greater than one and which explained
45,4%, 17,4% and 7,8% of the total variance, respectively. Only when a two-component solution was applied the interpretability criterion was met. As such, two components were retained. The two-component solution explained 62,8% of the total variance. A Varimax orthogonal rotation was employed to aid interpretability. The rotated solution exhibited “simple
structure” (Thurstone, 1947).
Data interpretation was consistent with the design attributes the questionnaire was designed to measure with strong loadings on the eight “market impact” items on Component 1 and on the
six “internal impact” items on Component 2 (cf. table XXXI in Appendix D). Table XII
illustrates the results of SQ15 which are discussed below:
TABLE XII –DESIGN’S IMPACT IN FIRM
Score Impact N Min Value
Max Value Mean
Std. Deviation
Coefficient Variation Rank
Firm’s Image 2 Market 69 2 5 4,33 0,78 0,18 1º Communication with Clients 4 Market 69 1 5 3,93 0,99 0,25 2º Entrance in New Markets 3 Market 69 1 5 3,61 1,22 0,34 3º Increase in the number of new customers 4 Market 69 1 5 3,51 1,02 0,29 4º Sales Increase 3 Market 69 1 5 3,45 1,04 0,30 5º
Increase in the products’ Quality 4 Internal 69 1 5 3,30 1,09 0,33 6º Increase in Market Share 3 Market 69 1 5 3,29 1,10 0,33 7º
More client’s retention 4 Market 69 1 5 3,29 1,02 0,31 7º Increase of products in portfolio 2 Internal 69 1 5 3,19 1,15 0,36 8º Positive variation in return on investment 4 Market 69 1 5 2,88 1,17 0,41 9º
Increase in firm’s productivity 3 Internal 69 1 5 2,68 1,09 0,41 10º Reduction of the complexity of internal
processes 3 Internal 69 1 5 2,39 1,13 0,47 11º Reduction of costs per produced unit 3 Internal 69 1 4 2,13 1,07 0,50 12º Environmental impact reduction 4 Internal 69 1 5 2,04 1,13 0,55 13º
Firms perceive Design to have a higher impact in market/customers related parameters, such as
firm’s image, communication with clients, facilitating entrance in new markets, increasing the
number of new customers and their sales volume. The more internal or traditional parameters as
the reduction of internal processes complexity, costs per produced unit and environmental
These results are consistent with other questions’ results related with the mental associations with Design (brand building and marketing, in SQ9 and SQ10), usage drivers (differentiation strategy and firm’s Image/reputation, in SQ11).
4.3.Design activities mostly used by respondent firms (RQ2)
The following section analysis the results of survey questions SQ22 to S26 that aims to respond to RQ2: Which and how design activities are most used by these business firms?
SQ22 inquired the respondents about the origin of Design activities. Table XIII below shows a total of 46 firms (66%) use both internal and external services, 20 firms (29%) use it exclusively inside and 4 firms (6%) only use design services acquired outside the firm.
TABLE XIII –SOURCE OF DESIGN ACTIVITY
Source of design activity Score Frequency Percent Valid Percent
Cumulative Percent
Only Internal 3 20 27,0% 28,6% 28,6%
Only External 2 4 5,4% 5,7% 34,3%
Both internal and external 3 46 62,2% 65,7% 100,0%
Total 70 94,6% 100,0%
Missing 4 5,4%
Total 74 100,0%
It is not possible to assess if Design has a strategic role in the firm strictly based on the origin of design activity or service. Thus it is also important to understand the type of design activity or service the firm develops or acquires.
SQ23 inquired respondents about the used Design disciplines. The Design disciplines most developed internally are the conceptual, product and model development, activities whose inputs are usually used in an early phase of the development process. Comparatively, the Design services most acquired externally are communication design, brand building design and
exhibition design, mostly used to build and develop a firm’s identity and brand in the market.
TABLE XIV –PEOPLE THAT MOST DIRECTLY WORK WITH DESIGN
Score Frequency Percent Valid Percent
Cumulative Percent Rank
People from Research and Development 4 22 29,7% 31,9% 31,9% 1º People from product development 3 21 28,4% 30,4% 62,3% 2º People from marketing and sales 3 18 24,3% 26,1% 88,4% 3º People from the production development,
including technology 4 7 9,5% 10,1% 98,6% 4º Others* 1 1 1,4% 1,4% 100,0% 5º
Total 69 93,2% 100,0% Missing 5 6,8%
Total 74 100,0%
Design activities interacts the most with people from R&D, product development and marketing and sales. The next question (SQ25) inquired respondents about the phase of the development process Design is first introduced. Only 55,1% of the respondents integrate Design in the conceptual phase and 36% integrate it in the development phase (table XV).
TABLE XV –PROCESS PHASE WHEN DESIGN STARTS TO BE USED
Score Frequency Percent Valid Percent
Cumulative Percent Rank
Concept 4 38 51,4% 55,1% 55,1% 1º Development 4 25 33,8% 36,2% 91,3% 2º Post-production 2 4 5,4% 5,8% 97,1% 3º Detailing 3 1 1,4% 1,4% 98,6% 4º Pre-production 3 1 1,4% 1,4% 100,0% 4º
Total 69 93,2% 100,0% Missing 5
Total 74
About 9% of the respondents use Design on a later development phase, where its impact can be less strategic for the success of products and processes. SQ26 addressed the involvement of top or senior management with Design activity.
TABLE XVI –TOP MANAGEMENT INVOLVEMENT WITH DESIGN
Score Frequency Percent Valid Percent
Cumulative Percent Rank
High involvement (permanent
follow-up) 4 40 54,1% 58,0% 58,0% 1º
Medium involvement (participates
in decision-making moments) 3 24 32,4% 34,8% 92,8% 2º
No involvement 1 3 4,1% 4,3% 97,1% 3º
Low involvement (intervenes only
in moments of crisis) 2 2 2,7% 2,9% 100,0% 4º
Total 69 93,2% 100,0%
Missing 5
Total 74
4.4. Design importance in firms’ innovation activities (RQ3)
The following section analysis (SQ27 to SQ29) aims to respond to RQ3: Is design activities’ input considered significant in these firms’ innovation activities? SQ27 intended to identify the
project leaders of new R&D, Innovation and Design projects. Being areas that allow differentiation from competitors and creating competitive advantages, top managers were naturally the main leaders, especially in a SME business context (table XVII).
TABLE XVII –FUNCTIONS WHO LEAD INNOVATION PROJECTS
Score Frequency Percent Valid Percent
Cumulative Percent Rank
Top managers 3 24 32,4% 34,8% 34,8% 1º
Product engineers 3 13 17,6% 18,8% 53,6% 2º
Product managers 3 10 13,5% 14,5% 68,1% 3º
Marketeers 3 8 10,8% 11,6% 79,7%
Designers 4 8 10,8% 11,6% 91,3%
Specialized technicians 2 4 5,4% 5,8% 97,1%
Others. Which ones? 1 2 2,7% 2,9% 100,0%
Total 69 93,2% 100,0%
Missing 5 6,8%
Total 74 100,0%
Although the association of Design and Innovation has been stated previously, results from SQ27 and table XVII above seem to suggest designers do not usually lead innovation projects, sharing the fourth place with marketers, behind product engineers and product managers.
Interestingly, these results do not follow De.:SID’s findings where, although the target
leading innovation projects with only top managers above them. SQ28 inquired about the
respondents’ innovation rate for the product and process spheres, regarding the last three-year period (2011-2013), illustrated by table XVIII:
TABLE XVIII –RESPONDENTS’ INNOVATION RATE IN PRODUCTS AND PROCESSES
Score N 2011 2012 2013 Average Rank
Products improvement n.a. 64 68,75% 82,81% 95,31% 82,29% 1º Products introduction n.a. 64 70,31% 84,38% 85,94% 80,21% 2º Processes improvement n.a. 63 61,90% 74,60% 93,65% 76,72% 3º Processes introduction n.a. 49 61,22% 79,59% 75,51% 72,11% 4º
Since the respondents integrate an Innovative SME Network, the innovation rates were
significant as expected. Table XVIII shows respondents focus more resources on product innovation rather than on process innovation and more emphasis on improvement activities rather than on generating new products/processes. Afterwards, SQ29 inquired the presence of Design in these activities, in a percentage, in the development of each sphere.
TABLE XIX –DESIGN’S PRESENCE IN INNOVATION ACTIVITIES
0% 25% 50% 75% 100%
1 2 3 4 5
Products introduction 2 8 16 25 13 64 3,61 1,05 1º Products improvement 3 12 20 21 8 64 3,30 1,06 2º Processes introduction 5 19 14 8 3 49 2,69 1,06 3º Processes improvement 9 23 17 10 4 63 2,63 1,11 4º
Mean Std.
Deviation Rank Total
Innovation sphere
Design is more used in the product sphere than in the process sphere. In both spheres, Design is more used to create new products and processes than to improve them (table XIX).
4.5.Firm's evaluation of barriers to Design usage (RQ4)
The following section analysis the results of survey questions SQ16 to SQ17 that aim to respond to RQ4: What are the main barriers to design activities identified by the same firms?