Work Project
Forecast of Risk-Return profile in a changing environment
Name: Dong Trieu Pham Student #: Mst16000578 Due date: May 23rd, 2014
Page 2 of 20
Table of Contents
List of Abbreviations ... 3
1 Brief Context of Business Project ... 4
1.1 Company & Market Overview ... 4
1.2 Business Project Challenge ... 4
1.3 Summary of Conclusions ... 5
2 Further Development on a Specific Topic ... 6
2.1 Approach ... 6
2.2 Limitation: The Attractiveness Indicator ... 6
2.3 Case Study: Mozambique and the Attractiveness Indicator ... 8
3 Reflection on Learning ... 12
3.1 Previous knowledge learned from your Masters program ... 12
3.2 New knowledge ... 12
3.3 Personal experience ... 13
3.4 Benefit of hindsight ... 13
References ... 14
Page 3 of 20
List of Abbreviations
AI Attractiveness Indicator, proxy for present value of after-tax revenues Beta Factor for systematic risk
CRT Country Risk Tool
CTG China Three Gorges
EBITDA Earnings before interest, taxes, depreciation and amortisation EDM Electricidade de Moçambique
EDP Energias de Portugal
EDPR EDP Renováveis (EDP Renewables)
EU European Union
FDI Foreign Direct Investments
GDP Gross Domestic Product
IMF International Monetary Fund
MIBEL Mercado Ibérico de Electricidade
OECD Organisation for Economic Co-operation and Development
NPV Net Present Value
REN Redes Energéticas Nacionais SAPP Southern African Power Pool S&P Standard & Poor’s
US United States of America
WACC Weighted Average Cost of Capital
YoY Year on year
Page 4 of 20
1 Brief Context of Business Project
1.1 Company & Market Overview
Energias de Portugal (EDP) is the main electricity provider in Portuguese generation and distribution. It has a major presence in the Iberian market, Brazil and the US (Appendix 1). In other markets including France, Italy and Poland it is represented through its subsidiary EDP Renováveis (EDPR). The whole entity has emerged as a strong player in renewables, especially in wind power where it holds the third largest portfolio of generation capacity worldwide. Being a major European energy company with a main focus in Iberia, EDP is going through major changes in its business profile, both from an economic and an energy-market perspective. Especially in Iberia, the economic and sovereign crisis has had a big impact on the business environment. In the case of EDP, the effect of the home market impacted the conglomerate’s rating1, resulting in increased financial costs (EDP, 2014). Moreover, Portuguese electricity demand has been decreasing throughout Q1/2011 and Q2/2013 based on YoY data (EDP, 2014). It has recovered slightly since then, but further growth will be limited in a saturated market. Similar trends can be observed for other developed countries. Instead, growth opportunities appear outside of the main markets: Since 2000, electricity consumption has more than doubled in Non-OECD countries while being almost flat for OECD countries (Appendix 2). In addition, European markets are dominated by several players and it is costly to gain further market share. Another trend is the liberalization process in the European Union (EU). In Portugal, retail will be fully liberalised in 2015 and the transition period for generation is ending in 2017. Those development will add further volatility to EDP’s revenues (EDP, 2014). EDP’s main goal setting is therefore to expand and increase the capacity in long-term contracted generation. By diversifying the portfolio and reducing pricing risks, EDP also aims to return to investment grade. In order to cope with the challenges, there has been a trend of consolidation in the industry. Regarding EDP, China Three Gorges (CTG) acquired a 21.35% stake in the utility from the Portuguese state in 2011. In partnership with CTG, EDP will continue to drive the success story in its expansion strategy. In a first step, EDPR has announced to enter the Mexican wind energy market by 2016 (EDPR, 2014). As to date, EDP is screening twelve further countries to invest in.
1.2 Business Project Challenge
The task of the Business Project team has been to support EDP in forecasting the future risk-return profile of the company. Given the fact that the internationalisation strategy is a major
Page 5 of 20
driver in EDP’s future strategy, we have decided to contribute our business project to this matter. The major challenge lies in the selection of prospective expansion candidates:
1) Which country is most attractive in terms of revenue opportunities? 2) Which countries will reduce the sensitivity of EDP to systematic risk?
While the expansion to new markets offers potential growth opportunities and reduce systematic risk for the conglomerate, some (strategic) investors might perceive the move also as adding country-specific risk to the portfolio. Our business project also addresses this issue:
3) How can attractiveness and risk level be compared among countries? 4) How can specific risks be mitigated?
1.3 Summary of Conclusions
Given the criteria that have to be met for an ideal country, there cannot be a straight conclusion: Each energy project is unique in its character and often a result of contractual agreements that determine the specificities. Thus, the project’s goal is rather to develop an approach that identifies attractive expansion candidates and evaluates those in terms of attractiveness and riskiness than giving a definite answer. Two tools have been created to analyse countries on a quantitative level before moving on to qualitative aspects (Appendix 3).
In the quantitative analysis, 81 out of 180 countries performed above the threshold and were considered as attractive in 2015. Thereof, six of the 13 EDP expansion candidates2 were among the 81; including Chile, Columbia, Mexico, Peru, Malaysia and South Africa.Considering Beta, all six would lower EDP’s sensitivity to systematic risk (Beta) with Chile and Malaysia offering the lowest among them. In a further step, countries still considered can be analysed in the Country Risk Tool (CRT) regarding qualitative factors. In accordance with EDP, the four South American countries were assessed in-depth and compared to Brazil. In all cases, the candidates offered a similar or lower risk profile; both in systematic and in total risk. Given that both tools support the attractiveness of the four, those can be suggested to EDP for further scrutiny. Nevertheless, the results have to be interpreted with care, since they only state that the countries suggested are very likely to be a good investment opportunity. EDP has to further conduct industry and financial due diligence in order to evaluate the specific project characteristics. Additionally, elaboration on the best entry mode has to be carried out.
Page 6 of 20
2 Further Development on a Specific Topic
2.1 Approach
As mentioned before, the approach relies on a quantitative and a qualitative assessment of countries. The main focus of this work project will be on the former rather than the latter. In a first step, countries are analysed on their financial and economic business environment.3 This is conducted through a Scoring Model which is based on a Factor Model and the use of Discriminant Analysis. In total, 26 relevant economic, socio-economic, governance and electricity-based factors were collected for all 180 countries in the time period between 2000 and 2012. In order to capture the attractiveness of investing in a country, we have created an Attractiveness Indicator (AI) which is supposed to reflect the present value of after-tax revenues.4 In a next step, it has been assessed which factors (in time t) have a higher significance in explaining the AI (in t+1) through joint and individual significance tests. Based on the list of 26 factors, eight have been found relevant and used as predictor variables.5
The Discriminant Analysis was used to construct the score. This is a categorical dependent variable and requires that the outcomes of the AI have to be classified into the categories “good” or “bad” through a threshold for the AI. From here, the coefficients are derived which can be used to construct the scores and a new threshold (on the score). In order to predict a representative score for 2015 (t+1), 2014 (t) values for the eight factors were simulated. We used World Economic Outlook predictions (IMF, 2014) where available. For the other factors, we created estimates using Monte Carlo simulations while preserving past correlations between the factors. With those, a new score for 2015 (t+1) has been created. It has to be noted that the score is not equal to the AI, but an explanatory variable for it.6
With this approach, interesting geographical market opportunities can be identified. Countries found as attractive can be then compared in the CRT on more country-specific factors.7 The tools created support EDP in choosing candidates, evaluate risks and market conditions.
2.2 Limitation: The Attractiveness Indicator
While the quantitative analysis has general limitations (see Business Project report), the focus in this report will be on the AI as the dependent variable of the predicting model. Undoubtedly, it is the elementary fundament of the model as the estimates of future scores are based
3 Subchallenges 1) and 2); see section 1.3
4 The AI is discussed in detail in section 2.2 as the main limitation of the model
5 These are GDP per capita, population growth, total electricity generation, electricity generation growth, % of
alternative as of total generation, % of urban as of total population, emission of CO2, number of competitors
6 Based on a significance test of the score on the Attractiveness Indicator in 2012: R²=0.6215 7 Subchallenges 3) and 4); see section 1.3 and Business Project Report
Page 7 of 20
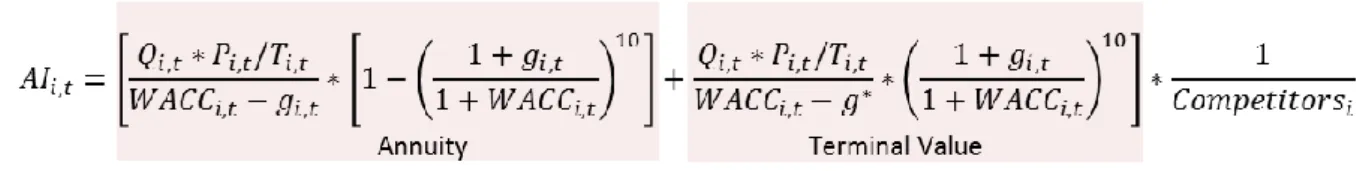
thereupon. It has been constructed as a proxy for the present value of after-tax revenues for an investment in a country:
Figure 1: Attractiveness Indicator
The components for revenue are quantity [Q] and price [P]. For quantity, we used total electricity generation in each country (EIA, 2014) while for price, we chose GDP per capita as a proxy (IMF, 2014).8 Taxes [T] are total tax rates as percentage on commercial profits and are the only costs considered. In order to capture the different growth rates in electricity generation [g], we used an annuity (or convergence) term for ten years and a terminal value with a consistent sustainable growth rate of 2%. A main determinant of the AI is the cost of capital [WACC]. For the risk-free rate, the German 10yr treasury bond yield was used. For the calculation of beta, market betas based on a country’s stock index were computed against the MSCI World Index. Where market performance was not observable, the beta was constructed based on a fundamental and a geographic approach. The average of both was shrunk towards the industry average beta. In order to account for country-specific risks, the market risk premium was calculated individually for each country (Damodaran, 2013). Finally, the present value of the after-tax revenue has to be shared among the players in the market. As a proxy for a potential market share, we divided the term by the number of competitors within the 75% percentile plus one (to account for the new entrant) [Competitors].
Nonetheless, many of the assumptions are arguable, including:
Terminal value growth rate of 2% and convergence term of 10 years
Non-consideration of the cost side: incl. cost of debt, CAPEX, fixed & variable costs Pricing and quantity: In many cases, these aspects are specified through contractual
agreements (Power Purchase Agreements). Moreover, it is questionable whether GDP per capita is a good proxy for electricity prices, e.g. cost for getting electricity in Afghanistan is higher than in the US (World Bank, 2013).9
Accounting for country-specific risk in market risk premium: Referring to Shapiro (Shapiro, 2013), it would be more correct to use the premium demanded by investors and adjust the cash flows based on probabilities instead. However, the implement is
8 The real price for electricity was not available for the majority of the country sample and as a time series 9 However, GDP per capita could be a proxy for profit=revenue-costs which would mean that costs are considered
Page 8 of 20
complex, given that country-specific assessments would have to be conducted and individually implemented for 180 countries.10
Apart from these assumptions, one question stands out: Does the AI and the score as its explanatory variable reflect true attractiveness of a market or are other factors relevant? It might be relevant that electricity markets are not closed but have multinational grid networks that allow the import or export of electricity. Our model mainly focusses on projects that are directed towards the domestic market. Export markets are included in the quantity and the growth rate as total electricity generation and its growth rate are the considered factors. However, other variables are strictly country-specific. Another aspect is the theory of the Best Owner (Koller, et al., 2011), arguing that the value of an investment depends on who owns it. Up to this points, the model is universally applicable. Accounting for the distinctive company profile of EDP would likely add accuracy to the model.
2.3 Case Study: Mozambique and the Attractiveness Indicator
As exemplified, our model might undervalue markets where a high share of electricity produced is exported (Type II error). In discussions with EDP on the model results, Mozambique turned out to be an excellent example where the domestic market is underdeveloped while there is a huge potential for electricity exports to neighbouring countries. In the following, Mozambique, as an example for electricity export oriented market, is analysed in-depth regarding its electricity market. After having discussed its characteristics, suggestions for the improvement of the quantitative analysis are given to incorporate the effects of electricity exports and the Best Owner theory. The analysis will end with a note on Mozambique in specific.
Mozambique has experienced robust real GDP growth rates above 6% for the last ten years and is projected to grow at rates above 8% in 2014 and 2015 (Almeida-Santos, et al., 2014). The main drivers of growth are FDI and increasing public expenditure. As the fast growth remains mainly in the extractive sector, construction, services, transport and communication; the infrastructural demands are enormous. However, due to the fact that most of the growth is experienced in urban areas (urban population ratio of 31%), the electrification rate is only at approximately 12% (Norton Rose Fulbright, 2013). A level of 20% is targeted by 2020. The main feature that makes Mozambique stand out is its membership in the Southern African Power Pool (SAPP). Through the network, it is linked to South Africa, Swaziland and Zimbabwe. The strategic location undoubtedly makes it an attractive country for export oriented electricity generation. Looking at the volume of electricity exported against total generation,
Page 9 of 20
Mozambique is leading by a wide margin compared to its neighbouring countries. 72% of electricity generated in Mozambique were exported in 2011 while at the same time, only 15% are exported from Zimbabwe and 6% from South Africa (Appendix 4).11 The same ratio would yield 8% for Portugal which is integrated in the Iberian electricity network MIBEL. Currently, further transmission network reinforcements are being undertaken to facilitate electricity exports. This is crucial in order to reduce distribution losses (15% ratio against total generation in 2011 compared to 10% in 2000) in the network (Appendix 5).
The major generation plant is located in Cahora Bassa which has a capacity of 2,075 MW, about 85% of the country’s total installed capacity (Norton Rose Fulbright, 2013). The rest of the installed capacity is a mixture of smaller hydroelectric and liquid fuelled power plants. Further projects are in the pipeline with an anticipated worth of US$12 billion, mainly based on new coal and gas reserves being exploited. Yet, the market is not saturated and offers further growth potential. Mozambique exhibits the highest capacity factor in the region together with Malawi (both 78%), implying that the actual output is relatively high compared to the potential output if it were possible to operate at full capacity indefinitely (Appendix 6).12 Another reason for additional investment requirements are the outdated power plants which are mostly operated by state-owned Electricidade de Moçambique (EDM) (Norton Rose Fulbright, 2013).
Regarding the electricity generation technology, Mozambique is most of all interesting for renewables. The government has enforced favourable conditions (Norton Rose Fulbright, 2013) and currently, 90% of total capacity is coming from hydro (Appendix 7). The consulting company Norton Rose Fulbright (2013) has estimated further prospects for up to 190MW of small hydropower capacity on the Zambezi River basin. Also, there is potential for solar power projects, given an average irradiation level of 5kWh per m² per day.
Although there is no independent regulator, the Electricity Law guarantees the participation of the private sector in electricity generation while protecting the interests of the state (Norton Rose Fulbright, 2013). The construction and operation of plants is granted by the Government of Mozambique and implemented through concession contracts in combination with PPAs. Given all the conditions above, Mozambique seems to be a truly attractive market. Due to the close relationship between Portugal and Mozambique and the pre-existence of Portuguese investors in the country13, EDP would have strategic advantages in becoming an operator in the market. EDP would be furthermore a natural choice for the country because it can market itself
11 Not adjusted for intercountry transmissions; moreover, imports are not taken into consideration
12 Appendix 6 also shows that the Portuguese market is quite saturated, given the average capacity factor of 28% 13E.g. Redes Energéticas Nacionais (REN) owns 7.5% of the Cahora Bassa operator (Norton Rose Fulbright, 2013)
Page 10 of 20
as a leader in renewable energy (and hydroelectricity). Therefore, the Best Owner theory could apply to Mozambique in the case of EDP. From the revenue perspective, using PPAs will increase the ratio of long-term contracted business in EDP’s generation portfolio. Investing in Mozambique would be a step to compensate the liberalisation risks in the European markets. Yet, analysing the score for the 2015 AI, we concluded that our model regards Mozambique as unattractive, given a score of 1.88, far below the threshold for the score of 5 (which represents the AI threshold of 731437.37). Moreover, it exhibited values below average in all but one14 factors that contribute to a higher score. South Africa, its neighbouring market, on the other hand, was considered attractive (score: 5.85) because it exhibited values above average for most of the values contributing positively to a higher score.
The question is why then not to invest in South Africa directly? The South African electricity market is dominated by one player. Only since recently, there were calls to enable an attractive environment for private investments (Power Magazine, 2011). Former attempts have failed mainly due to the lack of cost-reflective electricity tariffs and a regulatory framework. Simultaneously, the South African electricity industry is in urgent need of restructuring. After almost no investments carried out for 20 years, “South Africa found itself in the middle of an electricity crisis” (Power Magazine, 2011). In 2008, the net reserve margin (or excess capacity) was at 4.9%, decreasing from 30% ten years earlier (Power Magazine, 2008). Also, the share of renewable compared to total capacity is only at 2%. Entering through Mozambique enables to access an attractive market while some of South Africa’s drawbacks can be avoided as pricing is fixed through PPAs and the regulatory framework of Mozambique applies.
The case of Mozambique might not be unique, but shows a limitation of the model. In a next step, several propositions are suggested in order to incorporate for electricity exports:
Switch from electricity generation to consumption in the AI and account for export potential by including neighbouring countries where multinational grid networks exist15 Account for future potential through higher electricity generation growth in the AI Replace factors that contribute to the score by South African values where appropriate16 Given that the model is based on many assumptions, there is no perfect solution. As the changes for the first two proposition would have to be made in the AI, they would require to run new tests on the factor selection in the Discriminant Analysis and would also lead to new scores, coefficients, thresholds and therefore the results. Changing the factors predicting the score by
14 Electricity generation growth
15 Information about the amount of electricity exported to each country would be used as weights in the formula 16 E.g. if South African prices apply, the proxy for price should be GDP/capita of South Africa, not Mozambique
Page 11 of 20
replacing the values of Mozambique with the values of South Africa on the other hand will change the scores that, however, will not truly predict the AI anymore.
The latter has been analysed in a quantitative way (Appendix 8). Among the eight factors for Mozambique, the values for GDP per capita and urban ratio were replaced by the ones of South Africa in order to reflect the export market. Even so, this would lead to a score of 4.36 (compared to 1.88 with values of Mozambique). In a sensitivity analysis, it can be seen that increasing GDP per capita even above South African values up to US$ 15,000 would not lift the score above the threshold. On the other hand, increasing the urban ratio to 80% would yield scores above. However, both countries are far from that level and even developed countries usually do not exhibit such high values.
Apart from the electricity exports, one should also take a look at another essential aspect: the value of a business depends on who owns or operates it. This theory is called Best Owner (Koller, et al., 2011). The idea underlying is that the value is maximised when it is owned by the entity that can generate the highest cash flows from it. This works both ways: An investment has a different value for each investor, but then, each investment will also have a different value for an investor. Among the criteria for being the Best Owner by Koller, et al. (2011), some might apply in the case of Mozambique for EDP:
Distinctive skills (e.g. in renewables)
Distinctive access to talent, capital, government, suppliers, and customers Better governance
In order to incorporate the Best Owner, one could look at the cost of capital used. It could be argued that investors will demand a lower risk premium given the better use of the assets and the reduced risk. The analysis, however, might be of more qualitative nature.
In general, it can be concluded that without qualitative analysis, final conclusions cannot be drawn. Many specific aspects in a prospective country can’t be easily modelled and information might not be available in numerical form. The CRT is well equipped to illustrate country-specific risks and give a first indication on qualitative aspects.
As a final note, while Mozambique seems to be very interesting, the only recent transformation of the South African market to a more competitive one should also be assessed. In many dimensions, Mozambique might still not be worth the risks (Almeida-Santos, et al., 2014) as it is still an emerging country in its baby steps. This is indicated by the comparison to South Africa in the CRT (Appendix 9; Appendix 10).
Page 12 of 20
3 Reflection on Learning
3.1 Previous knowledge learned from your Masters program
This Business Project differs from most of the others in terms of its level of depth in financial and quantitative approaches. With the background of my Masters in Finance, I have learnt about most of the theories and approaches at least in their basic form. That has been helpful in the quantitative models. The project used fundamental elements of both, Corporate Finance and Financial Markets (e.g. for WACC). Finally, approaches from Financial Econometrics have been used in order to test for significance of the factors and creating the Factor Model.
Additionally, I have been able to apply knowledge beyond what I have learnt in theory. Namely the high amount of group works has been a contributor that facilitated the work in the Business Project: in working with colleagues, organising and structuring. Most of all, the classes and group works in Applied Corporate Finance have enhanced my communication skills. As the project required analysis in Excel, I have used many methods and simplifications that I learnt in the past. While it took me a lot of time to learn them previously, they enabled the whole team to generate extensive results beneficial to EDP and the knowledge of other team members.
3.2 New knowledge
Certainly, there has been also a lot what I have perceived as new. First, the project has been the ideal environment to apply what I have learnt in theory, given the real situation and an existing client. What I have learnt most is that there is no straight-forward application of theory. Many projects rather rely on practical feasibilities than theory, given that the implementation is complex. This was true for the Market Risk Premium and the Beta in this project.17
Second, with the help of my colleagues, the academic and corporate advisors, we have implemented new tools, mainly in the fields of Finance and Econometrics.18 Based on the recommendations, we were able to continuously improve the model and enhance our sight. Third, many assumptions and theories underlying are based on academic literature, mainly Shapiro (2013) on Multinational Corporate Finance; Damodaran (2013) on the Risk Premium; and Koller, et al. (2010; 2011) on basic financial theory and for reviewing.
Forth, the largest learning point is that I enjoyed working on this project and topic despite of the enormous workload. This supports my decision to continue working in the field of Finance. Finally, I have had the opportunity to think about myself from time to time. Also, this review does support me in my reflection about the work process and the group dynamics.
17 Implementation of country-specific risk in risk premium; construction of Beta proxies where no stock market 18 As an example, the Discriminant Analysis as alternative to a linear regression; Bootstrapping; normality testing
Page 13 of 20
3.3 Personal experience
Despite a favourable position due to my academic background, there were a lot of aspects that I did not know before or had to relearn. Supported by the motivation for this project, I worked very hard in order to achieve the goals and support my colleagues where I could. This was being recognised by other colleagues as going the extra mile. Moreover, I consider myself working very detail oriented so that mistakes are avoided as far as possible.
Many aspects about the personal experience in this Business Project is related with group dynamics. Given that I am the only Finance student in this project, I have considered myself being one of the leaders of the project although no formal leader was designated. In this case, having more than one leader added value to the project because we were able to complement and compensate each other. This allowed me to lead in the things we have the natural competence in. Yet, I also asked for support where I did not know how to proceed.
As I see myself strong in working individually, it has sometimes become difficult to distribute tasks, especially in the cases where I considered myself being able to finish in less time and with higher accuracy. This also indicates that I like to be in control of what I am working on. The doubts in delivered work from colleagues has been amplified in some cases where I found several mistakes accompanied with low engagement. Likely, this resulted from the complexity and the required pace in this project. Certainly, I see the group working aspect a field of potential improvement. I believe that every of my colleagues has areas where he or she is strong in. Learning about them allows to add value to the group beyond my knowledge and to learn about my weaknesses. At the same time, it will increase the motivation of my team members.
3.4 Benefit of hindsight
The benefit in working with colleagues from different cultures and academic background was clearly observable already in this project. Every team member who was willing to contribute has been able to add value to this project. We always ensured that every team member understood what the other were doing. This allowed the creation of easy-to-understand/user-friendly tools and the implementation of new ideas throughout all steps. In the end, we were able to deliver a successful project to EDP. Yet, in order to ensure high motivation and commitment in the future, this project should only be offered to students without strong knowledge base either in Finance, Economics and/or Econometrics. Moreover, a more frequent interaction with the company would have been beneficial. These could have been implemented easily through periodic meetings or through working directly at the offices.
Page 14 of 20
References
Almeida-Santos, A., Roffarello, L. M. & Filipe, M., 2014. African Economic Outlook - Mozambique.
Damodaran, A., 2013. Equity Risk Premiums (ERP): Determinants, Estimation and Implications. New York (US).
EDP, 2014. Annual Report 2013, Lisbon (Portugal). EDP, 2014. Results Presentation 2013, Lisbon (Portugal).
EDPR, 2014. EDP Renewables enters the Mexican wind energy market. [Online] Available at: http://www.edpr.com/media/news/?id=38308
[Accessed on 22 May 2014].
EIA, 2014. International Energy Statistics. [Online]
Available at: http://www.eia.gov/cfapps/ipdbproject/IEDIndex3.cfm [Accessed on 22 May 2014].
IMF, 2014. World Economic Outlook (WEO), Washington, D.C. (US): IMF. Koller, T., Dobbs, R. & Huyett, B., 2011. Value. Wiley.
Koller, T., Goedhart, M. & Wessels, D., 2010. Valuation. 5. Edition. Wiley.
Norton Rose Fulbright, 2013. Investing in the African electricity sector – Mozambique – ten things to know, London, UK.
Power Magazine, 2008. Whistling in the dark: Inside South Africa’s power crisis. [Online] Available at: http://www.powermag.com/whistling-in-the-dark-inside-south-africas-power-crisis/
[Accessed on 22 May 2014].
Power Magazine, 2011. Restructuring the South African Power Industry. [Online] Available at: http://www.powermag.com/restructuring-the-south-african-power-industry/ [Accessed on 22 May 2014].
Shapiro, A. C., 2013. Multinational FInancial Management. Wiley. World Bank, 2013. Getting Electricity. [Online]
Available at: http://www.doingbusiness.org/data/exploretopics/getting-electricity [Accessed on 22 May 2014].
Page 15 of 20
Appendix
Page 16 of 20
Appendix 2: Total Electricity Net Consumption (Billion Kilowatthours)
Appendix 3: Project Overview
0 50 100 150 200 250 2000 2001 2002 2003 2004 2005 2006 2007 2008 2009 2010 2011 Re f ye ar 2000 = 100 OECD Portugal Non OECD Colombia
Page 17 of 20
Appendix 4: Electricity Export to Total Generation ratio in 2011 (own calculation based on EIA, 2014)
Appendix 5: Electricity Distribution Losses to Total Generation ratio in 2011 (own calculation based on EIA, 2014)
Appendix 6: Capacity Factor in 2011 (own calculation based on EIA, 2014)
0% 0% 0%
72%
5% 8% 6%
0% 0% 5%
15%
Electricity Exports/Total Generation
12% 105% 7% 15% 25% 8% 9% 7% 20% 24% 5%
Electricity Distribution Losses/Total Generation
0,38 0,30 0,78 0,78 0,46 0,28 0,63 0,32 0,69 0,71 0,42 Capacity Factor
Page 18 of 20
Appendix 7: Renewable Capacity to Total Capacity ratio in 2011 (own calculation based on EIA, 2013)
Urban ratio G DP p e r cap ita 0.1 0.2 0.3 0.31 0.4 0.5 0.6 0.62 0.7 0.8 1000 0.34 1.06 1.77 1.88 2.49 3.21 3.93 4.11 4.65 5.37 1170.23 0.34 1.06 1.78 1.88 2.50 3.22 3.93 4.11 4.65 5.37 2000 0.36 1.08 1.80 1.90 2.52 3.24 3.95 4.13 4.67 5.39 3000 0.39 1.10 1.82 1.93 2.54 3.26 3.98 4.15 4.70 5.41 4000 0.41 1.13 1.85 1.95 2.57 3.28 4.00 4.18 4.72 5.44 5000 0.44 1.15 1.87 1.98 2.59 3.31 4.03 4.20 4.74 5.46 6000 0.46 1.18 1.90 2.00 2.61 3.33 4.05 4.23 4.77 5.49 7000 0.48 1.20 1.92 2.03 2.64 3.36 4.07 4.25 4.79 5.51 8000 0.51 1.23 1.94 2.05 2.66 3.38 4.10 4.28 4.82 5.54 9000 0.53 1.25 1.97 2.07 2.69 3.41 4.12 4.30 4.84 5.56 10000 0.56 1.27 1.99 2.10 2.71 3.43 4.15 4.32 4.87 5.58 11000 0.58 1.30 2.02 2.12 2.74 3.45 4.17 4.35 4.89 5.61 11542.95 0.59 1.31 2.03 2.14 2.75 3.47 4.19 4.36 4.90 5.62 12000 0.60 1.32 2.04 2.15 2.76 3.48 4.20 4.37 4.91 5.63 13000 0.63 1.35 2.07 2.17 2.78 3.50 4.22 4.40 4.94 5.66 14000 0.65 1.37 2.09 2.19 2.81 3.53 4.24 4.42 4.96 5.68 15000 0.68 1.40 2.11 2.22 2.83 3.55 4.27 4.45 4.99 5.71
Appendix 8: Sensitivity Analysis on GDP per capita (column) and Urban ratio (row); Mozambiquan values in light blue and South African values in light violet; values above threshold in green
60% 0% 100% 90% 63% 48% 2% 40% 67% 100% 38%
Page 19 of 20
Page 20 of 20