Breadth of Ownership and Stock
Returns: Evidence from Portuguese
Mutual Funds
Phil Dustin Rose
[email protected]
Dissertation Proposal
Master in Finance
JEL classification: G12; G14
Supervisor
Professor Júlio Lobão
Biographical Note
Phil Rose was born on the 9th of October 1988 on the tiny twin-island Caribbean nation of Antigua and Barbuda. He received his Bachelor’s degree in Banking and Finance from the Faculty of Social Sciences of The University of The West Indies, Mona Campus in Jamaica and is a Certified Anti-Money Laundering Specialist.
Upon completion of his studies he began working as a Research Assistant in the Caribbean 1 Division of the International Monetary Fund’s Western Hemisphere Department. His research interests included the stability and integrity of financial systems and the role of investment in developing countries.
In 2012, he applied for an Erasmus Mundus Scholarship within the framework MUNDUS ACP2 to pursue a Master’s Degree in Finance. He is currently studying in the Faculty of Economics of the University of Porto in Portugal.
Acknowledgements
I would like to express the deepest appreciation to my supervisor, Professor Júlio Lobão, who had the right attitude and was extremely helpful with his comments, guidance and suggestions in order for me to complete my dissertation. Without his guidance and persistent help this dissertation would not have been possible.
I would like to thank the Erasmus Mundus Scholarship Committee who provided me with the opportunity and financial assistance in order to achieve my dreams of completing a Master in Finance.
I would also like to take the time out to thank God, my family and friends who provided me with kind words of encouragement throughout these two years. I could not have completed this dissertation without them.
Abstract
This dissertation focusses on the forecasting power of breadth of ownership of Portuguese mutual funds on stock returns. Firstly, to the best of our knowledge we are the first to conduct such a test using Portuguese data, while most other studies tend to focus on the markets of China and the United States. We utilize a model with differences of opinion and short-sales constraints similar to that of Chen et al. (2002). Using data on mutual fund holdings we find that stocks which are in the lowest tercile (stocks with the largest negative changes in breadth) in terms of change of breadth significantly underperform stocks in the highest tercile (stocks with the largest positive changes in breadth), in one month and one quarter horizons but the results are mixed when looking at longer horizons. We also find evidence to show that short-sales constraints matter for stock returns. Therefore, when short sales constraints are binding stocks prices are high when compared to fundamentals. This proves that our results are consistent with the Miller (1977) model. Further, we show that are results hold during periods of a financial crisis as well. This study also highlights that there are limits to arbitrage, as suggested by Shleifer and Vishny (1997), because of market frictions such as short-sales constraints which can lead to abnormal returns in constraint stocks.
Key-words: Differences of opinion, short sale constraints, breadth of ownership, forecast, returns, mutual funds.
Table of Contents
Abstract ... i
1. Introduction: motivation, aim and research question ... 1
2. Review of the Literature ... 4
2.1 Short-Sales Constraints...5
2.2 Short Interest...6
2.3 Institutional Ownership...7
2.4 Breadth of Ownership...7
2.5 Turnover...9
2.6 Dispersion in Analysts’ Earnings Forecasts...10
2.7 Homogenous versus Heterogeneous Expectations...11
3. The model ... 14
3.1 Breadth and expected returns...16
3.2 Testable hypotheses...18
4. Data ... 21
4.1 Summary Statistics...23
5. Results...27
5.1 Determinants of ∆BREADTH...27
5.1.1 Book-to-market ratio specification...27
5.1.2 Earnings-to-price ratio specification...29
5.2. Using ∆BREADTH to forecast returns...31
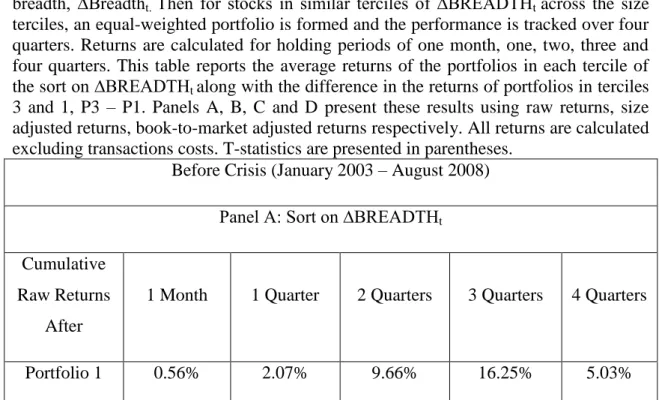
5.2.1 Portfolio Sorts...31
5.3 The Impact of the Financial Crisis...36
6. Conclusion ... 43
Index of Tables
Table 1 Summary Statistics……….………25
Table 2 Specification including BK/MKTt.………....28
Table 3 Specification including E/Pt …………..………30
Table 4 Returns to portfolio strategies for various holding periods..………..32
Table 5 Returns to portfolio strategies for various holding periods (During the Crisis and After the Crisis)………...……….38
1. Introduction: motivation, aim and research question
As of March 2014, there were a total of 174 mutual funds in Portugal managed by 17 different companies. Total assets under management amounted to approximately 8 billion euros a yoy increase of approximately 26%. Thus, this increase shows that mutual funds continue to grow in importance and provide benefits to investors which include portfolio diversification and portfolio management at reduced costs. In addition, mutual funds manage large amounts of assets and for this reason it is also important to study them.
Recently there has been significant research conducted which has focussed on the combined impact of heterogeneous expectations and short sales constraints on the cross-section of stock returns. The idea was first posited by Miller (1977) who suggested that if short sales are constrained the price of a security will be determined by the valuation of the optimists because pessimists will not possess the ability to short and hence are left with no other option but to sit on the side-lines and observe. Hence, the restriction of short-sales can play a significant role in determining equilibrium prices and returns. Even though Miller’s idea has garnered significant attention over the recent years, there is still mixed evidence about the role which heterogeneous expectations and short-sale constraints play in forecasting future returns. The majority of empirical studies seem to focus on the component of short-sales constraints such as D’Avolio (2002) and Boehme
et al. (2006); however empirical studies focussing on differences of opinions are
becoming more popular. There is also some possible behavioural explanations that attempt to explain what causes investors to differ in opinion such as; gradual information flow1, limited attention and heterogeneous priors (Hong and Stein 2007). Earlier studies focussed on short interest, either in the stock market or in the option market for example Figlewski and Webb (1993) and Dechow et al. (2001). Moreover, recent studies have been conducted on actual investors in the actual stock market. Perhaps the most popular example is that of Chen et al. (2002) who coined the term: breadth of ownership, which refers to the number of mutual funds found to have long
1
Gradual information flow refers to the transmission of information that is observed by a particular group of investors that is viewed as sensational to them which prompts them to trade on such information. This initial set of investors will then trade with latter investors who receive
positions in a stock. The focus of the research was to provide a sharper test of Miller’s theory since they deemed that the proxy short interest was insufficient and weak. Chen
et al. (2002) find that there is a positive relationship between breadth of ownership and
security returns. Particularly, they propose that in the presence of short-sales constraints, low breadth of ownership in a specific security may signify that the negative opinions of pessimists are not incorporated into a stock’s price and therefore the price is set based on the opinions of optimists. This results in the stock being overpriced and is corrected shortly which results in low returns being observed.
This dissertation analyses the forecasting power of the change in breadth of ownership in a model with differences of opinion and short-sales constraints. Breadth of ownership refers to the number of mutual funds found to have long positions in a stock which is observed monthly based on reporting requirements. Change in breadth of ownership is determined as the difference in breadth of ownership of a particular security between the present and previous months. The measure of change in breadth of ownership is used as a proxy for heterogeneous expectations since changes in mutual fund holdings can be seen as mutual funds differing in opinion about the value of a security. Change of breadth ownership is used instead of absolute breadth ownership because it can be argued that absolute breadth of ownership can be considered as a permanent stock characteristic. This brings us to the main hypotheses that we attempt to answer in this study:
An increase (decrease) in a stock’s breadth at time t should forecast higher (lower) returns over some future interval from t to t+k.
If there are other time-t variables that are known to be positively related to risk-adjusted returns (perhaps book-to-market, earnings-to-price, or momentum), then breath at time t should be positively correlated with these predictive variables.
After controlling for other known predictors of returns, the ability of breadth at time t to forecast returns should be reduced though not necessarily eliminated.
The main aim of this study is to examine the effect that short-sales constraints and heterogeneous expectations have on the cross-section of stock returns in the Portuguese stock market by focussing on the monthly equity holdings of Portuguese mutual funds. There are a total of 59 mutual funds in our sample from the time period of January 2003 to December 2012. This time period was selected because we believe that ten years will result in a representative sample and it also allows me to investigate the effect if any the most recent financial crisis had on the change in breadth measure.
To the best of our knowledge there has not been a similar study which has focused on the Portuguese market; similar studies undertaken have focused on the United States and Chinese markets. The use of mutual fund data in Portugal provides me with the opportunity to present results from a market that has not been explored since most studies focus on the US and Chinese markets.
Our study will be looking at the monthly equity holdings of mutual funds to see if changes in breadth are able to predict returns for the subsequent month. Further, the findings of the research may prove pertinent to traders and regulators. Regulators may observe that by creating impediments to short selling, they are reducing the efficiency by which financial markets operate. In other words, a security’s price may differ greatly from its fundamental value if short sellers are not allowed to impart their own valuations on a security and in turn cause a downward bias on its price. Additionally, traders may view the breadth of ownership as a robust forecasting indicator and may utilize it in a trading strategy in order to earn significant returns similar to a momentum strategy first posited by Jegadeesh and Titman (1993).
The remainder of this report is organized as follows. In the next section we conduct a review of the existing literature on this topic. In section 3 we outline the model developed by Chen et al. (2002) that illustrates how differences of opinion and short sales constraints affect individual stock prices. Also, in this section we go into further detail about the three competing hypotheses which we aim to test. In Section 4 we describe the data we use to conduct the tests. Our main empirical results are presented in Sections 5 and 6 and in Section 7 we present our conclusions.
2. Review of the Literature
Miller (1977) attests that the greater the divergence of opinion on the return of a security the higher the price compared to its fundamentals. Observed prices in the market often differ from their fundamental price, meaning that there is continuous mispricing in the market and it appears that these abnormal returns are not arbitraged away. For mispricing to continually persist in a market which contains professional investors, limits to arbitrage must exist (Shleifer and Vishny, 1997). If the price or rate of return on a stock is higher than its fundamentals then it can be expected that professional arbitrageurs would attempt to take advantage of such an anomaly in order to earn profits. Accordingly, if mispricing is present but not arbitraged away then it can be reasonably assumed that there are some limits of arbitrage such as short-sales constraints present in the market.
The reasoning behind Miller’s idea appears plausible and simple to understand. As individuals we differ in opinion over a vast range of things no matter the importance, so it should not appear farfetched that we as individuals will arrive at different conclusions about the fundamental value of a security. Differences of opinion may be the root cause for trading volume in financial markets. Harris and Raviv (1993) document that increases in trading among speculators is induced because investors differ on the value of the asset being traded. The end result is that increases in volume leads to positive absolute price changes. Further, various macroeconomists and financial analysts regularly differ on the prospects or the outlook of a firm, industry or on an economy as a whole even though they have access to the same information. Weather forecasters come up with conflicting weather reports despite having access to the same weather data from their various national weather databases. Information is interpreted differently by individuals and could mean different things to each individual.
Miller’s argument comprises of two necessary components: heterogeneous expectations and short-sales constraints. The literature has tended to focus on various proxies of these two components, with studies focusing on breadth of ownership, analysts’ heterogeneous expectations, turnover and short interest.
The remainder of this literature is divided into the following sections in order to sum up the views of past studies on the topic of divergence of opinion and short-sales
constraints. In the next section we focus on the studies that looked at short-sales constraints, followed by those that focussed on short interest. After we then focus on behavioural finance explanations and then institutional ownership. Subsequently we look at studies on breadth of ownership and turnover. Lastly on those studies that looked at homogenous versus heterogeneous expectations.
2.1 Short-Sales Constraints
Miller’s argument was that when there are short sales constraints, a stock’s price will tend to represent the valuation of the optimists and not that of the pessimists simply because they are left with no choice but to sit out of the market because they are restricted from short-selling. On the other hand, Diamond and Verrecchia (1987) state there is no relationship between divergence of opinion and future stock returns. Further to Diamond and Verrecchia (1987) findings, Reed (2002) discovers that stocks which are costly to short sell have larger price reactions to earnings announcement, especially to bad news. According to Reed (2002) short sales constraints are accompanied with a decrease in trading and decreases in the informativeness of trades by 30%. Short sales constraints influence the rate at which privileged information is relayed to the public and leads to informational inefficiency. If traders are rational, then short sale restrictions will not lead to biased upward prices. Prices should not be biased upward in the presence of short sales restrictions because if traders are rational they will not overreact to news and cause a stock to trade higher than its fundamentals. In this case there should be no need for short-selling if traders are rational. Diamond and Verrecchia (1987) argue that Miller’s model should be seen as a measurement of how fast information is incorporated into prices. In other words, good news is incorporated into prices at a faster pace than bad news. Bad news is not revealed as fast because pessimists are restricted from selling short, restricting them from acting on the information. Therefore, the implications of short sales constraints are related to a reduction in the speed in which prices are able to adjust to information and it is this slow pace that impacts the future returns of a security and not divergence of opinion.
Further, Shiller (2003) states the true cost of shorting stocks is not represented solely by the explicit cost of borrowing the shares because it excludes the psychological costs that play a part in restraining short selling. One of the psychological costs includes the
unlimited loss potential associated with shorting stocks. A further restriction to shorting is presented by Kahneman and Tversky (1979), who show that investors find it difficult to close short positions when they are experiencing losses because of the pain of regret associated with losses. In fact, investors tend to get far more upset by losses than they are satisfied with gains. With the unlimited potential for losses involved with short selling individual investors will tend to avoid such situations that could involve in them facing such a difficult psychological dilemma.
2.2 Short Interest
The earlier relevant empirical research has focussed on the relationship between short interest and expected returns. Short interest refers to the total amount of shares that have been sold short but not yet covered. It is considered a market sentiment indicator that tells whether investors think a stock’s price is likely to fall. It is derived by dividing the number of shares sold short by the total number of outstanding shares. Gopalan (2003) documents that short interest is positively related to disagreement amongst investors. Further, he shows that while using short interest data as well as additional proxies; analysts forecast dispersion, institutional holdings and turnover, stocks which are more short-sales constrained tend to earn lower returns to a tune of 0.19% to 0.89% monthly. Asquith et al. (2005) attest that stocks with high short interest underperform the market return measured by four factor time series regression models. In fact, based on equally weighted portfolios, stocks with lower institutional ownership coupled with high short interest have more negative returns.
High lending fees are associated with stocks with high divergence of opinion and these stocks are also faced with the larger risk of being recalled by their lenders (D’avolio, 2002). Certainly if short interest is used as a proxy for divergence of opinion then those stocks which experience higher divergence of opinion will prove too costly to short and the subsequent increase in turnover makes the recall of the loan more likely. Consequently, differences in short interest amongst similar stocks may be as a consequence of the many risks or the high costs involved for actually shorting these stocks. D’avolio (2002) elaborates that short sellers face many costs which may include the risk of recall and even though most stocks can be borrowed and shorted, the differences in the costs to short may indeed be reflected in differences of short interest.
This creates an interesting dilemma because a stock which has low or zero short interest may indeed just be one which is too difficult or costly to short, this can simply be interpreted as instead of less, more negative information is held off the market.
2.3 Institutional Ownership
Nagel (2005) posits that short-sales constraints are most likely to constrain stocks which have low institutional ownership because professional investors are prohibited from selling short so they cannot trade against the overpricing of a particular stock. Institutional investors are likely to be more sophisticated when compared to individual investors, therefore if a stock becomes under-priced sophisticated outside investors can exert buying pressure. In the other scenario when a stock becomes over-priced sophisticated outside investors are not able to exert downward pressure because they are restricted from selling short but existing sophisticated investors will sell the stock in this scenario. Further, Nagel (2005) found that the loan stock supply needed in order to go short is higher when institutional ownership is high. Thus, stocks with low institutional ownership are most likely to be more constrained because of short sales restrictions and limited stock loan supply. Additionally, it can be said that because institutions or professional traders are considered to have better stock picking skill than individuals it can be expected that stocks with lower institutional ownership will underperform. Almazan et al. (2004) document that approximately 70% of mutual funds in the United States during the period 1994-2000 that filed Form N-SAR reported that they were formally restricted from short-selling due to their investment policies. In fact, in the study only 9.8% of the mutual funds that were allowed to short-sell actually did. As well, Koski and Pontiff (1999) establish that 79% of equity mutual funds do not make use of derivatives, signalling that funds are not using alternative methods to sell short. Further proof comes from Asquith et al. (2005) who state that short sales constraints tend to bind when there is strong demand but a limited supply of a shares. In other words, short selling is more restrictive in the event that a security’s price is trading higher relative to its fundamentals and when institutional ownership is low.
Chen et al. (2002) looked at the term breadth of ownership as a proxy for divergence of opinion. If there is a reduction in the number of owners of a particular security, Chen et
al. (2002) deem this to be a reduction in ownership breadth which is associated with
low future returns. Their argument is similar to that of Miller’s because they impose short-sale constraints on their model which restrict mutual funds from selling short. The reduction in the number of mutual funds with long positions in a stock can be seen as a negative signal similar to that of short interest, so in that regard breadth of ownership can be seen as a proxy for short interest. Particularly, Chen et al. (2002), propose that in the presence of short-sales constraints, low breadth of ownership in a specific security may signify that the negative opinions of pessimists are not incorporated into a stock’s price and therefore the price is set based on the opinions of optimists. This results in the stock being overpriced and is corrected shortly after which results in low returns being observed. In the event a fund receives negative information or bad news pertaining to a security, they will reduce their holdings to zero because of the restriction imposed. They focus on the quarterly equity holdings of mutual funds for the period of 1979 to 1988 and find that there is a positive relationship between breadth of ownership and security returns. In fact in the study, stocks whose change in breadth in the previous quarter is in the lowest decile (highest negative changes in breadth) underperform stocks in the highest decile (highest positive changes in breadth) by 6.38% a year. Thus, as the number of mutual funds which are long in a stock decrease, this is seen as a reduction of ownership breadth and hence predicts subsequent low future returns. Turning to the markets of Shanghai and Norway, Choi et al. (2013) and Priestley and Ødegaard (2005) find results similar to that of J. Chen et al. (2002) that changes in breadth of ownership of mutual funds is positively related to future returns. However, because their data allows them to focus on the complete ownership structure of stocks they find that while focussing on solely the retail sector the effect is different, retail breadth of ownership is negatively related to security returns in Shanghai and Norway respectively.
On the other hand, Nagel (2005) and Bodnaruk and Ostberg (2009) document results to the contrary of Chen et al.’s (2002) study. For instance, Nagel (2005) finds that expanding the Chen et al. (2002) sample by five years to 2003; stocks with reduction in breadth outperform stocks with increases in breadth by a significant margin. Nagel posits that the contrary results he documents could be probably related to the technology
bubble. Bodnaruk and Ostberg (2009) using data on the Stockholm Stock Exchange and focussing on the period of 1996 to 2001 document a negative relationship between change in mutual fund breadth and stock returns.
Focussing on a wider shareholder base, Peress (2005) using data on British American Depositary Receipts suggests that an increase in breadth of ownership results in improved risk sharing while larger informativeness reduces risk resulting in a decrease in mean and variance of returns. Assuming that shares are widely distributed, companies that are widely held or otherwise have many shareholders are more susceptible to divergence of opinion and hence their prices are more likely to reflect the valuation of the optimists. The increase in the shareholder base limits the risk shared by each shareholder and the amount of information in the price of a security increases the probability that the valuation is correct hence limiting the volatility of returns. In other words, an increase in breadth of ownership results in a decrease in returns because as the shareholder base increases investors have less incentive to search for private information because each individual shareholder bears less risk.
2.5 Turnover
Turnover has also been used as a proxy for divergence of opinion. Lee and Swaminathan (2000) and Boehme et al. (2006) using turnover as a proxy suggest that high dispersion firms, those firms with the largest amount of turnover have a tendency of earning lower future returns while low dispersion firms earn higher returns. In essence it appears that low volume firms tend to be undervalued by the market while high volume firms are overvalued. Focussing on the Internet bubble Ofek and Richardson (2003) find that over the period from 1997 to 2002 the extraordinary increases in the prices of Internet stocks were accompanied by an extreme explosion in trading volume. They also find further evidence that there were substantial short-sales restrictions for Internet stocks during the period meaning that investors who were pessimistic about prices were unable to impart their beliefs on the stock by short selling and leading to a reduction in the price towards its fundamental value. In particular, in early 2000, the Internet sector represented roughly 20 percent of the equity traded volume on the market at this time. Gervais et al. (2001) document similar results and state that stocks which experience abnormal high (low) trading volume relative to their
normal volume levels, over a day or a week tend to increase (decrease) over the course of the following month. It appears that trading volume can be deemed an indicator of investor sentiment, when prices appear to be high in relation to their fundamental values this is accompanied by abnormal trading volume (Hong and Stein, 2007). However, the use of turnover as a proxy is somewhat controversial since Jones et al. (1994) posit that it is the number of transactions and not necessarily the size of transactions that contains information content. Consequently, volume of turnover may not be a suitable proxy for measuring divergence of opinion.
Further testing of the Miller (1977) hypothesis has been also undertaken on the IPO market. In the IPO market short selling is constrained even though the restriction is steadily removed over time, so the initial IPO market price is free to converge to its fundamental value which leads to underperformance in the long run. Short sales constraints lead to the price being set by the optimists because they will show their approval by purchasing the shares while the pessimists have no choice but to stay out of the market. Loughran and Marietta‐Westberg (2005) use a large sample of new issues of IPOs and SEOs and focussed on the subsequent stock performance following an extreme price movement within the first three years after the offering. After a positive or negative +/- 15% one day return event, strong underperformance subsequently follows and recorded returns are significantly short of the predictions of the four factor model. Using turnover as a measure of divergence of opinion, the authors’ document that extreme event days are associated with wide divergence of opinion and there is a negative linkage between higher levels of divergence of opinion and future stock performance. Gao et al. (2006) using early market return volatility, a proxy for divergence of opinion is negatively related to subsequent IPO long term excess returns and is highly significant for up to three years after the initial offer. Moreover, the relationship is stronger in IPO markets where the short sales constraints is stronger, than in non-IPO markets, thus adding support to Miller’s hypothesis. It appears that the initial prices in an IPO offer are inflated by the purchases of optimists but as a result of the divergence of opinion they are subject to subsequent long run underperformance.
Diether et al. (2002) utilize the dispersion in analyst earnings per share forecast as a proxy for differences of opinion. They document that stocks with higher dispersion in analysts’ earnings forecasts typically earn lower future returns than otherwise similar stocks. In fact, a portfolio of stocks in the highest quintile of dispersion underperforms a portfolio of stock in the lowest quintile of dispersion by an annual rate of 9.48%. This occurrence is most prevalent in small stocks and stocks that have performed poorly over the past year. The study coincides with Miller (1977) because the authors show that any friction which hampers the divulgence of negative information can be viewed as an alternative mechanism to the short-sales constraints emphasized in the Miller model. Analysts tend to avoid giving opinion on stocks which they deem to possess a poor outlook simply based on the incentive structure in place; it is highly unlikely that there is any incentive involved for analysts who give a negative opinion on a particular stock. Thus a stock which should receive a negative outlook or sell recommendation will not receive such because of analyst reluctance to state opinions on such stocks.
Doukas et al. (2006) examining the relationship between analysts’ heterogeneous expectations and stock returns document results which are contradictory to those of Diether et al. (2002). Using a diversity measure provided by Barron et al. (1998) to capture divergence of opinion and four levels of short selling constraints Doukas et al. (2006) show that divergence of opinion is priced at a discount meaning stock returns are positively associated with divergence of opinion. They further state that the results in Diether et al. (2002) study could be documenting negative association between uncertainty in analysts’ earnings forecasts and stock returns. Evidence of this negative association has been found in the studies of Pástor and Pietro (2003) and Jiang et al. (2004). Their conclusions provide no support for Miller’s 1977 overvaluation hypothesis.
2.7 Homogenous versus Heterogeneous Expectations
As mentioned earlier, the study may provide evidence that there are limits to arbitrage in the market and also provide evidence to the contrary that markets are efficient. The proponents of rational finance argue that the future returns of a stock should be directly related to its riskiness; the risk/reward ratio but past research has shown that other variables with no relation to risk are able to forecast returns, both in the time series and
in the cross section. Also, based on the efficient market hypothesis investors should have homogenous expectations and markets should be frictionless, meaning there should be no constraints to short selling. On the other hand, we have seen that many studies focus on the impact divergence of opinion and short sales constraints have on financial markets.
But what induces disagreement of opinion amongst investors, especially since rational finance would like us to believe that all investors have homogenous expectations. Perhaps, Hong and Stein (2007) surmises it best by stating that the three mechanisms that creates disagreement among investors are; gradual information flow, limited attention and heterogeneous priors. In terms of limited attention investors are only capable of paying attention to a subset of relevant information and the impact of this limited attention on stock prices and volume is dependent on how the information is displayed to the public, in other words how sensational the information is. DellaVigna and Pollet (2005) provide evidence that shows when a firm publishes earnings on a Friday, the subsequent volume and price movements is less when compared to announcement made on other days of the week. They give a possible explanation and state that the reason for this is because over the weekend the information is somewhat forgotten because investors become distracted and forget about the news on Monday morning when they have the opportunity to act upon it.
The concept of heterogeneous priors has been detailed extensively above. Hong and Stein (2007) add another spin to it by postulating that a number of investors that observe the same earnings announcement may trade together because they all revise their valuation of the stock. Lastly, in terms of gradual information flow, certain investors will receive value relevant information before others because of technology of distribution or investor specialization. If the piece of information is positive investors who receive it first may revise their valuation upwards while those investors who have not been privy to the news as yet remain with their previous valuation. The end result is that the first set of investors will initiate trade with the latter set of investors. Huberman and Regev (2001) provide the perfect example to help to explain the gradual information flow concept. They examine the stock behaviour of a biotechnology company; EntreMed which possessed the licensing rights of potential new cancer-curing drugs. The company was featured in the New York Times in an attention
grabbing feature about a breakthrough in cancer research, which subsequently led to an increase in the stock price from $12 to $52 in one day.2 However, the same information was printed six months before in the scientific journal Nature and in the New York Times albeit in a less high-profile article. While the company experienced an increase in stock price from the initial article, it paled in comparison to the latter increase after it was published on the front page. The conclusion is that a small group of investors who focus on the particular industry and that read the scientific journal received the information initially while a larger group got the information afterwards upon reading the feature. The end result was that the market took several months to fully incorporate the news into the stock’s price and the first group of buyers benefit because they do not revise their valuation upwards and are able to trade with the larger group of buyers. Decades after Miller (1997) initially floated the idea that short-sales constraints and divergence of opinion affect the future price of a security. There appears to be general agreement that short-sales constraints and divergence of opinion do indeed affect the price of a security. Various authors use various proxies such as turnover, breadth of ownership and dispersion in analysts’ expectations for divergence of opinion. On the other hand, there is no clear consensus as to whether divergence of opinion is positively or negatively related and if it even has any relation with future stock returns. In addition, we provide various explanations as to what may cause disagreement amongst investors.
2
3. The model
We use the model developed by Chen et al. (CHS) (2002). The model considers the pricing of a single stock and has two dates. There is an aggregate supply of Q shares of the stock which pays a terminal dividend of F + ε per share at time 2 where ε is a normally distributed shock which has a mean of zero and a variance of one. At time 1 two different types of traders exist. There is a group of buyers who face short-sales restrictions and can only take long positions; these buyers can be considered to be mutual funds. There is a constant supply of such buyers with valuations, evenly distributed on the interval [F-H, F+H]. It is expected that on average the buyers have the correct valuation, but there is heterogeneity amongst the group, with the degree of the heterogeneity parameterized by H.
The total size of the buyer population is conformed to one and each buyer possesses constant absolute-risk-aversion (CARA) utility, with a risk tolerance of γB. Therefore, with the non-existence of short-sales constraints, a buyer i with valuation of Vi would have demand γ(Vi-P). On the other hand because of the constraint, observed demand is restricted to Max [0, γB(Vi-P)].
The second group of traders belong to a group of fully rational arbitrageurs which are capable of taking both long and short positions. This group of buyers can be thought of as hedge funds, which face no short-sales restrictions and have the skills and resources to minimize any frictional costs accompanied with such transactions. The arbitrageurs also possess CARA utility and their accumulated risk tolerance is γA, so that their total demand is represented as γA(F-P).
In the event short-sales constraints did exist for the buyers, market wide demand at time 1, represented by QDU would be given by:
∫ B ( P) d + (F P). (1)
Performing the integration given in equation (1), and setting the demand QDU equal to the supply Q, it can be easily illustrated that the price at time-1 in this unconstrained case, depicted by PU, satisfies:
When there are no short-sales constraints, heterogeneity of the buyers have no effect on price. In other words the valuations of the optimists and pessimists offset each other and the price observed is the same if all buyers had the rational expectations given as F. Moreover, when there are short-sales constraints, market wide demand, now represented by QDC is given by
∫ B ( P) d + (F P). (3)
After performing the integration and setting the market clearing condition that QDC = Q we obtain a quadratic formula which gives the two roots given below:
( √ )
Note that it is not possible for the larger of the two roots to be an equilibrium price because it exceeds the highest possible valuation of the short-sales constrained investors, F + H. Taking the smaller of the two roots gives the constrained price Pc below
( √ )
Moreover, the short sales constraint only holds if the price in the unconstrained case PU is greater than the valuation of the most pessimistic buyer, F – H. In other words the short-sales constraints only holds if H is significantly large; for instance if H ≥
. P C
= PU at H =
, at this point the buyers which have the lowest valuation of F – H are at their reservation point. If H <
the market is at the equilibrium price of P U
and even those buyers with the lowest valuation of F – H will be long the stock. Thus, when the degree of divergence of opinion (H) is less than the supply of the stock adjusted for
risk, the short-sales constraint does not bind and the unconstrained price PU is the equilibrium price.
The equilibrium price, denoted by P* is given by:
{ Where
Following CHS the above equilibrium P* possesses a few intuitive properties. Firstly P* is always higher than the unconstrained price - PU. Further, P* is positively correlated with the heterogeneity parameter H, which indicates that the expected return on the stock between time 1 and 2, F-P* decreases with H. This relationship exists for any finite value of γA; as the risk tolerance of the arbitrageurs goes to infinity, both P* and PU approach F, so that expected returns with or without short-sales constraints will tend towards zero.
(F-P*), the difference between fundamentals and price is being used as a synonym for expected returns. One limitation of the model is that it does not include any factor risks that are usually seen in classical pricing models such as the CAPM or APT, so (F-P) in the model is more accurately thought of as the net factor-risk adjusted expected return. Hence in a more classical setting with no priced factor risks, arbitrageurs risk tolerance will be infinite and as a result (F-P*) would be zero, because P* increases with heterogeneity while heterogeneity increases with arbitrageurs risk tolerance γB.
The effect of arbitrageurs risk tolerance on the stock price can cause it to move in either direction. For instance, if H is significantly large compared to Q, in particular when , then the stock price is greater than the fundamental value F, so arbitrageurs will take short positions. If γA increases in this event, the stock price decreases converging towards F. When H is small compared to Q, the stock is below the fundamental value so arbitrageurs will take long positions. In this situation an increase in γA signifies an increase in risk sharing capacity thus driving the stock upward.
The main objective of this study is to investigate the interaction between expected returns and the breadth of ownership amongst Portuguese mutual funds, which are subject to short-sales constraints. In the study the measure of breadth developed by CHS is used. The measure is defined as:
[
] Where B = breadth of ownership
F = fundamental value H = degree of heterogeneity
B is used to denote the breadth of ownership. This measure requires that breadth is constrained between zero and one. It is one when the price of a stock is less than or equal to the valuation of the most pessimistic buyers and it converges to zero when a stock’s price approaches the valuation of the most optimistic buyers.
Before we begin to delve into the study we first highlight the propositions discussed by CHS about what kind of relationship between breadth and expected returns is influenced by variation in the parameter H. The propositions are given below.
Proposition 1: As the divergence of opinion H increases, breadth B and the expected return (F-P*) both decrease.
If we only take into account a cross-section of stocks that only vary in difference of opinion, then only those stocks with lower values of opinion should also have lower expected returns. The above is exactly what Miller (1977) in mind.
However, if the only source of variation in stocks were the divergence of opinion across stocks, then the variable of short interest could be used. For instance, those stocks with the highest divergence of opinion will also be the most heavily shorted by the arbitrageurs because price will be higher that the fundamentals. Therefore, high values of short interest could also be used to forecast lower returns.
On the other hand, the relationship between short interest and expected returns is much less robust than that between expected returns and breadth. This can be demonstrated by focusing on variations in some of the other parameters of the model. Particularly, in equation (7) where H ≥
with H as well. Therefore, breadth is decreasing with increases in H which establishes the proposition.
Proposition 2 – Cross-stock variation in any of the model parameters (γA, γB or Q)
induces a positive correlation between breadth and expected returns. Thus, regardless of the source of variation, the unconditional correlation between breadth and expected returns is unambiguously positive.
Understanding, proposition 2 is fairly simple and can be seen by simply focussing on equation (7). Holding H constant, breadth is determined entirely by (F-P*), the difference between fundamentals and price or expected returns. Therefore anything that drives P* upward relative to the fundamentals of the stock, in other words a change in γA, γB or Q, will also result in a decrease in breadth. Changes in Q should not just be thought of as a supply shock but as unmodeled changes in investor sentiment, similar to that in Delong et al. (1990), which influences divergences between prices and fundamentals. Consequently, breadth is a robust indicator.
Proposition 3 – Suppose . In this case, P* ≥ F so that arbitrageurs take short
positions. Moreover, an increase in γA leads to an increase in short interest. This
increase in short interest is accompanied by a decrease in prices and hence by an increase in both breadth and expected returns.
When H is large enough, changes in γA create a positive correlation between short interest and expected returns. The opposite happens for the correlation created by variations in H, for instance an increase in H results in an increase in price and hence a decrease in both breadth and expected returns. Thus the model illustrates an uncertain link between breath and expected returns. The same cannot be said of short interest. This adds credence to the earlier point that there is no good theoretical reason to assume that short interest is a reliable predictor of returns.
Propositions 1 and 2 enable the testing of three hypotheses for the purpose of the empirical study.
Hypothesis 1 – An increase (decrease) in a stock’s breadth at time t should forecast higher (lower) returns over some future interval from t to t + k.
Hypothesis 2 – If there are other time-t variables that are known to be positively related to risk-adjusted future returns (perhaps book-to-market, earnings-to-price or momentum) then breadth at time t should be positively correlated with these predictive variables.
Hypothesis 3 – After controlling for other known predictors of returns, the ability of breadth at time t to forecast future returns, should be reduced though not necessarily eliminated.
Hypothesis 1 is clearly a by-product of propositions 1 and 2. Hypothesis 2 follows that if breadth is positively correlated with the risk-adjusted expected return (F-P*) on a stock, any other observable variables that can be considered good proxies for risk-adjusted expected returns, breadth should be positively correlated with these proxies as well.
To use an example given by CHS, assume that there is a non-risk-related momentum effect in stock prices (Jegadeesh and Titman, 1993), so that returns from time t to t+k are positively correlated with returns from t-k to t. In this example, one would expect breadth at time t to be positively related to past returns. Therefore, if a stock’s price was to fall from t-1 to t, breadth should follow suit and fall as well. The idea is that with momentum a drop in a stock’s price from t-k to t is an indication that the price at t is high relative to the stock’s fundamentals. Note that with momentum a decline in price is most likely to be followed by further declines than a change in the trend. Since the median buyer makes a precise assessment of the fundamentals, the buyer will be more inclined to sell the stock at time t. In other words, since decreases in breadth is assumed to indicate that the short-sales constraints is more binding, so the constraints binds more after the price decline.
Meanwhile, if a particular variable is capable of forecasting returns simply because it is a good proxy for risk, one should not expect it to be positively related to movements in breadth. For instance, if Fama and French (1992, 1993, 1996) were correct in stating that book-to-market is solely a risk measure then one should not expect for breadth to be lower in low book-to-market glamour stocks.
Hypothesis 3 follows Hypotheses 1 and 2. For instance if breadth at time t is correlated with earnings-per-share then one should expect breadth to have less forecasting power once we control for past earning-per-share ratios. Since it is hypothesized that breadth is a valuation indicator it is hoped that the predictive power of the breadth variable is not significantly subsumed by a known predictor such as the earnings-per-share ratio.
4. Data
As of March 2014, there were a total of 174 mutual funds in Portugal managed by 17 different companies. Total assets under management amounted to approximately 8 trillion euros. Our data on Portuguese mutual fund holdings in the study comes from the Information Disclosure System on the Commissão do Mercado de Valores Mobiliários (CMVM) website. This database contains information on monthly equity holdings of mutual funds based in Portugal. Mutual funds are required by CMVM regulation #5/2010 to disclose their monthly portfolio holdings. Following Article 7 – Equity UCITS of CMVM Regulation No. 15/2003 we restrict our sample to mutual funds whose portfolio composition is made up of at least 66.67% shares and those whose names contain “acções” (shares).
The ideal sample for our study would have been that of a universal investor sample but due to lack of data and information it is not possible. However, we believe that mutual funds are good representatives of the investing universe since mutual funds have increased in importance over the last few decades and as mentioned above mutual funds tend not to sell short.
We study mutual funds monthly equity holdings because mutual funds can be considered a proxy for short sales constraints since certain regulatory requirements in most cases constrain the ability of mutual funds to sell short. Using short interest as a proxy for divergence of opinion in our study will prove to be problematic and is not robust enough of a measure for what we are trying to determine. This approach is on fragile ground and is not a suitable proxy to capture the amount of negative information that is withheld from a security’s market price.
Similar to CHS we define BREADTHt as the number of mutual funds that hold a long position in a stock to the total number of mutual funds in the sample for that month. We have a total of 59 mutual funds and 120 monthly observations for the change of breadth during the period studied. To avoid measuring changes in the composition of the number of mutual funds in the sample we take care only to measure the trading activities of existing funds. In the sample new funds are created while existing funds are dissolved. For instance, at the beginning of the sample period, 2003M1 we have data on 39 funds and at the end of the sample, 2012M12 we have data on 34 funds. Most importantly to define ∆BREADTHt, we restrict the sample of funds to those funds that
have a long position in the stock at the end of both month t and month t – 1. From this sample, we take the number of funds who hold the stock at month t minus the number of funds who hold the stock at month t-1and divide by the number of funds who hold the stock at month t-1. The restriction ensures that ∆BREADTHt measures the trading activity of only existing funds, rather than changes in the investor universe due to new funds entering or dissolving. Therefore the sample does not suffer from any survivorship bias.
Change in breadth can be decomposed into the variables INt and OUTt. INt is measured as the percent of funds in the sample at both months t and t-1, that had a zero position in the stock at month t-1 and that open a new position at month t. OUTt is the percent of funds in the sample at both months t-1 and t that moved from a positive position to a zero position in the stock at month t. By construction ∆BREADTHt equates to INt minus OUTt.
To ensure that the results are not affected by changes in the mutual fund sector’s aggregate holdings of a stock we compute a measure denoted HOLDt. HOLDt is calculated as the total number of shares held by all mutual funds at the end of month t divided by the total number of shares outstanding at the end of that month. ∆HOLDt is difference in HOLDt between months t and t-1.
The returns and trading volume data is collected from The Thomson Reuter Datastream. We only analyse stocks of firms that are incorporated in Portugal, which are also represented by the code 114 on the CMVM website. We do not exclude stocks that are no longer trading so as to avoid a survivorship bias in our sample. However, we exclude stocks which undergo a name change due to becoming a new company, for example through a merger. Some of these companies include PT Multimedia and ZON Multimedia and Parerede and GLINT Technological Services.
LOGSIZEt is calculated as the logarithm of market capitalization collected from The Thomson Reuter Datastream at the end of month t. We obtain data on book value and earnings from The Thomson Reuter Datastream, where book value is defined as the value of common stockholders’ equity and is divided by the firm’s market capitalization on the day of the firm’s fiscal year-end to yield the book-to-market ratio, denoted as BK/MKTt. For each month we also collect from The Thomson Reuter Datastream each firm’s primary earnings per share. This value is then cumulated for the past twelve
months, in order to derive the firm’s past twelve months cumulative primary earnings per share. This value is then divided by the price of the stock at the end of the same month to arrive at earnings-per-share, represented as E/Pt. MOM12t is calculated as each stock’s 12 month cumulative holding period return at the end of the month. We also obtain monthly data on share turnover and the number of shares in circulation from The Thomson Reuter Datastream for each month. We then calculate share turnover for each month as the total number of shares traded divided by the total number of outstanding shares, resulting in the measure TURNOVERt.
4.1 Summary Statistics
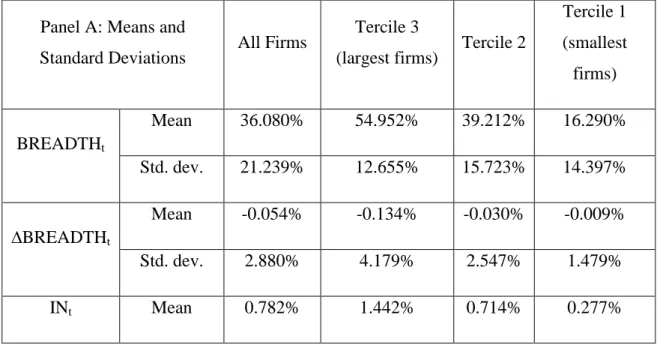
Table 1 shows the summary statistics for the variables used in the analysis. A few things can be observed from the results.
Firstly in Panel A, the mean value of BREADTHt is closely related to market capitalization ranging from 16.29% for stocks in the lowest tercile to 36.08% for stocks in the largest tercile which indicates that stocks are held on average by between 16 and 36 percent of the mutual funds in the sample. Another thing that stands out from our analysis is that the standard deviations of ∆BREADTHt are also closely related to firm size. In addition, the mean value ∆BREADTHt for the stocks in the sample is -0.05% which means on average mutual funds rarely sell their positions.
Further, only a few mutual funds hold long positions in the lowest-cap stocks at any given point in time. LOGSIZEt and TURNOVERt are mostly highly correlated to market capitalization as well, which indicates that funds prefer to hold larger, more liquid stocks.
MOM12t is negatively correlated with market capitalization. For stocks in the lowest tercile MOM12t is 0.37% and is -0.021% for stocks in the largest tercile. This indicates that the larger, more liquid stocks reported negative earnings based on a 12 month holding period during the time studied in the sample. E/Pt is negative in terciles 1 and 2 registering figures of -0.24 and -0.19 respectively but 0.759 in tercile 3. The stocks in tercile 3 which reported positive earnings were the stocks held by majority of mutual funds.
Further, Panels B and C illustrate that similar to CHS the raw value of BREADTHt cannot be used as an empirical analog to our model’s B variable. While, BREADTHt
only has a monthly correlation of 0.5, it is still highly correlated with LOGSIZEt and TURNOVERt with contemporaneous correlations of 0.786 and 0.134 respectively. This just further concretes our earlier statement that the majority of funds hold large, liquid stocks. Additionally, there is a correlation of -0.168 between BREADTHt and BK/MKTt which also indicates that funds tend to prefer to hold more glamour stocks over value stocks. Similar results were documented by Shefrin and Statman (1998) and Chen et al. (2002). Similar to CHS, with the intention to remove these fixed firm effects, we work instead with ∆ BREADTHt.
Table 1 Summary Statistics
The sample includes stocks from Portugal’s stock market between 2003 and 2012. BREADTHt is the fraction of mutual funds long the stock at the end of month t. ∆BREADTHt is the change in breadth of ownership from the end of month t -1 to month t. INt is the fraction of mutual funds in the sample at both months t-1 and t that have established a new position in a stock at month t. OUTt is the fraction of mutual funds that have completely removed an existing position in a stock at month t. HOLDt is the fraction of shares outstanding of a stock held by mutual funds at the end of month t. ∆HOLDt is the change in the fraction of shares held by mutual funds from the end of month t – 1 and month t. LOGSIZEt is the log of market capitalization measured at the end of month t. BK/MKTt is the most recently available observation of book-to-market ratio at the end of month t. E/Pt is past year’s earnings per share divided by the price at the end of month t. TURNOVERt is the share turnover in month t among stocks listed on the Portuguese stock market. MOM12t is the raw return in the twelve months up to month t. Size terciles are calculated using percentile calculations monthly based on change in breadth of the stocks being studied. Number of observations in each tercile is 1374, 1660 and 1574 observations for terciles 3, 2 and 1 respectively.
Panel A: Means and
Standard Deviations All Firms
Tercile 3
(largest firms) Tercile 2
Tercile 1 (smallest firms) BREADTHt Mean 36.080% 54.952% 39.212% 16.290% Std. dev. 21.239% 12.655% 15.723% 14.397% ∆BREADTHt Mean -0.054% -0.134% -0.030% -0.009% Std. dev. 2.880% 4.179% 2.547% 1.479% INt Mean 0.782% 1.442% 0.714% 0.277%
Std. dev. 2.094% 2.874% 1.889% 1.107% OUTt Mean 0.836% 1.576% 0.744% 0.286% Std. dev. 2.162% 3.120% 1.759% 1.064% HOLDt Mean 2.822% 0.926% 3.929% 3.308% Std. dev. 3.755% 0.861% 3.949% 4.418% ∆HOLDt Mean -0.015% -0.010% -0.011% -0.023% Std. dev. 0.385% 0.189% -0.011% -0.023% LOGSIZEt Mean 8.513 9.503 8.524 7.638 Std. dev. 0.832 0.317 0.352 0.432 BK/MKTt Mean 1.031 0.753 0.921 1.390 Std. dev. 1.324 0.746 0.731 1.968 E/Pt Mean 0.076 0.759 -0.191 -0.240 Std. dev. 5.209 1.040 6.370 5.926 TURNOVERt Mean 4.479% 5.954% 4.232% 3.451% Std. dev. 11.100% 5.914% 10.590% 14.452% MOM12t Mean 0.152% -0.021% 0.089% 0.370% Std. dev. 10.982% 8.613% 10.782% 12.869
B R E A D T H t ∆ B R E A D T H t IN t O U T t H O L D t ∆ H O L D t L O G S IZ E t B K /M K T t E /P t T U R N O V E R t M O M 12 B R E A D T H t 0.052 0.216 0.140 0.136 0.015 0.786 -0.16 8 0.056 0.134 0.020 ∆ B R E A D T H t 0.024 -0.04 7 0.026 -0.00 4 -0.00 9 0.008 0.004 0.030 0.017 IN t 0.031 -0.06 3 0.004 0.114 -0.05 4 0.025 0.013 0.017 O U T t -0.08 5 -0.00 4 0.043 -0.01 1 0.000 -0.00 2 -0.01 3 H O L D t -0.02 5 -0.02 9 -0.06 8 -0.01 9 0.018 0.024 ∆ H O L D t 0.004 -0.00 1 0.000 0.022 0.052 L O G S IZ E t -0.00 5 0.077 0.017 -0.00 2 B K /M K T t -0.04 4 -0.03 6 -0.01 2 E /P t 0.013 0.009 T U R N O V E R t -0.00 2 M O M 12 t P a n e l C : A u to-c or re la tion s a n d c ros s-a u toc or re la tion s B R E A D T H t-1 ∆ B R E A D T H t-1 In t-1 O U T t-1 H O L D t-1 ∆ H O L D t-1 L O G S IZ E t-1 B K /M K T t-1 E /P t-1 T U R N O V E R t-1 M O M 12 B R E A D T H t 0.500 0.014 0.176 0.152 -0.13 0 0.018 0.647 -0.10 8 0.079 0.051 -0.00 7 ∆ B R E A D T H t -0.01 0 0.053 0.011 -0.06 0 0.012 0.001 -0.01 2 -0.01 4 0.000 -0.02 3 0.007 IN t 0.154 0.024 0.070 0.035 -0.05 1 0.012 0.202 -0.05 0 0.033 0.032 0.004 O U T t 0.163 -0.04 7 0.053 0.114 -0.06 6 0.010 0.212 -0.03 0 0.032 0.062 -0.00 6 H O L D t -0.17 8 0.026 -0.04 6 -0.08 0 0.241 0.027 -0.19 6 -0.02 2 -0.00 7 0.012 0.005 ∆ H O L D t 0.012 -0.00 4 -0.02 0 -0.01 4 0.043 0.006 -0.00 4 -0.06 5 0.002 -0.01 1 0.014 L O G S IZ E t 0.589 -0.00 9 0.189 0.195 -0.15 8 0.016 0.753 -0.14 6 0.092 0.074 -0.00 1 B K /M K T t -0.21 4 0.008 -0.04 9 -0.05 9 -0.03 7 -0.00 7 -0.27 6 0.134 -0.02 9 -0.07 5 -0.01 9 E /P t 0.005 0.004 0.031 0.025 -0.01 7 0.020 0.040 -0.03 2 0.074 0.021 0.032 T U R N O V E R t 0.045 0.030 0.058 0.017 0.042 0.018 0.085 -0.07 3 0.026 0.009 0.013 M O M 12 t -0.00 9 0.017 0.007 -0.01 6 0.018 0.041 0.006 -0.02 2 0.000 0.012 0.212 P a n e l B : C on te m por a n e ou s c or re la tion s
5. Results
5.1 Determinants of ∆BREADTH
The upcoming section is divided into 2 subsections, with the aim of examining the determinants of breadth. The first section focuses on the book-to-market specification and the second the earnings to price specification. The objective is in relation to Hypothesis 2, where we want to see to what degree, if any ∆BREADTH is capturing the information in other well-known predictors of stock returns such as the book-to-market and earnings to price ratios.
5.1.1 Book-to-market ratio specification
In Table 2, we present the results of regressing ∆BREADTHt against the following five variables: ∆HOLDt, LOGSIZEt, BK/MKTt, MOM12t and TURNOVERt. In implementing the regressions we followed the same methodology as Chen et al. (2002) and ran a separate regression each month for each of the three size classes. Afterwards, the regression coefficients are averaged across months, to retrieve a result for each size class. Ultimately, the coefficients for each size class are averaged together to produce an overall result for the entire sample. The rationale behind this method is that as can be seen in Panel A of Table 1, there is significantly higher variance in ∆BREADTHt among larger stocks. Running a single regression for all the stocks pooled together would result in the larger stocks having an unbalanced influence on the final results due to heteroskedasticity. For instance the figure 1.7894 in tercile 1 for the ∆HOLDt variable was calculated by adding all the coefficients from the monthly regressions resulting in a total of 120 coefficients and then calculating the average. The result is an average coefficient of 1.7894.
Table 2 Specification including BK/MKTt
The sample includes stocks from Portugal’s stock market between 2003 and 2012. ∆BREADTHt is the change in breadth of ownership from the end of month t -1 to month t. ∆HOLDt is the change in the fraction of shares held by mutual funds from the end of month t – 1 and month t. LOGSIZEt is the log of market capitalization measured at the end of month t. BK/MKTt is the most recently available observation of book-to-market ratio at the end of month t. TURNOVERt is the share turnover in month t among stocks listed on the Portuguese stock market. MOM12t is the raw return in the twelve months up to month t. Size terciles are calculated using percentile calculations monthly based
on change in breadth of the stocks being studied. Number of observations in each tercile is 1374, 1660 and 1574 observations for terciles 3, 2 and 1 respectively. A total of 120 different regressions were run for each tercile. T-statistics are in parentheses.
∆HOLDt LOGSIZEt BK/MKTt MOM12 TURNOVERt
Average R2 (%) Size Tercile 1 1.7894 -0.0006 0.0001 -0.0005 -0.0083 58.64*** (-0.3123) (-1.2068) (2.8246)*** (-1.1995) (1.5467)* Size Tercile 2 1.7083 -0.0016 0.0035 0.0281 0.0156 52.39*** (4.5611)*** (-.08732) (-.2298) (1.2909)* (0.6432) Size Tercile 3 15.5092 0.0074 0.0067 0.0693 -0.0165 58.90*** (3.7970)*** (1.1164) (0.6416) (-1.0456) (-0.9870) Full Sample 6.3357 0.0017 0.0035 0.0323 -0.0031 56.64*** (2.6820)*** (-0.3052) (1.0788) (-0.3181) (0.4010)
Significant at the 1 percent level - *** Significant at the 5 percent level - ** Significant at the 10 percent level - *
Firstly, in Table 2 we can clearly see that there is a significant positive correlation between ∆BREADTHt and ∆HOLDt, even though the results are statistically insignificant for the stocks in the smallest tercile. This result is expected since that when a larger percentage of a given stock is owned by the mutual fund sector, a fair assumption can be made that a greater number of mutual funds will hold long positions in the given stock.
Further, from the table it seems that there is a weak positive correlation between ∆BREADTH and the momentum variable, MOM12t. However this result is statistically insignificant for all of the size classes except tercile 2 and indicates only a small economic effect. Since the result garnered is only significant in tercile 2 we cannot make the conclusion that the full sample is consistent with the second hypothesis, that
momentum is a future predictor of returns. However, momentum can be considered a future predictor of returns for mid-capitalization stocks that is stocks in our second tercile. A possible explanation could be that short sales constraints are binding in Portugal, thereby limiting the ability of arbitrageurs to impose their influence on stock prices. Thus arbitrageurs are held in check and are unable to drive prices down approaching their fundamental levels.
In contrast, the BK/MKTt variable has a positive correlation with ∆BREADTHt but is only statistically significant stocks in the smallest size class which is consistent with our second hypothesis that the book-to-market ratio can be considered a predictor of future returns. This result is in contrasts in regard to the smallest size class with Chen et al. (2002) and Fama and French (1992, 1993 and 1996) that the book-to-market variable solely captures risk and not mispricing when compared to fundamentals. In conclusion, if the book-to-market ratio is associated with any risk-adjusted predictability it is not relevant enough to create a desire for investors to sell short.
5.1.2 Earnings-to-price ratio specification
Table 3: Specification including E/Pt
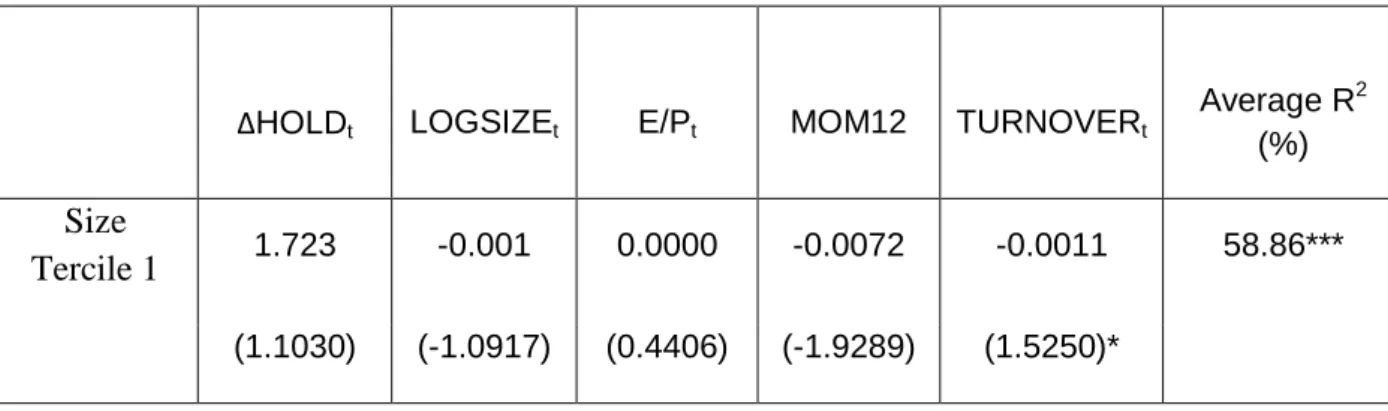
The sample includes stocks from Portugal’s stock market between 2003 and 2012. ∆BREADTHt is the change in breadth of ownership from the end of month t -1 to month t. ∆HOLDt is the change in the fraction of shares held by mutual funds from the end of month t – 1 and month t. LOGSIZEt is the log of market capitalization measured at the end of month t. E/Pt is past year’s earnings per share divided by the price at the end of month t. TURNOVERt is the share turnover in month t among stocks listed on the Portuguese stock market. MOM12t is the raw return in the twelve months up to month t. Size terciles are calculated using percentile calculations monthly based on change in breadth of the stocks being studied. Number of observations in each tercile is 1374, 1660 and 1574 observations for terciles 3, 2 and 1 respectively. A total of 120 different regressions were run for each tercile. T-statistics are in parentheses.
∆HOLDt LOGSIZEt E/Pt MOM12 TURNOVERt
Average R2 (%)
Size
Tercile 1 1.723 -0.001 0.0000 -0.0072 -0.0011 58.86***