Thais Torralbo LOPEZ(a)
Edgard MICHEL-CROSATO(a)
Eduardo de Novaes BENEDICTO(a)
Luiz Airton Saavedra de PAIVA(b)
Diogo Cesar Borges SILVA(c)
Maria Gabriela Haye BIAZEVIC(a)
(a) Universidade de São Paulo – USP, School of Dentistry, Department of Community Dentistry, São Paulo, SP, Brazil.
(b) Institute of Teaching and Research in Forensic Sciences , Guarulhos, SP, Brazil.
(c) Instituto de Pesquisas Tecnológicas – IPT, Microprecision Dimensional Metrology and Metrotomography Laboratory, São Paulo, SP, Brazil.
Accuracy of mandibular
measurements of sexual dimorphism
using stabilizer equipment
Abstract: The objective of this investigation was to compare the accuracy of mandibular measurements using a stabilizer (MS) with gold standard computed tomography (GS) images. Sixty mandibles were studied. Werth TomoScope HV Compact® was used to obtain CT images (GS), and the MS was also used. Analysis of the CT scans was performed using the VG Studio Max software® (Volume Graphics GmbH, Heidelberg, Germany), and MS was used after the proper positioning of the mandible. Descriptive and paired t test measures were used, and a ROC
curve was calculated, as well as sensibility and speciicity. MedCalc and STATA 13.0® were used (95% level of signiicance). Bicondylar breadth,
bicoronoid breadth and minimum ramus breadth reached the highest
concordance correlation coeficients at 0.99 (0.99-1.00), 0.99 (0.99–1.00) and 1.00 (0.99–1.00), respectively. Comparing observers with GS, the lowest accuracy was noted for the maximum mandibular length [0.59 (0.45–0.69), 0.64 (0.51–0.74)], the breadth of the right (0.14 (0.04–0.23), 0.14 (0.004–0.24)) and left mandibular body [0.14 (0.03–0.24), 0.16 (0.05-0.26)], and the right [0.58 (0.45–0.69), 0.63 (0.51–0.73) and left (0.59 (0.45–0.70), 0.59 (0.46–0.69)]
mandibular angle. Various measurements exhibited good sensibility
for males using MS: maximum mandibular length (78.12), bicondylar breadth (78.12), left mandibular notch breadth (84.37), and the left height of the mandibular body at the mental foramen (75.00). High speciicity in
discriminating females was observed for the left maximal ramus height
(85.19), mandibular length (85.71), bicoronoid breadth (96.43), right height of the mandibular body at the mental foramen (82.19), bimental breadth (78.57), breadth right (92.86) and left (96.43) mandibular body, minimum ramus breadth (89.29), and left mandibular angle (85.71). MS was able to
discriminate sexual dimorphism.
Keywords: Mandible; Tomography Scanners, X-Ray Computed;
Anthropology; Sex Determination Analysis.
Introduction
The ield of anthropology offers important parameters to understand
human variability that can be useful for forensic purposes and the study
of evolutionary processes.1 The skeleton offers countless characteristics
that indicate sexual dimorphism. In this regard, skulls and mandibles have been described as highly useful both in historical and modern collections.
Declaration of Interests: The authors certify that they have no commercial or associative interest that represents a conflict of interest in connection with the manuscript.
Corresponding Author:
Maria Gabriela Haye Biazevic E-mail: biazevic@usp.br
DOI: 10.1590/1807-3107BOR-2017.vol31.0001
Submitted: Sep 30, 2015
In this context, various studies2,3,4,5 have demonstrated that several anatomic landmarks of the skull and mandible can be used and that some of these landmarks typically present increased precision in identifying
an individual compared with other.3 Furthermore,
the mandible is one of the most preserved bones in
hominid and hominoid fossil records,6 making it
relevant to anthropological studies.
Several techniques have been cited, and most of them describe qualitative parameters to perform the evaluations. As these parameters are subjective, more accurate results are typically achieved by experts. Furthermore, most international investigations use qualitative parameters to perform the measurements; thus, there is a need for methods that are reproducible (quantitative) in measuring mandibular characteristics.
Some authors consider that due to recent migrations,
genetic low and dificulties in determining skeleton
ancestry, morphological analysis is limited.2,3,4,5,7,8
On the other hand, the metric method is gaining increasing importance as technical reports or case discussion on tribunals make it necessary to
statistically present data to prove a speciic point of
view. Additionally, a less subjective argumentation
highlights the reliability of the data.9,10,11,12,13 However,
the quantiication of the structures used in the metric
method is not yet well understood.
Considering the lack of standardization of mandible measurements, we built a piece of equipment (mandibular stabilizer, MS) that standardizes the position of the mandible and allows us to perform quantitative measurements. Therefore, the objective of this investigation was to compare the accuracy of mandibular measurements using the mandibular stabilizer (MS) with gold standard computed
tomography (GS) images of Brazilian mandibles.
Methodology
Sixty mandibles from the Institute of Teaching and Research in Forensic Sciences of Guarulhos were studied. After proper training and achieving acceptable concordance levels (kappa test), two calibrated observers obtained 13 measurements of the mandible. Calibration was performed using mandible samples other than those used in the study.
I n t he f i rst met hod, t he m a ndibles were analyzed using 3D images. To perform these measurements, we used a Multisensor Coordinate
Measurement Machine that has X-ray Tomography
as one of its sensors, the Werth TomoScope HV Compact® (Werth Messtechnik GmbH, Gieben, Germany) (Figure 1). This equipment is located at the Laboratory of Micromanufacturing at the Institute for Technological Research (IPT) in São
Paulo, Brazil. The TomoScope can reach levels of
precision highly superior to those of a typical cone
beam CT, and a resolution of 5 μm can be achieved.
Analysis of the CT scans was performed using the VG Studio Max software® (Volume Graphics GmbH, Heidelberg, Germany). The mandibular me a su r e me nt s u si ng t he Tomo S cop e we r e considered the gold standard (GS).
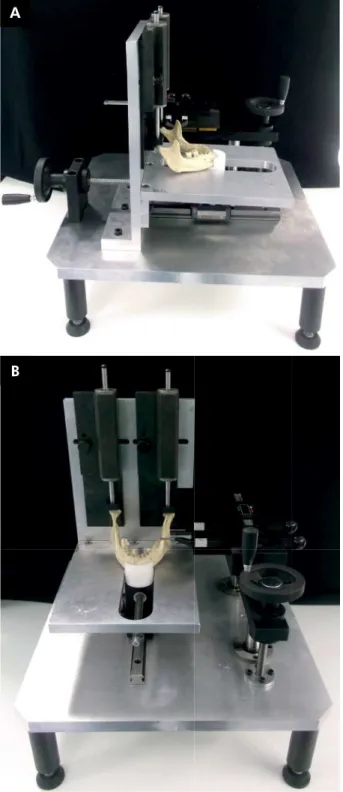
In the second method, a mandibular stabilizer
was used (Figure 2). The equipment was developed
with the aim of making measurements easier with more precision and to create measurement
standards. The equipment has a base, a ixation and
positioning table, and a measurement table. The patent registration was requested from the National
Institute of Industrial Property in Brazil (INPI), BR 10 2013 003270-0. The mandible measurements
are described in Table 1 and presented in Figure 3. The reproducibility and accuracy were presented using descriptive statistics showing the sample size, mean and standard deviation. Additionally, the
coeficient of variation, single and average intraclass
correlation, concordance correlation coefficient (95%CI), and Pearson and bias correction factors were presented. To verify the sexual dimorphism, descriptive and paired t test measures were used, and a ROC curve was fabricated. The sensibility and
speciicity were also calculated. MedCalc® (MedCalc Software bvba, Ostend, Belgium) and STATA 13.0® (StataCorp LP, College Station- TX, USA) were used at a 95% of level of signiicance.
This investigation is in accordance with the international and national parameters of ethics for the investigation of human beings; the investigation protocol was submitted and approved by the Ethics
Results
Table 2 presents the descriptive data of sex
and age estimation of the samples. Tables 3 and 4
present the reproducibility and accuracy results of
the measurements. Bicondylar breadth, bicoronoid
breadth and minimum ramus breadth reached the
highest concordance correlation coeficients, with
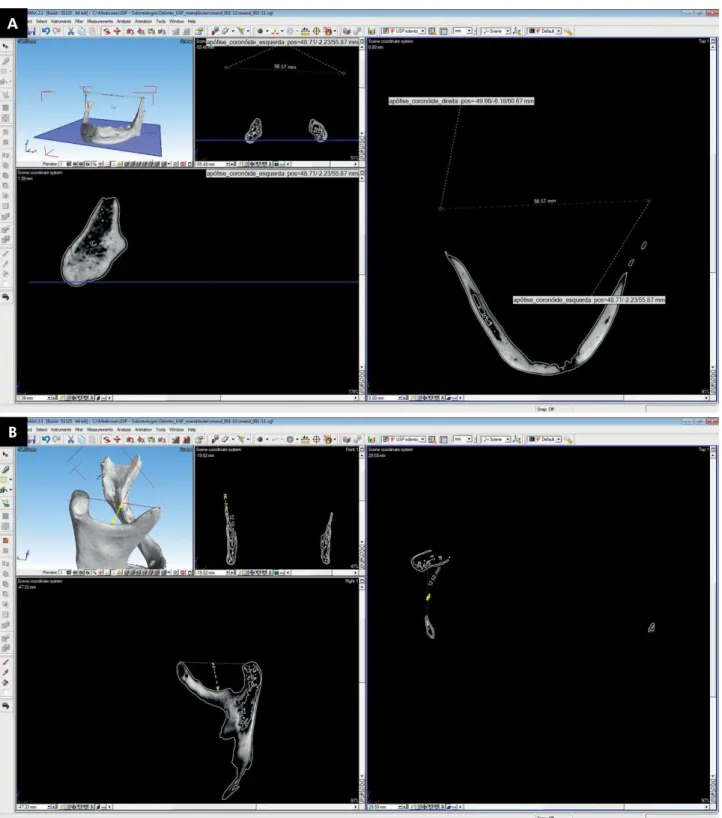
Figure 1. CT mandible images (gold standard). 1a: bicoronoid breadth; 1b: mandibular notch depth.
A
values of 0.99 (0.99– 1.00), 0.99 (0.99–1.00) and 1.00 (0.99–1.00) (Table 3), respectively. On the other hand,
mandibular notch breadth and mandibular notch depth presented lower results in this regard (0.85
(0.73–0.92) and 0.80 (0.70–0.87), respectively) (Table 3).
Comparing observer 1 and 2’s measurements
with the gold standard, the lowest accuracy measurements were found for maximum mandibular
length [0.59 (0.45–0.69), 0.64 (0.51–0.74)], breadth of the right [0.14 (0.04v0.23), 0.14 (0.004–0.24)] and left [0.14 (0.03-0.24), 0.16 (0.05-0.26)] mandibular body, and right [0.58 (0.45–0.69), 0.63 (0.51–0.73) and left (0.59 (0.45–0.70), 0.59 (0.46–0.69)] mandibular angle
(data not shown in tables).
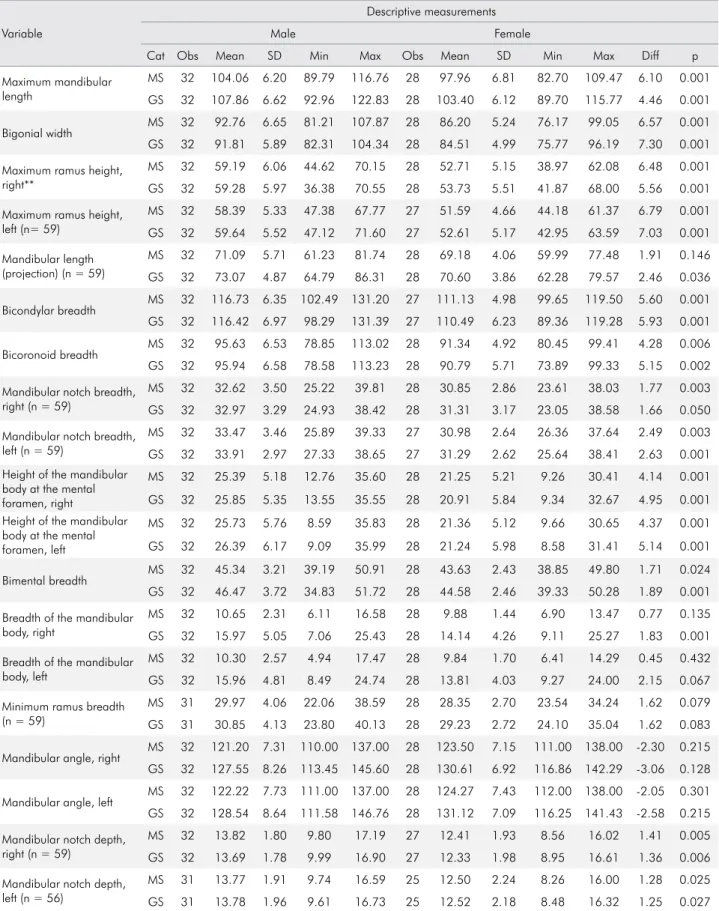
Tables 4 and 5 present the variables and the sexual dimorphism. In Table 4, the results are presented as the means of the values among male and female mandibles. All mean measurements were higher in male mandibles, and most of them correctly showed differences between the sexes using both the gold standard (GS) and the mandible stabilizer (MS). Some values did not differ between males and females when the mandible stabilizer (MS) was used: mandibular
length (p = 0.146), breadth of the right and left (p = 0.135 and p = 0.432, respectively) mandibular body, and the right and left (p = 0.215 and p = 0.301, respectively)
mandibular angle. The only measurement using the GS that did not show differences between the sexes was
the right and left (p = 0.128 and p = 0.215, respectively)
mandibular angle.
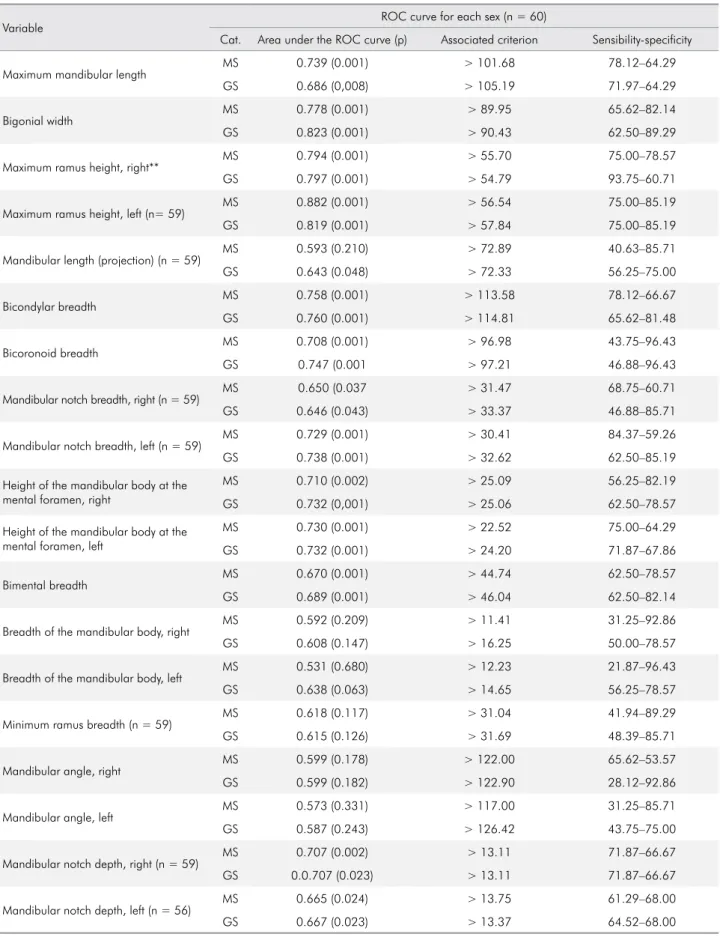
Table 5 shows the ROC curve results. Some measurements exhibited good sensibility for male mandibles using the MS as follows: the maximum
mandibular length (78.12), the bicondylar breadth (78.12), the left mandibular notch breadth (84.37),
and the left height of the mandibular body at the
mental foramen (75.00). The GS performed better for the right maximum ramus height (93.75) in the male sample. High speciicity in discriminating
female mandibles was observed for the left maximus
ramus height (85.19), the mandibular length (85.71), the bicoronoid breadth (96.43), the right height
of the mandibular body at the mental foramen
(82.19), the bimental breadth (78.57), the breadth of the right (92.86) and left (96.43) mandibular body, the minimum ramus breadth (89.29), the left mandibular angle (85.71), variables using MS and the bigonial width (89.29), the bicoronoid breadth (96.43), the breadth of the right (85.71) and left
(85.19) mandibular notch, the right height of the
mandibular body at the mental foramen (78.57),
Figure 2. Mandible stabilizer.
A
the bimental breadth (82.14), the right breadth of the mandibular body (78.57), the minimum ramus breadth (85.71), and the right mandibular angle (92.86) using GS (Table 5).
Discussion
The objective of comparing the accuracy of the MS with GS demonstrated that the MS can discriminate sex in mandibles. High observer concordance was noted in some anatomical landmarks, and these landmarks should be preferred to discriminate sex.
The sample had more male than female mandibles, and 40% of the sample had an age estimation in the
range of 60 to 79 years. It must be highlighted that
age estimation is prone to variability. In addition,
less precision is achieved in older samples.14
In general, a high level of agreement between the observers was observed, indicating that the MS method is reproducible. One recommendation should be the need to be trained to perform the measurements. Thus, training with theoretical discussions and practical activities are necessary to achieve high levels of reproducibility when performing comparisons with
a gold standard. This topic should be considered in the area of forensics given that sex determinations must be performed in numerous settings.
Bicondylar breadth, bicoronoid breadth and
minimum ramus breadth reached the highest concordance coefficients; this was an expected result because these measurements are based on
easy-to-ind anatomical landmarks. On the other
hand, mandibular notch breadth and depth reached lower concordance rates because these anatomical landmarks require more expert knowledge and training to be established.
As mentioned in the results section, the lowest accuracy measures were observed for the maximum mandibular length, the breadth of the mandibular body and the mandibular angle. The maximum mandibular length was the distance from the pogonion (the most anterior point of the mentonian prominence) and the tangent perpendicular of the posterior part of the condyle. Therefore, this localization can be exposed to variations among different observers because it corresponds to a projection. When using the VG StudioMax program to perform the GS measurements, the program
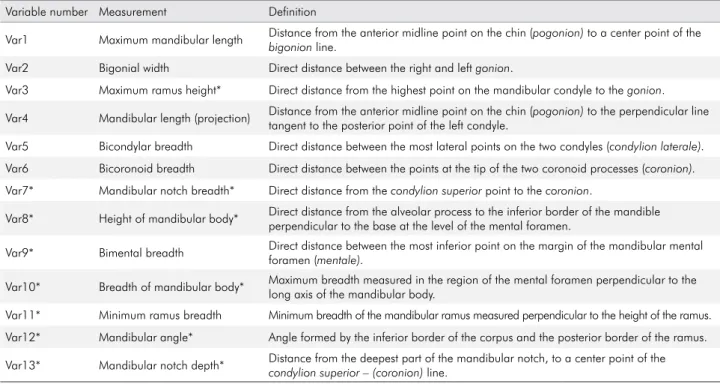
Variable number Measurement Definition
Var1 Maximum mandibular length Distance from the anterior midline point on the chin (pogonion) to a center point of the
bigonion line.
Var2 Bigonial width Direct distance between the right and left gonion.
Var3 Maximum ramus height* Direct distance from the highest point on the mandibular condyle to the gonion.
Var4 Mandibular length (projection) Distance from the anterior midline point on the chin (pogonion) to the perpendicular line tangent to the posterior point of the left condyle.
Var5 Bicondylar breadth Direct distance between the most lateral points on the two condyles (condylion laterale).
Var6 Bicoronoid breadth Direct distance between the points at the tip of the two coronoid processes (coronion).
Var7* Mandibular notch breadth* Direct distance from the condylion superior point to the coronion.
Var8* Height of mandibular body* Direct distance from the alveolar process to the inferior border of the mandible perpendicular to the base at the level of the mental foramen.
Var9* Bimental breadth Direct distance between the most inferior point on the margin of the mandibular mental foramen (mentale).
Var10* Breadth of mandibular body* Maximum breadth measured in the region of the mental foramen perpendicular to the long axis of the mandibular body.
Var11* Minimum ramus breadth Minimum breadth of the mandibular ramus measured perpendicular to the height of the ramus.
Var12* Mandibular angle* Angle formed by the inferior border of the corpus and the posterior border of the ramus.
Var13* Mandibular notch depth* Distance from the deepest part of the mandibular notch, to a center point of the
condylion superior – (coronion) line. Table 1. Mandible measurements.
automatically generated this perpendicular line, so the GS was considerably more precise than the observers using the MS.
As expected, the breadth of the mandibular body also has limitations during measurements due to the presence of teeth and tori. Again, given that the mandibular angle is the angle formed by the lower border of the mandibular body and the posterior border of the ramus, it was expected that the software would achieve more precise measurements than MS.
Differences were observed between GS and MS. MS has demonstrated good accuracy to discriminate the sex of mandibles, allowing a standardization of the measurements performed by experts and in training professionals. This feature may be very useful for forensic anthropology settings.
Some measurements have displayed better results
than others in discriminating sex. Williams and Rogers3
evaluated the accuracy of some morphological traits among skulls and mandibles in a skeletal collection in
Tennessee, U.S.A., and they found that the goniac angle
exhibited high precision and low accuracy. Another
study performed in Brazil found that the bigonial width
and mandibular ramus height obtained good results
in discriminating sex;15 our study observed similar
results for discriminating sex with the maximum ramus
height compared with a Korean study.16 Furthermore,
studies have highlighted that the shape of the mandible can offer a better contribution than the size for sex determination in Gorilla, Pongo and H. s. syndactylus
and to a lesser extent in modern humans.1, 6
Some mandibular measurements did not accurately discriminate sex with MS: the mandibular length and the breadth of the mandibular body.
Some authors also found similar results, especially
when compa r i ng d i f ferent et h n ic g roups.17
Additionally, the mandibular angle measured using both methods did not show values sufficient to discriminate male and female mandibles probably due to the difficulties in establishing anatomical
reference marks. A Korean study16 revealed sex
differences (p < 0.032). The literature indicates
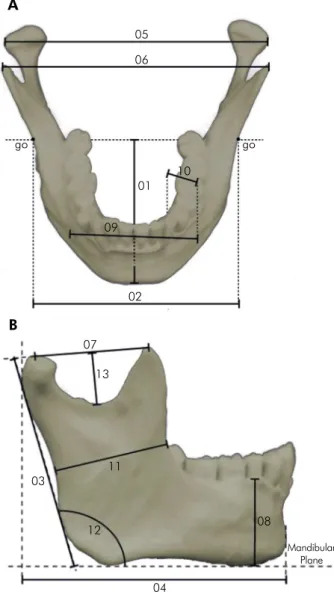
Figure 3. Mandible measurements. 1. maximum mandibular length; 2. bigonial width; 3. maximum ramus height, right and left; 4. mandibular length (projection); 5. bicondylar breadth; 6. bicoronoid breadth; 7. mandibular notch breadth, right and left; 8. height of the mandibular body at the mental foramen, right and left; 9. bimental breadth; 10. breadth of the mandibular body, right and left; 11. minimum ramus breadth; 12. mandibular angle, right and left; 13. mandibular notch depth, right and left.
04
Mandibular Plane
08 12
03
11 07
13 02 09
01 10 go
05
06
go
A
B
Table 2. Descriptive data of the sample (mandibles).
Variable n %
Sex
Male 32 53.34
Female 28 46.66
Age (in years)
17–39 10 16.67
40–59 16 26.66
60–79 24 40.00
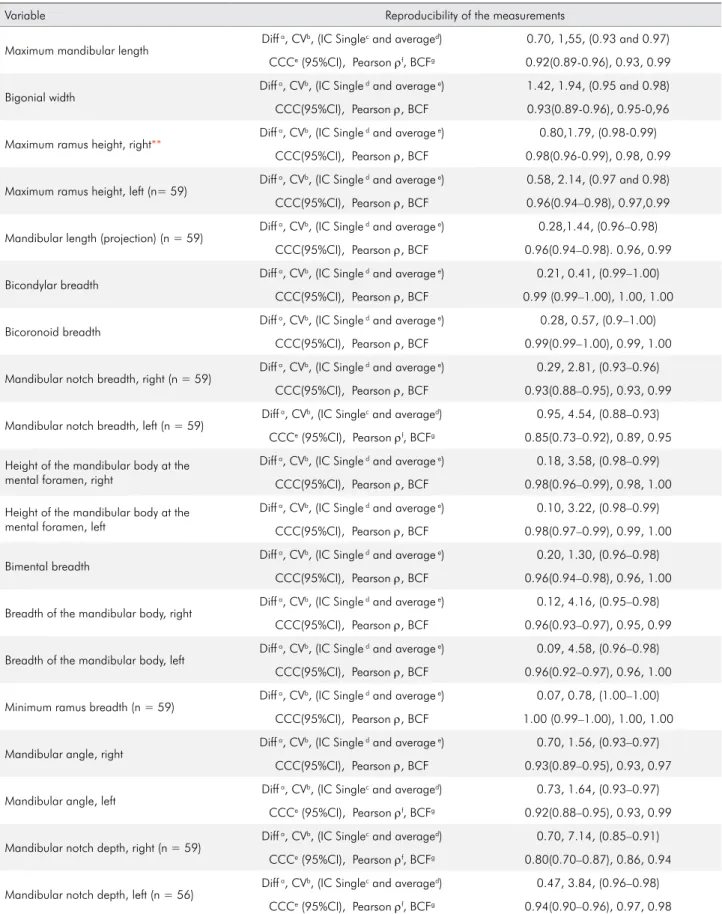
Table 3. Reproducibility of the measurements per variable.
Variable Reproducibility of the measurements
Maximum mandibular length Diff
a, CVb, (IC Singlec and averaged) 0.70, 1,55, (0.93 and 0.97)
CCCe (95%CI), Pearson ρf, BCFg 0.92(0.89-0.96), 0.93, 0.99
Bigonial width Diff
a, CVb, (IC Single d and average e) 1.42, 1.94, (0.95 and 0.98)
CCC(95%CI), Pearson ρ, BCF 0.93(0.89-0.96), 0.95-0,96
Maximum ramus height, right** Diff
a, CVb, (IC Single d and average e) 0.80,1.79, (0.98-0.99)
CCC(95%CI), Pearson ρ, BCF 0.98(0.96-0.99), 0.98, 0.99
Maximum ramus height, left (n= 59) Diff
a, CVb, (IC Single d and average e) 0.58, 2.14, (0.97 and 0.98)
CCC(95%CI), Pearson ρ, BCF 0.96(0.94–0.98), 0.97,0.99
Mandibular length (projection) (n = 59) Diff
a, CVb, (IC Single d and average e) 0.28,1.44, (0.96–0.98)
CCC(95%CI), Pearson ρ, BCF 0.96(0.94–0.98). 0.96, 0.99
Bicondylar breadth Diff
a, CVb, (IC Single d and average e) 0.21, 0.41, (0.99–1.00)
CCC(95%CI), Pearson ρ, BCF 0.99 (0.99–1.00), 1.00, 1.00
Bicoronoid breadth Diff
a, CVb, (IC Single d and average e) 0.28, 0.57, (0.9–1.00)
CCC(95%CI), Pearson ρ, BCF 0.99(0.99–1.00), 0.99, 1.00
Mandibular notch breadth, right (n = 59) Diff
a, CVb, (IC Single d and average e) 0.29, 2.81, (0.93–0.96)
CCC(95%CI), Pearson ρ, BCF 0.93(0.88–0.95), 0.93, 0.99
Mandibular notch breadth, left (n = 59) Diff
a, CVb, (IC Singlec and averaged) 0.95, 4.54, (0.88–0.93)
CCCe (95%CI), Pearson ρf, BCFg 0.85(0.73–0.92), 0.89, 0.95
Height of the mandibular body at the mental foramen, right
Diff a, CVb, (IC Single d and average e) 0.18, 3.58, (0.98–0.99)
CCC(95%CI), Pearson ρ, BCF 0.98(0.96–0.99), 0.98, 1.00
Height of the mandibular body at the mental foramen, left
Diff a, CVb, (IC Single d and average e) 0.10, 3.22, (0.98–0.99)
CCC(95%CI), Pearson ρ, BCF 0.98(0.97–0.99), 0.99, 1.00
Bimental breadth Diff
a, CVb, (IC Single d and average e) 0.20, 1.30, (0.96–0.98)
CCC(95%CI), Pearson ρ, BCF 0.96(0.94–0.98), 0.96, 1.00
Breadth of the mandibular body, right Diff
a, CVb, (IC Single d and average e) 0.12, 4.16, (0.95–0.98)
CCC(95%CI), Pearson ρ, BCF 0.96(0.93–0.97), 0.95, 0.99
Breadth of the mandibular body, left Diff
a, CVb, (IC Single d and average e) 0.09, 4.58, (0.96–0.98)
CCC(95%CI), Pearson ρ, BCF 0.96(0.92–0.97), 0.96, 1.00
Minimum ramus breadth (n = 59) Diff
a, CVb, (IC Single d and average e) 0.07, 0.78, (1.00–1.00)
CCC(95%CI), Pearson ρ, BCF 1.00 (0.99–1.00), 1.00, 1.00
Mandibular angle, right Diff
a, CVb, (IC Single d and average e) 0.70, 1.56, (0.93–0.97)
CCC(95%CI), Pearson ρ, BCF 0.93(0.89–0.95), 0.93, 0.97
Mandibular angle, left Diff
a, CVb, (IC Singlec and averaged) 0.73, 1.64, (0.93–0.97)
CCCe (95%CI), Pearson ρf, BCFg 0.92(0.88–0.95), 0.93, 0.99
Mandibular notch depth, right (n = 59) Diff
a, CVb, (IC Singlec and averaged) 0.70, 7.14, (0.85–0.91)
CCCe (95%CI), Pearson ρf, BCFg 0.80(0.70–0.87), 0.86, 0.94
Mandibular notch depth, left (n = 56) Diff
a, CVb, (IC Singlec and averaged) 0.47, 3.84, (0.96–0.98)
CCCe (95%CI), Pearson ρf, BCFg 0.94(0.90–0.96), 0.97, 0.98
adifference; bcoefficient of variation (%); Intraclass correlation: csingle and daverage; concordance correlation coefficient (95%CI); fPearson’s ρ (precision); gBias correction factor C
Table 4. Descriptive statistics of the measurements using the mandible statibilizer (MS) and the tomographic measurements (GS, golden standard) for each sex.
Variable
Descriptive measurements
Male Female
Cat Obs Mean SD Min Max Obs Mean SD Min Max Diff p
Maximum mandibular length
MS 32 104.06 6.20 89.79 116.76 28 97.96 6.81 82.70 109.47 6.10 0.001
GS 32 107.86 6.62 92.96 122.83 28 103.40 6.12 89.70 115.77 4.46 0.001
Bigonial width MS 32 92.76 6.65 81.21 107.87 28 86.20 5.24 76.17 99.05 6.57 0.001
GS 32 91.81 5.89 82.31 104.34 28 84.51 4.99 75.77 96.19 7.30 0.001
Maximum ramus height, right**
MS 32 59.19 6.06 44.62 70.15 28 52.71 5.15 38.97 62.08 6.48 0.001
GS 32 59.28 5.97 36.38 70.55 28 53.73 5.51 41.87 68.00 5.56 0.001
Maximum ramus height, left (n= 59)
MS 32 58.39 5.33 47.38 67.77 27 51.59 4.66 44.18 61.37 6.79 0.001
GS 32 59.64 5.52 47.12 71.60 27 52.61 5.17 42.95 63.59 7.03 0.001
Mandibular length (projection) (n = 59)
MS 32 71.09 5.71 61.23 81.74 28 69.18 4.06 59.99 77.48 1.91 0.146
GS 32 73.07 4.87 64.79 86.31 28 70.60 3.86 62.28 79.57 2.46 0.036
Bicondylar breadth MS 32 116.73 6.35 102.49 131.20 27 111.13 4.98 99.65 119.50 5.60 0.001 GS 32 116.42 6.97 98.29 131.39 27 110.49 6.23 89.36 119.28 5.93 0.001
Bicoronoid breadth MS 32 95.63 6.53 78.85 113.02 28 91.34 4.92 80.45 99.41 4.28 0.006 GS 32 95.94 6.58 78.58 113.23 28 90.79 5.71 73.89 99.33 5.15 0.002
Mandibular notch breadth, right (n = 59)
MS 32 32.62 3.50 25.22 39.81 28 30.85 2.86 23.61 38.03 1.77 0.003
GS 32 32.97 3.29 24.93 38.42 28 31.31 3.17 23.05 38.58 1.66 0.050
Mandibular notch breadth, left (n = 59)
MS 32 33.47 3.46 25.89 39.33 27 30.98 2.64 26.36 37.64 2.49 0.003
GS 32 33.91 2.97 27.33 38.65 27 31.29 2.62 25.64 38.41 2.63 0.001 Height of the mandibular
body at the mental foramen, right
MS 32 25.39 5.18 12.76 35.60 28 21.25 5.21 9.26 30.41 4.14 0.001
GS 32 25.85 5.35 13.55 35.55 28 20.91 5.84 9.34 32.67 4.95 0.001
Height of the mandibular body at the mental foramen, left
MS 32 25.73 5.76 8.59 35.83 28 21.36 5.12 9.66 30.65 4.37 0.001
GS 32 26.39 6.17 9.09 35.99 28 21.24 5.98 8.58 31.41 5.14 0.001
Bimental breadth MS 32 45.34 3.21 39.19 50.91 28 43.63 2.43 38.85 49.80 1.71 0.024 GS 32 46.47 3.72 34.83 51.72 28 44.58 2.46 39.33 50.28 1.89 0.001
Breadth of the mandibular body, right
MS 32 10.65 2.31 6.11 16.58 28 9.88 1.44 6.90 13.47 0.77 0.135
GS 32 15.97 5.05 7.06 25.43 28 14.14 4.26 9.11 25.27 1.83 0.001
Breadth of the mandibular body, left
MS 32 10.30 2.57 4.94 17.47 28 9.84 1.70 6.41 14.29 0.45 0.432
GS 32 15.96 4.81 8.49 24.74 28 13.81 4.03 9.27 24.00 2.15 0.067
Minimum ramus breadth (n = 59)
MS 31 29.97 4.06 22.06 38.59 28 28.35 2.70 23.54 34.24 1.62 0.079
GS 31 30.85 4.13 23.80 40.13 28 29.23 2.72 24.10 35.04 1.62 0.083
Mandibular angle, right MS 32 121.20 7.31 110.00 137.00 28 123.50 7.15 111.00 138.00 -2.30 0.215 GS 32 127.55 8.26 113.45 145.60 28 130.61 6.92 116.86 142.29 -3.06 0.128
Mandibular angle, left MS 32 122.22 7.73 111.00 137.00 28 124.27 7.43 112.00 138.00 -2.05 0.301 GS 32 128.54 8.64 111.58 146.76 28 131.12 7.09 116.25 141.43 -2.58 0.215
Mandibular notch depth, right (n = 59)
MS 32 13.82 1.80 9.80 17.19 27 12.41 1.93 8.56 16.02 1.41 0.005
GS 32 13.69 1.78 9.99 16.90 27 12.33 1.98 8.95 16.61 1.36 0.006
Mandibular notch depth, left (n = 56)
MS 31 13.77 1.91 9.74 16.59 25 12.50 2.24 8.26 16.00 1.28 0.025
GS 31 13.78 1.96 9.61 16.73 25 12.52 2.18 8.48 16.32 1.25 0.027
Table 5. ROC curve of the measurements using the mandible stabilizer (MS) and the tomographic measurements (GS, golden standard) for each sex.
Variable ROC curve for each sex (n = 60)
Cat. Area under the ROC curve (p) Associated criterion Sensibility-specificity
Maximum mandibular length MS 0.739 (0.001) > 101.68 78.12–64.29
GS 0.686 (0,008) > 105.19 71.97–64.29
Bigonial width MS 0.778 (0.001) > 89.95 65.62–82.14
GS 0.823 (0.001) > 90.43 62.50–89.29
Maximum ramus height, right** MS 0.794 (0.001) > 55.70 75.00–78.57
GS 0.797 (0.001) > 54.79 93.75–60.71
Maximum ramus height, left (n= 59) MS 0.882 (0.001) > 56.54 75.00–85.19
GS 0.819 (0.001) > 57.84 75.00–85.19
Mandibular length (projection) (n = 59) MS 0.593 (0.210) > 72.89 40.63–85.71
GS 0.643 (0.048) > 72.33 56.25–75.00
Bicondylar breadth MS 0.758 (0.001) > 113.58 78.12–66.67
GS 0.760 (0.001) > 114.81 65.62–81.48
Bicoronoid breadth MS 0.708 (0.001) > 96.98 43.75–96.43
GS 0.747 (0.001 > 97.21 46.88–96.43
Mandibular notch breadth, right (n = 59) MS 0.650 (0.037 > 31.47 68.75–60.71
GS 0.646 (0.043) > 33.37 46.88–85.71
Mandibular notch breadth, left (n = 59) MS 0.729 (0.001) > 30.41 84.37–59.26
GS 0.738 (0.001) > 32.62 62.50–85.19
Height of the mandibular body at the mental foramen, right
MS 0.710 (0.002) > 25.09 56.25–82.19
GS 0.732 (0,001) > 25.06 62.50–78.57
Height of the mandibular body at the mental foramen, left
MS 0.730 (0.001) > 22.52 75.00–64.29
GS 0.732 (0.001) > 24.20 71.87–67.86
Bimental breadth MS 0.670 (0.001) > 44.74 62.50–78.57
GS 0.689 (0.001) > 46.04 62.50–82.14
Breadth of the mandibular body, right MS 0.592 (0.209) > 11.41 31.25–92.86
GS 0.608 (0.147) > 16.25 50.00–78.57
Breadth of the mandibular body, left MS 0.531 (0.680) > 12.23 21.87–96.43
GS 0.638 (0.063) > 14.65 56.25–78.57
Minimum ramus breadth (n = 59) MS 0.618 (0.117) > 31.04 41.94–89.29
GS 0.615 (0.126) > 31.69 48.39–85.71
Mandibular angle, right MS 0.599 (0.178) > 122.00 65.62–53.57
GS 0.599 (0.182) > 122.90 28.12–92.86
Mandibular angle, left MS 0.573 (0.331) > 117.00 31.25–85.71
GS 0.587 (0.243) > 126.42 43.75–75.00
Mandibular notch depth, right (n = 59) MS 0.707 (0.002) > 13.11 71.87–66.67
GS 0.0.707 (0.023) > 13.11 71.87–66.67
Mandibular notch depth, left (n = 56) MS 0.665 (0.024) > 13.75 61.29–68.00
that the mandibular angle measurement has been
mainly used for age estimation.18
Multivariate analysis considering several skull and mandible characteristics at the same time achieves better
results than individual measurements.5 With more
cranial and mandibular traits analyzed, better results are
achieved. Walker 5 found that ive cranial traits evaluated
together classiied 90% of the individuals correctly.
It is necessary to perform studies in several populations to discriminate sex because temporal and spatial variations can contribute to differences
among different population groups.5 The MS should
be used in several populations, including ancient and modern, so that more precise sexual dimorphism parameters can be established. There are variations within and among populations because hormonal
and environmental factors can affect bone growth.19
An investigation performed using skulls and mandibles in South Africa showed that several mandibular characteristics were useful in studying the sexual dimorphism, and the measure that was
most dimorphic was bigonial breadth.4
The limitations of the study include focusing on a
speciic sample of the metropolitan area of São Paulo, Brazil from the Institute of Teaching and Research
in Forensic Sciences of Guarulhos. It is important to take into consideration that a documented sample
does not mean that it is representative of an entire
population group,20 as most worldwide collections
are used for convenience. Therefore, more studies are necessary in other population groups using the same methods to establish parameters for adequate measurements to elucidate sexual dimorphism in
modern and archaeological collections.20
Another aspect that should be discussed is that
the Brazilian population is mixed, so there is a low
probability of selecting mandibles from exclusively white, brown or black persons. In addition, when
the genomic ancestry of Brazilian individuals was
evaluated, low differences were observed among the
regions of the country. 21
Conclusion
The mandible stabilizer achieved the aim of discriminating sexual dimorphism using mandible measurements. Some measures exhibit an increased potential to differentiate sex compared with other measures.
Acknowledgments
This investigation was fund by the State of São
Paulo’s Research Fund (FAPESP, processes numbers 2012/19111-4 and 2014/13340-7).
1. Schmittbuhl M, Le Minor JM, Schaaf A, Mangin P. The human mandible in lateral view: elliptical fourier of the outline and their morphological analysis. Ann Anat.
2002;184(2):199-207. doi: 10.1016/S0940-9602(02)80021-8 2. Kranioti EF, Işcan MY, Michalodimitrakis M. Craniometric
analysis of the modern Cretan population. Forensic Sci Int.
2008;180(2-3):110.e1-5. doi:10.1016/j.forsciint.2008.06.018
3. Williams BA, Rogers T. Evaluating the accuracy and precision of cranial morphological traits for
sex determination. J Forensic Sci. 2006;51(4):729-35. doi:10.1111/j.1556-4029.2006.00177.x
4. Steyn M, Işcan MY. Sexual dimorphism in the crania and mandibles of South African whites. Forensic Sci Int. 1998;
98(1-2):9-16. doi:10.1016/S0379-0738(98)00120-0
5. Walker PL. Sexing skulls using discriminant function analysis of visually assessed traits. Am J Phys Anthropol.
2008;136(1):39-50. doi:10.1002/ajpa.20776
6. Schmittbuhl M, Rieger J, Le Minor JM, Schaaf A, Guy F. Variations of the mandibular shape in extant hominoids: generic, specific, and subspecific quantification using elliptical fourier analysis in lateral view. Am J Phys
Anthropol. 2007;132(1):119-31. doi:10.1002/ajpa.20476 7. De Villiers H. The skull of the South African Negro.
Johannesburg: Witwatersrand University Press, 1968.
8. Rogers T, Saunders S. Accuracy of sex determination using morphological traits of the human pelvis. J
Forensic Sci. 1994;39(4):1047-56. doi:10.1520/JFS13683J
9. Loth SR, Henneberg M. Mandibular ramus lexure: a new morphologic indicator of sexual dimorphism in the human
skeleton. Am J Phys Anthropol. 1996;99(3):473-85. doi:10.1002/ (SICI)1096-8644(199603)99:3<473::AID-AJPA8>3.0.CO;2-X
10. Patriquin ML, Loth SR, Steyn M. Sexually dimorphic pelvic morphology in South African whites and blacks.
11. Recommendations for age and sex diagnoses of skeletons.
J Hum Evolut. 1980;9(7):517-49. doi:10.1016/0047-2484(80)90061-5
12. Haun SJ. Brief communication: a study of the predictive
accuracy of mandibular ramus flexure as a singular morphologic indicator of sex in an archaeological sample.
Am J Phys Anthropol. 2000 Mar;111(3):429-32. doi:10.1002/(SICI)1096-8644(200003)111:3<429:: AID-AJPA9>3.0.CO;2-1
13. Squarcia SM, Sidorkewicj NS, Camina R, Casanave
EB. Sexual dimorphism in the mandible of the
armadillo Chaetophractus villosus (Desmarest, 1804) (Dasypodidae) from northern Patagonia,
Argentina. Braz J Biol. 2009;69(2):347-52. doi:10.1590/S1519-69842009000200016
14. Azevedo AC, Alves NZ, Michel-Crosato E,
Rocha M, Cameriere R, Biazevic MG. Dental age estimation in a Brazilian adult population using Cameriere’s method. Braz Oral Res. 2015;29(1):1-9. doi:10.1590/1807-3107BOR-2015.vol29.0016
15. Carvalho SP, Brito LM, Paiva LA, Bicudo LA, Crosato EM, Oliveira RN. Validation of a physical anthropology methodology using mandibles for gender estimation in
a Brazilian population. J Appl Oral Sci. 2013;21(4):358-62. doi:10.1590/1678-775720130022
16. Lin C, Jiao B, Liu S, Guan F, Chung NE, Han SH et al.
Sex determination from the mandibular ramus flexure of Koreans by discrimination function analysis using
three-dimensional mandible models. Forensic Sci Int. 2014;236:191.e1-6. doi:10.1016/j.forsciint.2013.12.015 17. Giles E. Sex determination by discriminant function
analysis of the mandible. Am J Phys Anthropol.
1964;22(2):129-35. doi:10.1002/ajpa.1330220212
18. Vodanovic M, Dumancic J, Demo Z, Mihelic D. Determination of sex by discriminant function analysis of mandibles from two Croatian archaeological sites. Acta
Stomatol Croat. 2006;40(3):263-77.
19. Balci Y, Yavuz MF, Cağdir S. Predictive accuracy of sexing
the mandible by ramus flexure. Homo. 2005;55(3):229-37. doi:10.1016/j.jchb.2004.07.006
20. Komar DA, Grivas C. Manufactured populations: what do contemporary reference skeletal collections represent? A comparative study using the Maxwell Museum documented collection. Am J Phys Anthropol.
2008;137(2):224-33. doi:10.1002/ajpa.20858
21. Pena SD, Di Pietro G, Fuchshuber-Moraes M, Genro JP,
Hutz MH, Kehdy Fde S, et al. The genomic ancestry of