Joana Mensurado Cartaxo Índias Coelho
Licenciada em Biologia
Disclosing the caffeine dose to be administered that
restores insulin sensitivity in prediabetes animal
models
Dissertação para obtenção do Grau de Mestre em
Genética Molecular e Biomedicina
Orientador: Doutora Sílvia Margarida Vilares Santos Conde, Professora Auxiliar da
Faculdade de Ciências Médicas da Universidade Nova de Lisboa
Júri:
Presidente: Prof. Doutora Paula Maria Theriaga Mendes Bernardo Gonçalves
Arguente: Prof. Doutor Ricardo Alexandre da Silva Santos Afonso
Vogal: Prof. Doutora Sílvia Margarida Vilares Santos Conde
Novembro, 2014
Joana Mensurado Cartaxo Índias Coelho
Licenciada em Biologia
Disclosing the caffeine dose to be administered that
restores insulin sensitivity in prediabetes animal
models
Dissertação para obtenção do Grau de Mestre em
Genética Molecular e Biomedicina
Orientador: Doutora Sílvia Margarida Vilares Santos Conde, Professora Auxiliar da
Faculdade de Ciências Médicas da Universidade Nova de Lisboa
Júri:
Presidente: Prof. Doutora Paula Maria Theriaga Mendes Bernardo Gonçalves
Arguente: Prof. Doutor Ricardo Alexandre da Silva Santos Afonso
iii
“Disclosing the caffeine dose to be administered that restores insulin sensitivity in prediabetes animal models”Copyright Joana Mensurado Cartaxo Índias Coelho, FCT/UNL, UNL
v
The results discussed in this thesis originated the following communications in International and National congresses:Sacramento JF, Coelho JC, Melo BF, Guarino MP and Conde SV. (2014) Assessment of caffeine dose and time of administration required for resetting insulin sensitivity in high sucrose diet in rats. 50th Meeting of EASD (European Association for the study of Diabetes), 14-19 September, Vienna, Austria
Coelho JC, Melo BF, Sacramento JF, Guarino MP and Conde SV (2014). Establishing the caffeine dose that chronically restores insulin sensitivity in animal model of prediabetes. Fundação Astrazeneca Innovate Competition,iMed conference 6.0®, 10-12 October, Lisboa, Portugal
Also, during the last year I was involved in other ongoing projects that originated the following communications:
Coelho JC, Melo BF, Sacramento JF, Ribeiro MJ, Guarino MP and Conde SV (2014). Are the effects of carotid sinus nerve resection on insulin sensitivity mediated by an increase in Glut4 expression in skeletal muscle?. XLIV Reunião Anual da Sociedade Portuguesa de Farmacologia, XXXII Reunião de Farmacologia Clínica e XIII Reunião de Toxicologia, 5-7 February, Coimbra, Portugal
vii
Acknowledgement
Em primeiro lugar gostaria de agradecer à Profª Doutora Silvia Conde por me ter aceitado e recebido da melhor maneira no projeto e no grupo. Agradeço também toda a confiança depositada em mim e por me dar oportunidade de trabalhar noutros projetos, que permitiram evoluir e melhorar o meu método de trabalho. Agradeço também o apoio incondicional bem como todos os conhecimentos por ela transmitidos que foram fundamentais para a concretização e finalização deste projeto. Agradeço ainda pelas palavras de motivação nas alturas mais críticas e por ter demonstrado confiança em mim quando esta me faltou.
Agradeço também à Maria João Ribeiro e à Joana Sacramento por toda a paciência, pela ajuda prestada e conhecimentos transmitidos ao longo deste ano. Pelos momentos divertidos que fizeram o ponto alto dos dias mais complicados. Pelas palavras sábias de motivação como “Tu orienta-te” e “Foca
-te”. Obrigada!
Agradeço à Bernardete Melo, a minha grande companheira nesta aventura. Obrigada pelo teu apoio e preocupação, pelos desabafos, pelas gargalhadas que démos que foram fundamentais para a manter a nossa sanidade mental. Muito obrigada mesmo!
Ao laboratório de Farmacologia FCM/UNL, à Profª Doutora Sofia Pereira, à Doutora Joana Batuca e, em especial, à Inês Faustino, à Aline Marinho, à Clara Dias, à Nádia Grilo e à Raquel Antunes por estarem sempre prontas a ajudar e a esclarecer as minhas dúvidas e pelos momentos descontraídos e divertidos que me proporcionaram.
Às minhas grandes amigas, à Catarina Cartaxo, à Filipa Lopes, à Inês Santos e à Mafalda Almeida pela grande amizade que mantemos e pela qual vos agradeço do fundo do coração. Por me fazerem sentir especial e por todo o apoio e momentos que já vivemos juntas. Obrigada meninas!
Aos restantes amigos que tornam a minha vida mais completa. Obrigada pela amizade e pelo apoio!
Ao meu irmão e em especial aos meus Pais pelo amor incondicional que tem por mim e por acreditarem em mim e nas minhas decisões. Por todos os valores e educação transmitidos que me tornaram na pessoa que sou hoje. Um simples e profundo Obrigada!
Ao resto da minha enorme família, que mesmo não estando muitas vezes juntos, nos cruzamos todos os dias em pensamentos. Obrigada!
À Brownie, ao Gastão e à Pinta.
ix
Resumo
A diabetes tipo 2 é uma doença que afeta milhões de indivíduos contribuindo significativamente para a morbilidade e mortalidade no mundo. Nas últimas décadas tem sido descrito um efeito benéfico do consumo crónico de café na diabetes e na síndrome metabólica. O nosso grupo demonstrou que o consumo crónico de cafeína (1g/l) em ratos previne a insulino-resistência induzida por dietas hipercalóricas. Assim, o objetivo deste trabalho foi investigar qual a dose terapêutica de cafeína que restaura a sensibilidade à insulina num modelo de pré-diabetes. As experiências foram levadas a cabo em ratos Wistar. O modelo patológico utilizado foi o rato HSu, que se obtém através do consumo de sacarose na água (35%) durante 28 dias. Foi testado o efeito de várias doses de cafeína (0.5, 0.75 e 1g/l) em animais controlo e HSu durante 12 semanas na: sensibilidade à insulina, glicémia basal, tolerância à glucose, massa adiposa, expressão de transportadores Glut4 no músculo-esquelético e na concentração de nitric oxide (NO) no músculo-esquelético e no fígado. Demonstrou-se que a administração crónica de cafeína restaura a sensibilidade à insulina e a tolerância à glucose no modelo HSu, sendo o período de reversão inversamente proporcional à concentração de cafeína Observou-se que os animais HSu não aumentam de peso em relação aos controlos, embora possuam um aumento de massa gorda. A ingestão de cafeína não alterou o aumento de peso/dia e massa gorda quer nos animais controlo quer nos HSu. A ingestão de cafeina (1g/l) reverteu os níveis de expressão de Glut4 no músculo nos animais HSu. Os níveis de NO diminuíram no músculo-esquelético, e não no fígado, com a deita HSu e a cafeína foi incapaz de os alterar. Em conclusão, a cafeína pode ser utilizada como uma ferramenta terapêutica para o tratamento da prédiabetes e para a prevenção das doenças metabólicas.
xi
Abstract
Type 2 diabetes mellitus (T2DM) is a chronic disease affecting millions of individuals, contributing to significant morbidity and mortality worldwide. Caffeine is the most widely consumed psychoactive substance in the world and recently several epidemiological studies described beneficial effects of chronic coffee intake on T2DM and metabolic syndrome. Our group has shown that chronic caffeine intake (1g/l) prevents the development of insulin resistance and hypertension in diet-induced insulin resistante rats. Therefore, the main objective of this work was to investigate the therapeutic dose of caffeine that restores insulin sensitivity in a prediabetic animal model. Experiments were performed in Wistar rats. The prediabetic animal model used was the high sucrose (HSu) model, which is obtained by submitting the animals to 35% of sucrose in drinking water during 28 days. The effect of chronic caffeine (0.5, 0.75 and 1g/l) was tested in control rats and in HSu model during 12 weeks assessing: insulin sensitivity, basal glycemia, glucose tolerance, adipose tissue mass, Glut4 transporters and nitric oxide (NO) content in skeletal muscle and in the liver. We have seen that chronic caffeine intake restores insulin sensitivity and glucose tolerance in HSu rats, being the latency time inversely correlated with caffeine concentration. Also, HSu diet did not change weight gain comparing with controls but increased fat mass. Caffeine intake did not alter weight gain/day and fat mass. Caffeine (1g/l) restores Glut4 expression levels in skeletal muscle in HSu animals. NO levels decrease in skeletal muscle in HSu animals, but not in the liver, and caffeine did not modify these levels. These results suggest that caffeine can be used as a therapeutical tool for the treatment of prediabetes and prevention of T2DM.
xiii
Table of contents
Acknowledgement ... vii
Resumo ... ix
Abstract... xi
Table of contents ... xiii
Figures ... xv
Tables ... xvii
Abbreviations ... xix
1. Introduction ... 1
1.1 Type 2 Diabetes mellitus ... 1
1.1.1. Insulin signalling pathways ... 3
1.1.2 Glucose homeostasis ... 4
1.1.3 Alterations in insulin action and glucose homeostasis in type 2 diabetes mellitus ... 6
1.2 Caffeine ... 8
1.2.1 Metabolism and cellular mechanism of action ... 8
1.2.2 Caffeine and adenosine ... 9
1.2.3 Caffeine, adenosine and Nitric Oxide ... 10
1.2.4 Acute vs chronic caffeine action on insulin sensitivity ... 11
1.3 General and specific objectives ... 13
2. Methods ... 15
2.1 Animals and experimental procedures ... 15
2.2 Insulin Tolerance Test ... 16
2.3 Oral Glucose Tolerance Test ... 16
2.4 Collection of tissues ... 16
2.5 Glut4 Protein quantification by Western Blot ... 16
xiv
2.7 Drugs and chemicals ... 18
2.8 Data Analysis ... 18
3. Results ... 19
3.1 Effect of chronic caffeine intake in caloric intake and rats weight ... 19
3.2 Effect of chronic caffeine intake on fasting glycemia and insulin sensitivity ... 20
3.3 Effect of chronic caffeine intake on glucose tolerance ... 23
3.4 Effect of chronic caffeine intake on Glut4 skeletal muscle protein expression ... 24
3.5 Effect of chronic caffeine intake on NO production in skeletal muscle and liver ... 25
4. Discussion ... 27
5. Conclusion ... 33
6. Future work ... 35
xv
Figures
Figure 1.1 – Mechanism involved in Type 2 Diabetes Mellitus (T2DM) Pathogenesis. ... 1
Figure 1.2 – Schematic representation of natural history of type 2 diabetes mellitus (T2DM). ... 2
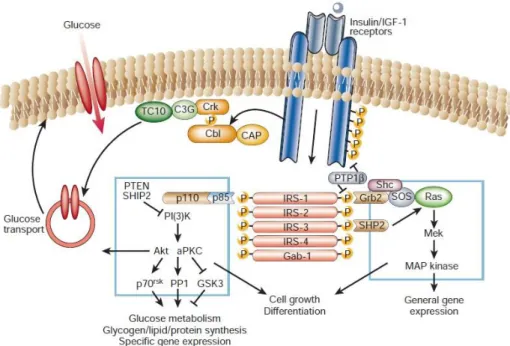
Figure 1.3 – Schematic representation of Insulin signalling pathways. ... 4
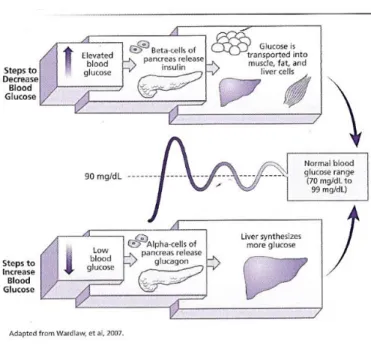
Figure 1.4 – Schematic representation of glucose homeostasis. ... 5
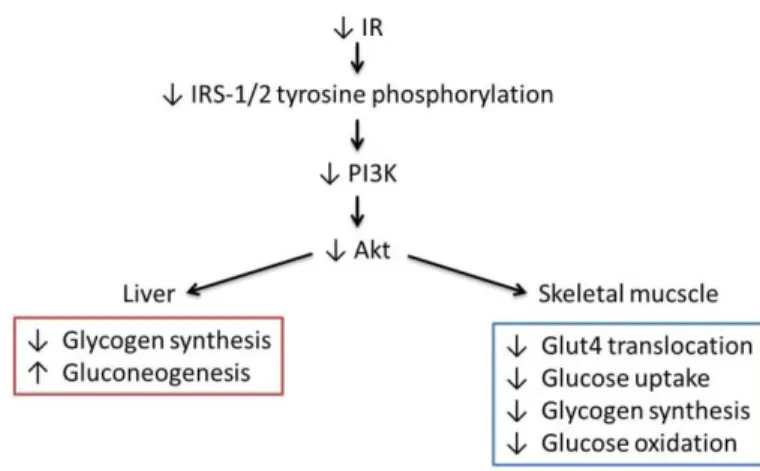
Figure 1.5 – Alterations in insulin signaling pathways that contribute to insulin resistance in the insulin-sensitive tissues, liver and skeletal muscle. ... 7
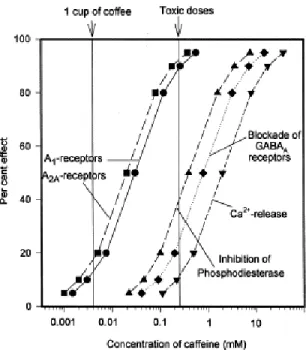
Figure 1.6 - Effect of caffeine on different biochemical targets in relation to its levels in humans (Fredholm et al, 1999). ... 9
Figure 3.1 - Effect of chronic caffeine administration on fasting glycemia in control and high-sucrose (HSu) animals. ... 21
Figure 3.2 - Effect of chronic caffeine intake on insulin sensitivity determined by the insulin tolerance test and expressed as the constant rate for glucose disappearance (KITT) in control and high-sucrose (HSu) animals. ... 22
Figure 3.3 - Effect of chronic caffeine intake on glucose tolerance determined by the oral glucose tolerance test, in control and high-sucrose (HSu) animals. ... 23
Figure 3.4 – Effect of chronic caffeine intake on Glut4 transporters expression in skeletal muscle in control and high-sucrose (HSu) animals. ... 24
xvii
Tables
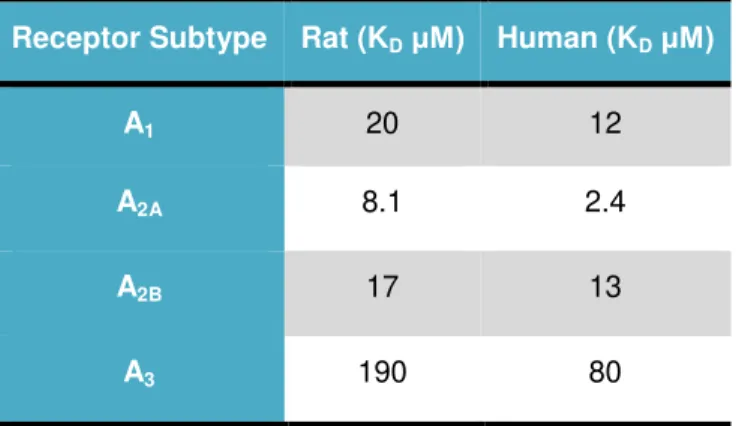
Table 1.1 – Potency of caffeine at rat and human adenosine receptors subtypes (Adapted from Fredholm et al., 1999) ... 10
Table 3.1 – Effect of chronic caffeine administration on caloric Intake in control and High sucrose diet animals. ... 19
xix
Abbreviations
AMP –Adenosine 5’-monophosphate
AMPK – AMP-activated protein kinase
ANOVA – Analysis of variance
ATP – Adenosine triphosphate
AUC – Area Under the Curve
cAMP –3’-5’-cyclic adenosine monophosphate
FFA – Free fatty acids
FGP – Fasting plasma glucose
Glut – Glucose transporters
Glut 1 – Glucose transporters
Glut 2 – Glucose transporters type 2
Glut 4 – Glucose transporters type 4
HDL – High-density lipoprotein
HGP – Hepatic glucose production
HOMA - Homeostasis model assessment
HPLC - High-performance liquid chromatography
HSu – High-Sucrose
IL-6 – Interleukin 6
IRS – Insulin receptor substrates
ITT – Insulin tolerance test
KITT– Insulin tolerance constant
LDL – Low-density lipoprotein
MAPK – Mitogenic activated protein kinase
NO – Nitric Oxide
xx
OGTT – Oral glucose tolerance testPI3K – phosphatidylinositol
PKB/Akt – Protein kinase B
SAH – s-adenasyl-homocysteine
SH2 – src-homology 2
T2DM – Type 2 diabetes mellitus
TBS – Tris-buffered saline
1
1. Introduction
1.1 Type 2 Diabetes mellitus
Metabolic diseases, like type 2 diabetes mellitus (T2DM) and metabolic syndrome affects millions of individuals globally, contributing to significant morbidity and mortality worldwide. Diabetes affects over 8.3% of the world population and it is expected that in 2035 affects over than 592 millions of people worldwide (IDF, 2013). This escalate represents an alarming health problem with severe economic and social repercussions being imperative to better define the biological mechanisms causing metabolic diseases and to identify prevention strategies and treatment interventions that would help stem this epidemic.
From all types of diabetes the one that have been increasing worldwide is T2DM due to economic development, obesity, changes in diets and increased sedentary lifestyles. The criteria for the T2DM
defined by the American Diabetes Association in 2014 is A1C ≥6.5% or fasting plasma glucose (FPG) ≥126 mg/dl or 2-h plasma glucose ≥200 mg/dl during an oral glucose tolerance test (OGTT) or in a patient with classic symptoms of hyperglycemia or hyperglycemic crisis, a random plasma glucose ≥200mg/dl
(ADA, 2014).Insulin resistance and pancreatic β-cell dysfunction are the main abnormalities that play a central role in T2DM pathogenesis (figure 1.1). Insulin resistance can be defined as a state of reduced responsiveness by insulin target organs (the liver, the muscle and adipose tissue) to normal circulating levels of insulin. In fact, the imbalance between insulin secretion and action lead to hyperglycemia (Kahn, 2003; Wein and Florez, 2009).
2
The response of the β-cell to a chronic hypercaloric ingestion and insulin resistance is a compensatory insulin secretion to maintain normoglycemia. Individuals that develop T2DM show an increase in insulin levels in the normoglycemic and prediabetes phases that maintain normal glycemia despite the insulin resistance due to β-cell compensation (DeFronzo, 2004) (figure 1.2). β-cell compensation involves the expansion of cell mass, enhanced insulin biosynthesis and increased nutrient-secretion coupling (Prentki and Nolan, 2006). Over time, β-cell compensation for insulin resistance startsto fail, resulting in a decline of β-cell function associated with a loss of β-cell mass, that progressively leads to late phase of T2DM (Leahy et al., 2005; Butler et al., 2003).
Several mechanisms have been proposed to be involved in the early dysfunction of β-cell including mitochondrial dysfunction, oxidative stress, endoplasmatic reticulum stress, dysfunctional triglyceride/free fatty acid (FFA) cycling and glucolipotoxicity (Ríos and Fuentes, 2009; Poitout and Robertson, 2002) (figure 1.1). Once hyperglycemia has been developed, other mechanisms as islet inflammation and O-linked glycosilation accelerate the damage, resulting in severe β-cell alterations and
loss of β-cell mass by apoptosis (Ríos and Fuentes, 2009).
Figure 1.2 – Schematic representation of natural history of type 2 diabetes mellitus (T2DM). Relationship between glucose concentration (mg/dl) and the relative function (%) of insulin resistance and insulin level throughout the development of T2DM. In the beginning is observed an increase in insulin resistance which is compensated with an augment in insulin levels (increase in β-cell function), that maintain normal glucose
3
There are two main risk factors for T2DM development, one is based on genetic characteristics (age, gender, race, T2DM family history, genetic predisposition) and other based on lifestyle (obesity, physical inactivity, metabolic syndrome, pre-diabetes, diet) (Leu and Zonszein, 2010; Zimmet and Shaw, 2009) (figure 1.1).The first therapeutic approach for T2DM is based on alterations in lifestyle, as encourage weight loss and physical activity with the objective of reducing glycemia and insulin resistance in order to delay drug therapeutic intervention (Ajala et al., 2013; Morsink et al., 2013; Zanuso et al., 2010).
1.1.1. Insulin signalling pathways
Insulin is a polypeptide hormone secreted by β-cells of pancreatic islets of Langerhans, which maintains normal glucose blood levels by promoting glucose uptake by cells. Insulin secretion is induced mainly by glucose in healthy individuals, and the pancreatic response to glucose is biphasic: the first phase representing the release of insulin already synthesised and stored, and the second one representing both stored and newly synthesised insulin (Wilcox, 2005).
Insulin mediates its action through the binding to insulin receptor. Insulin receptor is a glycoprotein
constituted by an extracellular α-subunit and an extracellular, transmembranar and intracellular β-subunit
that express tyrosine kinase activity. When insulin binds to the insulin binding domain, in α-subunit,
promotes the dimerization of the receptor to form the α2β2 complex and induces the autophosphorylation
of β-subunit activating the insulin receptor tyrosine kinase (Gou, 2014).
When activated, insulin receptor tyrosine kinase phosphorylates specific intracellular proteins including insulin receptor substrates (IRS) 1 and 2, in muscle and liver, respectively. IRS proteins, when phosphorylated, function as recognition sites for proteins containing src-homology 2 (SH2) domains like 85-kDa regulatory subunit of phosphatidylinositol (PI3K) activating the PI3K→Protein Kinase B (PKB/Akt)
signalling cascade (see for a review see Gou, 2014). PI3K, through activation of Akt promotes glucose transport, glucose metabolism, glycogen, lipid and protein synthesis (figure 1.3) (Saltiel and Kahn, 2011;
Wilcox, 2005). IRS phosphorylation also actives RAS→Mitogenic-Activated-Protein Kinase (MAPK) cascade which mediates the effect of insulin on mitogenesis and cell growth (figure 1.3) (Gou, 2014).
Insulin signalling pathways activation, namely PI3K→Akt pathway also promotes glucose
4
Figure 1.3 – Schematic representation of Insulin signalling pathways. Binding of insulin to its receptor leads to the phosphorylation of insulin receptor substract (IRS) originating the activation of several cascades like, phosphatidylinositol (PI3K), Protein Kinase B (Akt) Ras and Mitogenic-Activated-Protein Kinase (MAPK). Insulin action in cells is involved in general gene expression, cell growth differentiation, glucose metabolism, glycogen/lipid/protein synthesis, specific gene expression and glucose transport. (Saltiel and Khan, 2001).1.1.2 Glucose homeostasis
5
Figure 1.4 – Schematic representation of glucose homeostasis. Mechanisms that promote blood glucoseincrease/decrease. When blood glucose levels are elevated the pancreatic β-cells starts to produce and release insulin. The hyperinsulemia induce glucose uptake by peripheral tissues (skeletal muscle, adipose tissue and liver). On the other hand, hypoglycemia inhibits insulin release and promotes pancreatic glucagon release. Glucagon, which is the major counterpart of insulin, stimulates glucose production by the liver. (Adapted from Wardlaw and Hampl (2007).
Also glucagon secretion, which is the major counterpart of insulin in the regulation of plasma glucose, is inhibited by hyperinsulinemia leading to the suppression of hepatic glucose production (DeFronzo, 2004; Muhammad and Gerich, 2010). Skeletal muscle is the major site of glucose uptake in prostprandial state (DeFronzo and Tripathy, 2009) and glucose when captured by muscle can be store as glycogen or go to glycolysis where it can be totaly oxidated or release at glycolysis intermediates (lactate, alanine, pyruvate) (Kelley et al., 1988).
Despite the major site of glucose uptake is the skeletal muscle, insulin plays an important role in adipose tissue by inhibiting lipolysis (Groop et al., 1989). The inhibition of lipolysis prevents FFA release promoting glucose uptake by the skeletal muscle and inhibiting hepatic and renal gluconeogenesis. Hyperglycaemia also blocks glucagon release that will inhibit hepatic glycogenolysis (DeFronzo, 2004).
6
(Bell et al., 1990). Each glucose transporter isoform plays a specific role in glucose metabolism determined by its pattern of tissue expression, substrate specificity, transport kinetics, and regulated expression in different physiological conditions. There are 14 Glut proteins expressed in human (Thorens and Mueckler, 2010), but in the major peripheral insulin target tissues, skeletal muscle and adipose tissue, Glut 4 is the predominant transporter (DeFronzo, 2004). In these tissues, after exposure to insulin, Glut 4 concentrations on plasma membrane increased as the concentrations on intracellular pool decreased (DeFronzo, 2004). In liver and brain the predominant glucose transporters are Glut 2 and Glut 1, respectively.1.1.3 Alterations in insulin action and glucose homeostasis in type 2
diabetes mellitus
T2DM is characterized by alterations in glucose homeostasis namely insulin resistance in liver, muscle and adipose tissue and impaired insulin secretion (DeFronzo, 2004).
In the fasting state, T2DM subjects shows an increased hepatic glucose production (HGP) due to enhanced gluconeogenesis (Magnusson et al., 1992), which is higher with the severity of fasting hyperglycaemia (Jeng et al., 1994). Also, these subjects exhibit increased insulin plasma levels when compared with normal subjects, and liver insulin resistance, as hyperglycemia and hyperinsulinemia are inhibitors of HGP (Campbell et al., 1988; DeFronzo, 2004; Magnusson et al., 1992). In fact many mechanisms have been shown to increased hepatic gluconeogenesis, like: hyperglucagonemia, enhanced sensitivity to glucagon, increased FFA oxidation and insulin resistance (DeFronzo, 2004).
7
pathway, as IRS-1 and 2 tyrosine phosphorylation and subsequent PI3K association and activity are altered (DeFronzo, 2004; Fröjdö et al., 2009). The genetic loss of IRS-1 and 2 leads to the inactivation ofPI3K→Akt signalling pathway and this inactivation can elucidate the prevalence of insulin resistance and
its association with T2DM (see review:Gou, 2014). Thereby, defects on PI3K→Akt signalling pathway,
both in the liver and skeletal muscle, will lead to an increase in gluconeogenesis, defects on glucose metabolism and transport (figure 1.5) contributing to insulin resistance.
Free fatty acids (FFA) are another mediator that is known to be involved in the development of insulin resistance (Boden, 1997). FFA are stored as triglycerides in adipocytes, and during fasting conditions are used as an energy source (DeFronzo, 2004). Triglycerides are hydrolysed by adipose tissue lipases, and FFA released to the circulation. Insulin is an anti-lipolytic hormone and prevents FFA release through the inhibition of triglyceride hydrolyse. In patients with T2DM the concentrations of FFA in plasma are high, showing an impaired insulin action on lipolysis (Reaven et al., 1988; Swislocki et al., 1987). It is also known, that increased FFA concentrations inhibit glucose uptake by skeletal muscle, decreasing insulin secretion in the pancreas and promoting hepatic glucose production. In fact, in the postprandial state, lipolysis rate is increased despite the increased in insulin levels (DeFronzo, 2004; Eriksson et al., 1999). It was also seen that exogenous insulin in T2DM subjects fail to reduce lipolysis failing in decrease FFA plasma levels (Groop el tal., 1989).
8
1.2 Caffeine
Caffeine (1, 3, 7-trimethylxantine) is the most widely consumed psychoactive substance in the world. It is found in varying quantities in the beans, leaves, and fruits of more than 60 plants and is present in common beverages including coffee, tea, soft drinks and in products containing cocoa. Among different beverages, coffee has in general the highest value of caffeine concentration compared to tea, soft drinks and energy drinks (Heckman et al, 2010). Caffeine consumption from all sources can be estimated to be about 70-76 mg/person/day, yet it can be higher in some countries like USA, Canada, UK Sweden and Finland (Fredholm et al., 1999). In these countries, except UK, coffee accounts for the majority of the daily caffeine consumption, where in UK tea is the beverage of choice (Heckman et al., 2010). Coffee has in their composition some substances that can affect glucose metabolism as caffeine, chlorogenic acid and magnesium (van Dam and Hu, 2005). It was seen that magnesium has an inverse association with risk of type 2 diabetes both in man and women (Lopez-Ridaura et al., 2004). Chlorogenic acid has an inhibitory effect on the hydrolysis of the glucose-6-phosphate, which could decrease glucose production (for a review see Higdon and Frei, 2006). Concerning caffeine effects, acute and chronic intake seems to have different consequences in glucose metabolism and in insulin sensitivity, which will be discussed below.
1.2.1 Metabolism and cellular mechanism of action
Once ingested, caffeine is absorbed in the gastrointestinal tract and is extensively metabolized in the liver (99%) (Fredholm et al., 1999) in three different metabolites: theophyline (1,3-dimethylxanthine); paraxanthine (1,7-dimethylxanthine); and theobromine (3,7-dimethyxanthine). Theophyline has a more potent effect that caffeine as an inhibitor of adenosine receptors and paraxanthine is also at least as potent as caffeine (Fredholm et al., 1999).
9
Figure 1.6 - Effect of caffeine on different biochemical targets in relation to its levels in humans (Fredholm etal, 1999).
1.2.2 Caffeine and adenosine
There are four known adenosine receptors subtypes named as A1, A2A, A2B and A3, which belong
to the superfamily of G-protein-coupled receptors (Jacobson and Gao, 2006). Of the four subtypes, A3 has
been shown to be poorly affected by caffeine, as by other methylxanthines. The antagonist effect of caffeine is more potent at A2A receptors, followed by A1 and finally A2B receptors (Table 1.1). During many
years it was thought that adenosine, at physiological concentrations, only acted at A1 and A2A receptors
and that A2B (or A3) was only activated under pathological concentrations of adenosine. Therefore, it was
thought that the mechanism of action of caffeine was through the inhibition of the A1 and A2A receptors.
However, nowadays it is known that the activation of the adenosine receptors not only depends of the adenosine levels but also on the density of the receptor subtypes existent in the site of action (Conde et al., 2009).
Adenosine is a product of adenosine triphosphate (ATP) metabolism, being an ubiquitous substance in cells. It exerts its action through the binding to its four different types of adenosine receptors (A1>A2A>A2B>A3). The four adenosine receptors have different affinity to endogenous adenosine, being
10
Table 1.1 – Potency of caffeine at rat and human adenosine receptors subtypes (Adapted from Fredholm etal., 1999)
Receptor Subtype Rat (KDμM) Human (KDμM)
A1 20 12
A2A 8.1 2.4
A2B 17 13
A3 190 80
Adenosine regulates many physiological processes and the equilibrium between disposable of endogenous adenosine and the density of adenosine receptors at the site of action help to control the distinct physiological responses. The role of adenosine on glucose homeostasis and insulin sensitivity is not consensual. In adipose tissue adenosine has the ability to inhibit lipolysis thought the A1 adenosine
receptors, which results in enhanced insulin sensitivity (see review: Koupenova and Ravid, 2014). However, in skeletal muscle adenosine action on insulin sensitivity it’s still controversial, as some authors
have seem that the application of A1 adenosine receptors antagonists enhanced muscle insulin sensitivity
and reverses insulin resistance (Budohoski et al., 1984; Challiss et al., 1984) while others showed that A1
adenosine receptors antagonists enhanced insulin resistance through the decreased of insulin-stimulated glucose uptake (Han et al., 1998). In the liver, adenosine action through A2 adenosine receptors enhanced
gluconeogenesis and glycogenolysis (Buxton et al., 1987; Bartrons et al., 1989).
1.2.3 Caffeine, adenosine and Nitric Oxide
Nitric oxide (NO) is a physiological molecular messenger which mediates several basal functions and pathological states (Bredt and Snyder, 1994). NO is the major endogenous vasodilator, being currently used NO donors in clinical practice for the treatment of severe hypertension and congestive heart failure. NO is generated from L-arginine by constitutive NO synthases (eNOS and nNOS) and
inducible NO synthase (iNOS) (Knowles and Moncada, 1994).
11
vasodilatation is impaired (Williams et al., 1996) as well as in obese man (Laakso et al., 1989). Also the co-administration of glutathione and NO in rats enhanced insulin sensitivity (Guarino and Macedo, 2006).It is well known that adenosine modulates NO release via A1, A2A and A2B receptors (Olanrewaju
and Mustafa, 2000; Ray and Marshall, 2006). Therefore, being caffeine, an adenosine antagonist, it is probably that caffeine administration alters NO synthesis and/or NO effects on insulin sensitivity. In fact, Bruce et al. (2002) showed that acute caffeine intake decreased exhaled NO. In this study the authors have measured exhaled NO during 4 hours after submit normal subjects to coffee (with an approximated caffeine content of 100mg per 200ml cup), decaffeinated coffee or decaffeinated coffee plus caffeine capsule (200mg) administration, and observe an absence of effects on exhaled NO only in decaffeinated coffee administration, meaning that caffeine reduces exhaled NO (Bruce et al. 2002). Also acute caffeine administration in rats reduces NOS expression in myocardial fibres (Corsetti et al., 2008).
1.2.4 Acute vs chronic caffeine action on insulin sensitivity
Acute and chronic caffeine consumption has different actions in insulin sensitivity. During many years one of the lifestyle modifications, among subjects with metabolic and cardiovascular diseases, was the reduction of coffee consumption, based on studies that showed that caffeine when consumed acutely impairs insulin sensitivity (Keijzers et al., 2002) and increased blood pressure (for a review see Rieksen et al.,(2009). However, recently several studies have shown a beneficial relationship between long-term coffee consumption and T2DM (Lopez-Garcia et al., 2006; Van Dam et al., 2002; Van Dam et al., 2004; Van Dam et al., 2006). Besides the discussion on the protective versus deleterious effects of coffee in T2DM, there is also controversy concerning the nature of the compound involved in it. Some authors claim that the beneficial effects of coffee are mediated by caffeine (Lopez Garcia et al., 2006, Van Dam et al., 2006, Zheng et al., 2004) while others support that coffee components, apart from caffeine, are responsible for the protection against T2DM (Noordzij et al., 2005, Greenberg et al., 2005, Wu et al., 2005).
12
and double-blind fashion and it was showed that caffeine ingestion disrupted insulin sensitivity in a dose-dependent fashion beginning at very low doses (0-1 mg/kg body weight) in both healthy men and women.Also, in T2DM and obese patients after acute caffeine administration (5mg/kg body weight) the FFA levels increased compared with placebo, however insulin and glucose levels were not significantly modified. Although the authors observed an increase in insulin and glucose levels after the oral glucose tolerance test (Robertson et al., 2004). Likewise, Lane et al (2004) have showed an increase of glucose and insulin concentrations after an oral glucose tolerance test in T2DM patients preceded by an acute caffeine administration (375mg).
13
1.3 General and specific objectives
The main objective of this work is to investigate the therapeutic dose of caffeine that restores insulin sensitivity in a prediabetes animal model, hopping to found a therapy accessible, low-cost and without side effects therapy.
The specific aims of this work are:
1. Investigate if chronic administration of caffeine restores insulin sensitivity in a prediabetes animal model;
2. Investigate the time required for the reversion of insulin resistance;
15
2. Methods
2.1 Animals and experimental procedures
The experiments were performed in Wistar rats of both genders aged 8 -12 weeks old (250-450g), obtained from the animal house of the Faculdade de Ciências Médicas of Nova Medical School. The animals were maintained at control temperature and humidity (21 ± 1°C; 55 ± 10% humidity) with a 12h cycle of light and darkness.
Two groups of rats were used: a high-sucrose (HSu) group, which is a lean model of insulin resistance and hypertension (Conde et al., 2012, Ribeiro et al., 2013, Ribeiro et al., 2005), and a control group. The HSu model was obtained by submitting the animals to 35% sucrose in drinking water during 28 days. The control group fed a standard chow (7.4% fat, 75% carbohydrate (4% sugar) and 17% protein; SDS diets RM1; Probiológica, Sintra, Portugal). Fasting glycemia, insulin sensitivity and glucose tolerance were assessed prior to submit the animals to the diets and after 28 days to confirm insulin resistance in the HSu animal model.
In order to investigate if chronic administration of caffeine restores insulin sensitivity in the HSu animal model, after 28 days caffeine was administered in drinking water to HSu and control groups. Three doses of caffeine were tested: 0.5g/L; 0.75 g/L and 1g/L. Rats without caffeine treatment were maintained in both control and HSu groups as controls. The animals were maintained under diets during 12 weeks after initiating chronic caffeine treatment. Insulin sensitivity and glucose tolerance were monitored each 2/3 weeks. Also, blood was collected from the tail vein after the oral glucose tolerance test (OGTT) in order to evaluate alterations in insulinemia and other mediators associated with insulin resistance.
Food and liquid intake in all groups of animals was monitored throughout the experimental protocol. Body weight and possible animal behavioural changes were monitored twice per week.
At the end of the experimental period and after glucose tolerance evaluation, rats were anaesthetized with pentobarbitone (60mg/Kg). Blood was collected by heart puncture and skeletal muscle and liver were collected for posterior analysis of mediators related with insulin sensitivity. Also visceral, perirenal and genital fat was weighted at the end of the experiment.
16
2.2 Insulin Tolerance Test
The insulin tolerance test (ITT) was used to measure insulin sensitivity. The ITT is one of the earliest methods developed to assess insulin sensitivity in vivo and provides an estimate of overall insulin sensitivity, correlating well with the ‘gold standard’ hyperinsulinaemic–euglycaemic clamp (Monzillo and Hamdy, 2003).
ITT was performed always in conscious animals submitted to an overnight fasting of approximately twelve hours. The test consist in the measurement of basal glycaemia, followed by the administration of an insulin bolus (0.1 U/Kg) in the tail vein and the measure of the decline in plasma glucose concentration over 15 min at 1 min intervals. The constant rate for glucose disappearance (KITT)
was calculated using the formula 0•693/t1/2. Glucose half-time (t1/2) was calculated from the slope of the least-square analysis of plasma glucose concentrations during the linear decay phase (Conde et al., 2012, Ribeiro et al., 2013). Blood samples were collected by tail tipping and glucose levels were measured with a glucometer (Abbott Diabetes Care, Portugal) and test strips (Abbott Diabetes Care, Portugal).
2.3 Oral Glucose Tolerance Test
For the OGTT the animals were submitted to an overnight fasting of approximately twelve hours. The test consisted of an oral administration of glucose (2g/kg) by gavage and the measurement of plasma glucose at 0, 15, 30, 60, 120 and 180 minutes. The blood samples were collected by tail tipping and glucose levels were measured with a glucometer (Abbott Diabetes Care, Portugal) and test strips (Abbott Diabetes Care, Portugal). Glucose excursion curves (plasma glucose vs time) were draw with the data obtained and the Area Under the Curve (AUC) was compared.
2.4 Collection of tissues
After an abdominal laparotomy, the liver and skeletal muscle were collected and cryopreserved at -80°C to posterior analysis of NO production and the expression of glucose transporters.
2.5 Glut4 Protein quantification by Western Blot
17
frozen at -80°C until further use. The protein quantification of the homogenate was determined by using the colorimetric assay Micro-BCA (Pierce, Madrid, Spain).Samples of the homogenate (50µg) and markers (Precision Plus Protein Duo Color, Biorad, Madrid, Spain) were separated by SDS-PAGE (10%) in reductive conditions.
After protein sample separation by a SDS-PAGE technique, the proteins were transferred to a polyvinylidene fluoride membrane (Merck Millipore, Darmstadt, Germany). Once the transfer was concluded the membrane was blocked with a solution of milk powder (5%) in a Tris-Buffered saline, ph 7,6 (TBS), with tween 20 (TTBS 0,1%) (BioRad, Madrid, Spain) during 1h at room temperature. The membranes were incubated overnight at 4ºC with the primary antibody Goat anti-GLUT4 (1:200) (SantaCruz Biotecnhology, Dallas, EUA) and then washed 3 times during 15 minutes with TTBS 0,1%. Next the membranes were incubated with the secondary antibody Donkey anti-Goat (1:5000)( SantaCruz Biotecnhology, Dallas, EUA) during 90 minutes at room temperature and then washed 3 times during 15 minutes with TTBS 0,1%. The intensity of the signals was detected in a ChemiDoc molecular imager (Bio-Rad Laboratories) and quantified using Quantity One software (Bio-(Bio-Rad Laboratories, Hercules, CA). The membranes were then reprobed and tested for GAPDH immunoreactivity (bands in the 37-kDa region) to compare and normalize the expression of proteins with the amount of protein loaded. Briefly, the membranes were incubated for the primary antibody mouse anti-GAPDH (1:250) (SantaCruz Biotecnhology, Dallas, EUA) overnight at 4ºC. After washed 3 times during 15 minutes the membranes with TTBS 0,1% they were incubated during 90 minutes at room temperature with the secondary anti-body goat anti-mouse (1:2000) (SantaCruz Biotecnhology, Dallas, EUA). After washing the membranes they were revealed.
2.6 Liver and skeletal muscle Nitric Oxide (NO) quantification
Skeletal muscle and liver samples (160 mg) were homogenized in 500 µl of homogenization buffer (Tris-HCL 100mM; EDTA 50mM; EGTA 50mM). Then the homogenate was centrifuged (Eppendorf, Madrid, Sapin) at 13000g, during 20 minutes at 4°C, and the supernatant was collected and stored at -80°C.
For the deproteinization of the samples, the homogenate samples were diluted 3x in absolute ethanol at 0°C and mixed in vortex. After resting during 30 minutes on ice, the samples were centrifuged at 12000g during 15 minutes at 4°C. Finally the supernatant was collected and stored at -80 until needed for NO quantification.
NO/NO3- concentration was determined by using a selective and sensitive NO/ozone
18
2.7 Drugs and chemicals
Aprotinin, caffeine, sodium cholate, EDTA, leupeptin, NaCl, sodium orthovanadate, pesptatin, PMSF, tripsin, Tris, Trito X-100 were all obtained from Sigma-Aldrich (Madrid, Spain). The insulin was commercially available as Humulin® Regular (Lilly, Portugal) in a concentration of 1000Ul/ml.
2.8 Data Analysis
19
3. Results
3.1 Effect of chronic caffeine intake in caloric intake and rats weight
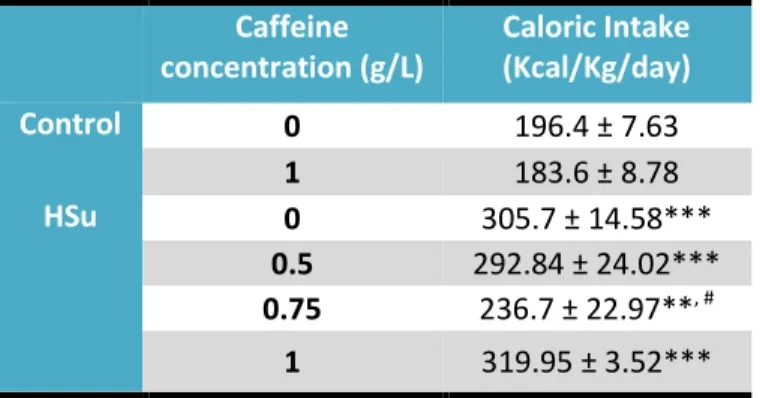
Caloric intake was monitored twice a week and the effect of diet administration and chronic caffeine intake is summarized in table 3.1. Caffeine intake in the control group was only tested in the concentration of 1g/L, and this concentration did not modify caloric intake in this group of animals (table 3.1). As expected, HSu diet increased significantly caloric intake by 35.8%. Caffeine in all concentrations tested, except for the 0.75g/l concentration, did not change caloric intake within HSu group (table 3.1).
Table 3.1 – Effect of chronic caffeine administration on caloric Intake in control and High-Sucrose (HSu) diet animals.
Caffeine
concentration (g/L)
Caloric Intake
(Kcal/Kg/day)
Control
0
196.4 ± 7.63
1
183.6 ± 8.78
HSu
0
305.7 ± 14.58***
0.5
292.84 ± 24.02***
0.75
236.7 ± 22.97**
, #1
319.95 ± 3.52***
Caloric intake was monitored twice a week. Data represent means ± SEM. ** p<0.01 in comparison with controls; *** p<0.001 in comparison with controls; # p<0.05 in comparison with High-Sucrose (HSu) diet without caffeine. (One
Way ANOVA with dunnet’s or Bonferroni multicomparison test)
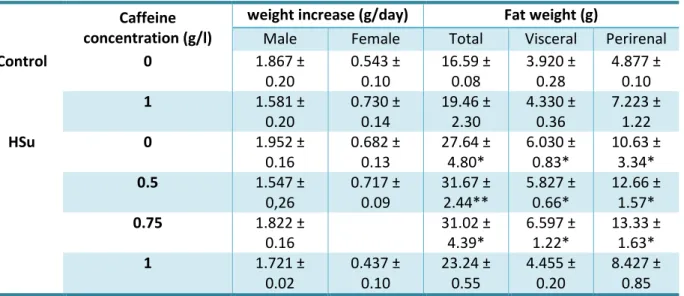
In table 3.2 is represented the effect of caffeine intake in weight increase (g/day) and fat weight (total, visceral and perirenal).
20
Table 3.2 - Effect of chronic caffeine administration on weight increase and total, visceral and perirenal fat in control and high-Sucrose (HSu) diet animals.Caffeine
concentration (g/l)
weight increase (g/day)
Fat weight (g)
Male
Female
Total
Visceral
Perirenal
Control
0
1.867 ±
0.20
0.543 ±
0.10
16.59 ±
0.08
3.920 ±
0.28
4.877 ±
0.10
1
1.581 ±
0.20
0.730 ±
0.14
19.46 ±
2.30
4.330 ±
0.36
7.223 ±
1.22
HSu
0
1.952 ±
0.16
0.682 ±
0.13
27.64 ±
4.80*
6.030 ±
0.83*
10.63 ±
3.34*
0.5
1.547 ±
0,26
0.717 ±
0.09
31.67 ±
2.44**
5.827 ±
0.66*
12.66 ±
1.57*
0.75
1.822 ±
0.16
31.02 ±
4.39*
6.597 ±
1.22*
13.33 ±
1.63*
1
1.721 ±
0.02
0.437 ±
0.10
23.24 ±
0.55
4.455 ±
0.20
8.427 ±
0.85
Body weight increased, calculated as total weight variation during the experimental period, in control and high-sucrose (HSu) animals with and without caffeine (0.5, 0.75 and 1 g/l). Total, visceral and perirenal fat, weighed postmortem and corrected to body weight in control and HSu rats with and without caffeine (0.5, 0.75 and 1 g/l). Data are present as means of 4-6 values. *p<0.05, **p<0.01, compared with control values (One-way ANOVA with Dunnett multicomparison tests)
3.2 Effect of chronic caffeine intake on fasting glycemia and insulin
sensitivity
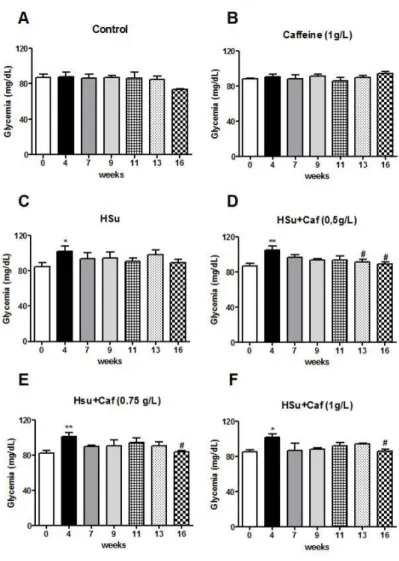
Fasting glycemia was monitored in the beginning of the ITT and in OGTT, and the effect of chronic caffeine administration is represented in figure 3.1. HSu diet induced an increase in fasting glycemia at the 4th week of diet to 102 ± 5.72 mg/dl (control = 84.88 ± 4.09 mg/dl). Also in the following
21
Figure 3.1 - Effect of chronic caffeine administration on fasting glycemia in control and high-sucrose (HSu) animals. Fasting glycemia was monitored in all insulin tolerance test (ITT) and oral glucose tolerance test (OGTT). Fasting glycemia in control (A), control with caffeine (1g/l) (B), Hsu (C), HSu with caffeine (0.5g/l) (D), HSu with caffeine (0.75g/l) (E) and HSu with caffeine (1g/l) (F) animals. Values are presented as the mean ± SEM. *p<0.05, **p<0.01, compared with control values (week 0); #p<0.05, compared with the values at the 4thweek (One-way ANOVA with Dunnett multicomparison test).
22
group, caffeine administration of 1g/l decrease insulin resistance faster than the other concentrations, being insulin sensitivity completely restored after 3 weeks of caffeine administration (Figure 3.2F).Figure 3.2 - Effect of chronic caffeine intake on insulin sensitivity determined by the insulin tolerance test and expressed as the constant rate for glucose disappearance (KITT) in control and high-sucrose (HSu) animals.
Insulin sensitivity in control (A), caffeine (1 g/l) (B), HSu (C), HSu with caffeine (0.5 g/l) (D), HSu with caffeine (0.75 g/l) (E) and HSu with caffeine (1 g/l) (F) animals. Caffeine was administrated in the drinking water during 12 weeks together with control or Hsu diet after the animals became insulin resistant (after four weeks of HSu diet). Data are present as means of 4-6 values. *p<0.05, **p<0.01, ***p<0.001, compared with control values (week 0); #p<0.05, ##p<0.01, ###p<0.001, compared with the values at the 4th week (One-way ANOVA with
23
3.3 Effect of chronic caffeine intake on glucose tolerance
The effect of caffeine intake on glucose tolerance is summarized in figure 3.3. In figure 3.3A it can be seen that caffeine administration (1g/l), after 16 weeks, does not modify glucose tolerance. On the other hand, HSu diet progressively impaired glucose tolerance over the weeks, becoming significantly different at the 16th week, in comparison with control (figure 3.3B).
24
Caffeine administration in the HSu group ameliorates glucose tolerance in comparison with the HSu group without caffeine intake (figure 3.3C). This effect of caffeine on glucose tolerance is more significant as higher is the concentration of caffeine administered, as we can see from the values of the AUC showed in the table and the glucose excursion curves presented in figure 3.3C.3.4 Effect of chronic caffeine intake on Glut4 skeletal muscle protein
expression
Glut4 transports are the main responsible for glucose uptake in skeletal muscle and therefore we have investigated if the reversion in insulin sensitivity and glucose tolerance can be associated with a recovery of Glut4 expression in this insulin-sensitive tissue. Chronic caffeine intake (1g/l) did not alter the Glut4 expression levels in skeletal muscle (figure 3.4). However, as expected, HSu diet decreased significantly Glut4 transporters expression by 59.2% (figure 3.4). Chronic caffeine intake in HSu group in a concentration of 0.5 g/l partially restored Glut4 expression, increasing its levels by 24.3%, whereas the concentration of 1g/l completely restored Glut4 expression levels (figure 3.4).
25
3.5 Effect of chronic caffeine intake on NO production in skeletal
muscle and liver
NO is known to be a key mediator in insulin sensitivity and therefore we have evaluated its content in the liver and in skeletal muscle. Figure 3.5A represents the effect of chronic caffeine administration on NO content in liver. Caffeine administration did not altered liver NO content in control group and, HSu diet as well as the combination of HSu plus caffeine in the concentrations of 0.5g/l and 1g/l did not change NO levels in the liver. Surprisingly, a chronic caffeine administration in a dose 0.75g/l in Hsu rats produced a significant increase in NO to 70.4 ± 5,7nmol/g tissue (control= 45.5 ± 1.8nmol/g tissue).
Figure 3.5 – Effect of chronic caffeine intake in nitric oxide (NO) content in the liver (A) and in skeletal muscle (B) in control and high-sucrose (HSu) animals. One-Way and Two-Way ANOVA with Dunnett and Bonferroni’s
27
4. Discussion
The present work demonstrates, for the first time, that chronic caffeine administration restores insulin sensitivity, glucose tolerance and fasting hyperglycemia in prediabetic rats (HSu). In addition, we have shown that the latency time needed to restore insulin sensitivity and glucose tolerance is inversely correlated with caffeine concentration. Caloric intake, as well as weight increase per day and total fat mass, both in controls and in the prediabetes model, was not affected by caffeine consumption. Also, caffeine intake did not alter skeletal muscle Glut4 expression levels in control animals, but restored its levels in the HSu group when administered at concentration of 1g/l. Finally, we have shown that skeletal muscle NO levels were decreased in HSu animals and that caffeine did not modify these levels. All together, these results suggest that caffeine reversion of insulin resistance and glucose intolerance did not involve alterations in appetite, weight loss or in NO levels but can be due to a restore of insulin signaling pathways in insulin sensitive tissues, like skeletal muscle, and point forward to the use of caffeine for the treatment of prediabetes and prevention of T2DM.
At the onset of the discussion we want to state that the reasons that lead to the use of these concentrations of caffeine is the correspondence to the human coffee consumption. Caffeine concentration of 1g/l corresponds to a caffeine dose of 3/4 coffees per day, 0.75 g/L to 2/3 coffees per day and 0.5 g/L to 1/2 coffees per day (Fredholm et al., 1999). Also, it should be noted that in these doses the only mechanism significantly affected by caffeine is the antagonism of adenosine receptors (Fredholm et al., 1999).
HSu diet increase fasting glycemia and decrease insulin sensitivity after 4 weeks (28 days) of diet which remains throughout the 16 weeks in control animals. This increase in fasting glycemia and the decrease in insulin resistance are consistent with the previous studies from our laboratory indicating reproducibility in the animal models (Conde et al., 2012; Ribeiro et al., 2013), although these parameters were only analyzed up to four weeks in those studies. Also, the results obtained in our laboratory are in agreement with the findings obtained by others in animals and in humans. In a study taken by Ribeiro et al., 2005 it was seen that liquid HSu diet (35%) intake during 6 weeks also decrease insulin sensitivity in Wistar and Sprague-Dawley rats. In humans it was shown that diets rich in sugar (glucose/fructose) decrease insulin sensitivity approximately in 25% (Beck-Nielsen et al., 1980). In the present study, the increase in glycemia was only significant at the 4th week of HSu diet, and insulin resistance tends to
28
administration in control animals did not alter fasting glycemia or insulin sensitivity, although when applied to HSu animals it restored completely fasting glycemia, being the effect significant for all the concentrations of caffeine tested at 12 weeks of diet. The beneficial/prejudicial effects of chronic coffee intake in the risk of T2DM in human were already commented. Recently a study performed in Sprague-Dawley rats showed that coffee administration during 12 weeks improves insulin sensitivity and glucose tolerance in 30% liquid HSu fed rats (Morakinyo et al., 2013). On the other hand it was showed that decaffeinated coffee had beneficial effects on all body insulin sensitivity than decaffeinated plus alkaloid caffeine (20g/l) in high-fat fed Sprague-Dawley rats, indicating that caffeine antagonizes decaffeinated coffee action (Shearer et al., 2007). However, these studies evaluated caffeinated/ decaffeinated coffee intake, and being coffee a mixed of many compounds, direct effect of caffeine was not evaluated. In the present study we have tested the direct effect of caffeine and our results are in concordance with recent studies where it was showed that chronic caffeine intake (caffeine 0.5 g/kg of food) during 8 weeks restores and ameliorates metabolic syndrome in diet-induced obese Wistar rats (Panchal et al., 2012) and that chronic caffeine intake (15mg/kg/day) during 4 weeks improved insulin sensitivity in Wistar-Kyoto rats (Yeh et al., 2014). In the present work, chronic caffeine consumption restored completely insulin sensitivity in a concentration dependent-manner, being the latency time necessary to restore this parameter inversely correlated with caffeine dose, suggesting that a low caffeine dose requires more time to induce substantial changes in order to recover the mechanisms. Recently, it was seen that acute caffeine ingestion impaired insulin sensitivity in a dose-dependent manner in humans (Beaudoin et al., 2013). This caffeine induced-insulin resistance in humans is in agreement with the findings of our laboratory in rats, in where we have found that caffeine decreases in a dose-dependent manner insulin sensitivity (Sacramento et al., 2014). The dose-dependent effect of chronic caffeine on insulin sensitivity herein described as well as the described for acute consumption (Beaudoin et al., 2013; Sacramento et al., 2014) suggest an effect mediated by adenosine receptors. In fact, Sacramento et al. (2014) have shown that insulin resistance induced by acute caffeine is mediated by A1 and A2B adenosine receptors.29
In the present study chronic caffeine intake in control animals did not alter glucose tolerance. Similar results were also observed by Úrzua et al., (2012) and by Morakinyo et al., (2013), since theydidn’t saw any effect of chronic coffee consumption on glucose tolerance in healthy rats. Also, Morakinyo et al., (2013) shown that coffee administration to HSu rats improved glucose tolerance in these animals. Although, these authors have tested coffee and no caffeine as in the present study. In fact, herein we have observed a complete restore of glucose tolerance with the highest concentration of caffeine tested (1g/l). In a study taken by Ohnaka et al., 2012 chronic caffeinated/decaffeinated coffee intake (5 cups/day), which corresponds to a caffeine dose similar to 1g/l, was tested in glucose metabolism during 16 weeks in overweight, middle-aged men with a mild-to-moderate elevation of fasting glucose. The authors have shown that glucose tolerance, assess through an OGTT, was not altered by caffeinated coffee at 8 weeks, yet after 16 weeks the 2-hour glucose and AUC glucose during OGTT were decreased (Ohnaka et al., 2012). Also, in the same study the authors did not observe differences in fasting plasma glycemia with caffeinated chronic intake both in 8th and 16th week (Ohnaka et al., 2012). In another previous study Wedick et al. (2011) demonstrated that chronic coffee intake (5 cups/day) during 8 weeks was also unable to alter glucose tolerance, glycemia and insulin sensitivity in overweight men and women. All together, these results suggest that for the amount of caffeine/coffee administered (1g/l, 4 to 5 cups of coffee per day) is necessary a longer-term intake (at least 12 weeks as in the present study) to see the caffeine beneficial effects on glucose tolerance.
30
g/l tested in HSu animals, suggesting that is not the reduction in food intake that contribute to the beneficial effects of chronic caffeine intake in glucose homeostasis. At the moment we do not have a consistent explanation for the reduction of food intake observed for the dose of 0.75g/l, although since the number of animals tested in this group was lower (n = 3) than in the other groups (n = 6) we should increase the number of animals to verify this results before trying to achieve a plausible explanation.The HSu model is described as being a lean model of insulin resistance (Conde et al., 2012, Ribeiro et al., 2005, Morakinyo et al., 2013) therefore, and as expected, although caloric intake was increased in the HSu animals, the weight gain per day was not affected. Although after 16 weeks under HSu diet we have observed an increase in total, visceral and perirenal fat in HSu animals. In a study previously published by our group, it was found that HSu diet did not alter weight gain (g/day) yet, however no alterations were found in the percentage of visceral fat (Conde et al., 2012). This absence of effect on visceral fat can be due to the fact that the HSu model tested in that study was submitted to 4 weeks of diet and not for 16 weeks as in the present one. Chronic caffeine intake did not alter weight gain and adipose tissue mass both in controls and HSu group, with the exception of 1g/l concentration that slightly decrease total fat, visceral and perirenal fat in HSu group, although these decreases were not statistical significant in relation to HSu group without caffeine. The absence of effects of caffeine on weight gain and in the adipose tissue mass in controls and HSu rats are in accordance with the previous results of our group (Conde et al., 2012) and by others (Morakinyo et al., 2013; Urzúa et al., 2012) and suggest that is not the reduction on adipose mass or weight gain that is on the basis of caffeine effects on insulin sensitivity and glucose. Although it seems that at high doses of caffeine, the reduction of adipose tissue mass can be one of the mechanisms contributing to insulin sensitivity and glucose tolerance. In fact, recently it was seen that in vitro chronic caffeine decreases the expression of adipogenesis-related genes in a dose-dependent manner, inhibiting adipogenic differentiation in cell lines of rat adipose-derived stem cells (ADSCs) and a mouse bone marrow stromal cell line (M2-10B4) (Su et al., 2013). Also Aoyagi et al., (2014) showed that coffee decreased lipid accumulation in the adipose differentiation of mouse line cells (3T3-L1) in a dose-dependent manner and that reduction was correlated with a decrease in adipocyte marker genes. However, they do not show which coffee compounds are responsible for decreasing lipid accumulation. Therefore, we can suggest that one of the mechanisms of caffeine to restore insulin sensitivity and glucose tolerance can be the reduction of visceral fat by inhibiting adipocyte differentiation and that this happened at higher concentrations of caffeine.
31
reduced body weight through thermogenesis and fat oxidation. However the animal model is different from the used in the present study, meaning that caffeine can act through different mechanism of action. Although we haven’t assess thermogenesis in the present study, we did not observe any caffeine-induced weight loss. Therefore we can exclude a thermogenic effect of caffeine as the responsible for the restore of insulin sensitivity and glucose tolerance.Herein we have shown that animals submitted during 16 weeks of HSu diet present a decreased Glut4 expression in skeletal muscle, suggesting that an impairment of insulin signaling pathways in this organ contributes to insulin resistance. These results are in agreement with the previous findings of our lab, where animals submitted to 4 weeks of HSu diet exhibit a decrease in 58% in Glut4 expression (Guarino et al., 2014). Also, Kim et al., (1999) have showed that glucose uptake in skeletal muscle is diminished in rats fed with HSu diet, and so the impaired Glut4 expression seen by us in the present study and in our previous findings (Guarino et al., 2014) could explain the impaired glucose uptake. Chronic caffeine intake did not alter Glut 4 levels in control animals but increased in a concentration-dependent manner Glut4 expression in the skeletal muscle of HSu animals, suggesting that this is an important mechanism that contributes to insulin sensitivity and explain the return of glycemia to control levels. The effect of chronic caffeine intake on Glut4 expression described in the present thesis is in agreement with the partial reversal of the Glut4 expression induced by caffeine in the skeletal muscle of aged rats (Guarino et al., 2013). Although, the reversion of Glut4 expression in HSu animals showed herein contrasts to what we have found in the study taken by Guarino et al. (2014) where chronic caffeine intake (1g/l) did not altered Glut4 expression in HSu group. Nevertheless, in this study caffeine was administered only for 15 days with the aim of evaluating if caffeine can prevent the development of diet-induced insulin resistance (Guarino et al., 2014). All together these results suggest that is necessary more time of caffeine administration to see its effects on Glut4 expression levels. Egawa et al., (2009, 2011a) have shown that acute caffeine did not alter Glut4 levels in skeletal muscle but impairs insulin signal transduction by inhibiting IRS-1 tyrosine phosphorylation and PI3K phosphorylation (Egawa et al. 2011b). However these studies evaluated acute caffeine effects and were performed with caffeine concentrations in the milimolar range that will affect other molecular targets than adenosine receptors (Fredholm et al. 1999), which may explain the difference compared to our results.
Herein, we have showed that NO levels in liver are not affected by HSu diet and by chronic caffeine administration. However, in the HSu group treated with 0.75g/l of caffeine it was observed an unexpected increase in NO concentration levels. At this moment we do not have any plausible explanation for this effect, however and at it was mentioned earlier in this discussion the HSu group treated with 0.75g/l possess a low number of animals (n = 3) than the others (n = 6), and this can affect the results.
32
in skeletal muscle, in high-fat-sucrose rats (Bourgoin et al., 2008) and in hypertensive HSu feeding rats (Mélançon et al., 2006). Santuré et al. (2002) also showed that insulin-mediated skeletal muscle vasodilation, that is NO-dependent, was impaired in sucrose-fed rats. Also, the same authors have described a reduction in eNOS protein content in muscle, which could be responsible for this impairment (Santúre et al., 2002). In the present study, chronic caffeine administration did not change skeletal muscle NO levels either in controls or in HSu animals, meaning that caffeine action on insulin sensitivity is not mediated by NO.The insulin-sensitizing effect of chronic caffeine treatment may also be directly related to antagonism of adenosine receptors on insulin target tissues. The effect of adenosine on glucose homeostasis is currently a hot-topic area with controversial results: while positive effects of A1 receptor
partial agonists are well documented on adipose tissue glucose uptake (Dhala et al., 2009), studies using adenosine receptor antagonists have shown increases (Espinal et al., 1983), decreases (Han et al., 1998) and no effect (Vergauwen et al., 1994) of these drugs on skeletal muscle glucose uptake. More recently, Faulhaber-Walter et al. (2011) have demonstrated that A1 receptor deficient mice have decreased glucose
tolerance with pronounced IR, which suggests that these receptors contribute significantly to glucose homeostasis and insulin sensitivity. Also, A2B receptor antagonists have been used to increase plasma
insulin levels in vivo (Rusing et al., 2006) and more recently to reduce insulin resistance (Figler et al., 2011). More recently, a study from our lab tried to solve some of the controversy and Sacramento el al. (2014), as referred earlier in the discussion, showed that acute caffeine induces whole body-insulin resistance an effect that was mediated by A1 and A2B adenosine receptors, meaning that adenosine is an
insulin-sensitizer substance. Also, it was shown in the same study that activation of A1 adenosine
receptors by an A1 agonist increases glucose uptake skeletal muscle in a magnitude similar to the
obtained with insulin, were A2B agonist did not produced any effect on glucose uptake. Therefore, since