Sofia Vargas Nobre de Gusmão
Licenciada em Bioquímica
Cerebral Vasculopathy in Children
with Sickle Cell Disease
A study of genetic modulators of the disease
September 2015
Dissertação para obtenção do Grau de Mestre em Genética Molecular e Biomedicina
Orientadora: Dra. Paula Kjöllerström, Médica Pediatra,
Hospital de D. Estefânia
Co-orientadora: Doutora Paula Faustino, Investigadora Auxiliar,
I
Cerebral Vasculopathy in Children with Sickle Cell Disease
A study of genetic modulators of the disease
Copyright Sofia Vargas, FCT/UNL, UNL
A Faculdade de Ciências e Tecnologia e a Universidade Nova de Lisboa têm o direito, perpétuo e sem limites
geográficos, de arquivar e publicar esta dissertação através de exemplares impressos reproduzidos em papel ou
de forma digital, ou por qualquer outro meio conhecido ou que venha a ser inventado, e de a divulgar através de
repositórios científicos e de admitir a sua cópia e distribuição com objetivos educacionais ou de investigação,
III
A
CKNOWLEDGMENTS
Beforehand this Project would not have been possible without appropriate authorizations from Dr. Fernando de Almeida and Eng. José Albuquerque, of the Directive Board of Instituto Nacional de Saúde Dr. Ricardo Jorge (INSA), and Dr. Glória Isidro, Coordinator of the Human Genetics Department of INSA, for which I am extremely grateful.
To Dr. Paula Kjöllerström and Dr. Raquel Maia, medical doctors at Hospital de D. Estefânia, who conceived the idea, and to Dr. Rita Sobral for helping in the inclusion criteria of children, a very warm thank you. This project would not exist without you.
A special note of acknowledgement to Doctor Paula Faustino, who brought what as an idea into actual work, who made herself and her laboratory available for such work to be developed and, above all, who believed in me to carry the project. For your constant availability, for crediting my own ideas and work, while never ceasing to guide me, thank you.
I thank Doctor João Lavinha and Doctor Susana David for their availability to answer my questions and contribute with relevant insights that helped me to understand several concepts and to further develop my study. I thank Dr. Anabela Morais, of Hospital de Santa Maria, and Dr. Tiago Milheiro Silva, intern in Hospital de D. Estefânia, for their amazing help in consulting patient’s medical records.
I thank Andreia Coelho for the previous work done in the lab, which was essential to the present project.
To everyone in the Unidade de Tecnologia e Inovação (UTI) of INSA a very special thank you. Your help was invaluable both in expediting and processing all the samples that needed to be analyzed but also for all the help in understanding the methodologies used. You all made me feel very welcome and the good spirits of the team always brightened my day.
Lastly, I must thank my closest friends and family – you know who you are. I would not have done this work without our amazing support, patience and encouragement. Whenever I was stressed, my family pushed me on. As always. My friends kindly read parts of this dissertation and gave me pertinent opinions and suggestions on how to improve or where to adjust, always with honesty and straightforwardness.
Thank you all so much.
V
R
ESUMO
A anemia de células falciformes (ACF) é uma doença genética de transmissão autossómica recessiva, causada pela mutação HBB:c.20A>T. Origina a hemoglobina S que forma polímeros no interior do eritrócito, aquando da desoxigenação, deformando-o e causando hemólise precoce. As manifestações clínicas da ACF são heterogéneas, sendo que uma das mais graves, o AVC isquémico, ocorre em 11% dos doentes até aos 20 anos.
Neste trabalho, foram estudadas 66 crianças com ACF, agrupadas quanto ao grau de vasculopatia cerebral (AVC, Risco e Controlo) numa tentativa de identificar modificadores genéticos do risco e ocorrência de AVC. Foram feitos estudos de associação entre os três grupos fenotípicos e parâmetros hematológicos e bioquímicos dos doentes, bem como 23 regiões polimórficas em genes relacionados com aderência celular (VCAM-1, THBS-1, CD36), tónus vascular (
NOS3
, ET-1) e inflamação (TNF-α,HMOX). Os referidos parâmetros dos doentes foram recolhidos dos seus registos hospitalares. Os moduladores genéticos conhecidos da ACF (haplotipo no agrupamento da beta-globina, genótipo em
HBA e BCL11A) e as variantes genéticas putativamente modificadoras da vasculopatia cerebral foram caracterizados e avaliados quanto a diferenças nas distribuições entre os referidos grupos.
O alelo C do rs1409419 em VCAM-1 e o alelo C do rs2070744 em NOS3 foram observados em associação com o AVC, enquanto o alelo T do rs1409419 foi associado a proteção. Os alelos 4a e 4b do VNTR de 27 bp em NOS3 parecem estar associados, respetivamente, a risco e a proteção do AVC. Os STRs mais longos no promotor de HMOX-1 parecem predispor para AVC. Verificaram-se níveis mais elevados de hemoglobina fetal no grupo Controlo, como resultado da presença do haplotipo Senegal ou do alelo T de rs11886868 em BCL11A, e níveis mais elevados de lactato desidrogenase, marcador de hemólise, no grupo de Risco. São discutidos os mecanismos moleculares subjacentes à função modificadora das variantes relevantes.
Palavras-chave: anemia de células falciformes, hemólise, AVC, vasculopatia cerebral, modificadores
VII
A
BSTRACT
Sickle cell disease (SCD) is a genetic disorder with recessive transmission, caused by the mutation HBB:c.20A>T. It originates hemoglobin S that forms polymers inside the erythrocyte, upon deoxygenation, deforming it and ultimately leading to premature hemolysis. The disease presents with high heterogeneity of clinical manifestations, the most devastating of which, ischemic stroke, occurs in 11% of patients until 20 years of age.
In this study, we tried to identify genetic modifiers of risk and episodes of stroke by studying 66 children with SCD, grouped according to the degree of cerebral vasculopathy (Stroke, Risk and Control). Association studies were performed between the three phenotypic groups and hematological and biochemical parameters of patients, as well as with 23 polymorphic regions in genes related to vascular cell adhesion (VCAM-1, THBS-1 and CD36), vascular tonus (NOS3 and ET-1) and inflammation (TNF-α and HMOX-1). Relevant data was collected from patient’s medical records.
Known genetic modulators of SCD (beta-globin cluster haplotype and HBA and BCL11A genotypes) and putative genetic modifiers of cerebral vasculopathy were characterized. Differences in their distribution among groups were assessed.
VCAM-1 rs1409419 allele C and NOS3 rs207044 allele C were associated to stroke events, while
VCAM-1 rs1409419 allele T was found to be protective. Alleles 4a and 4b of NOS3 27 bp VNTR appeared to be respectively associated to stroke risk and protection. HMOX-1 longer STRs seemed to predispose to stroke. Higher hemoglobin F levels were found in Control group, as a result of Senegal haplotype or of BCL11A rs11886868 allele T, and higher lactate dehydrogenase levels, marker of hemolysis, were found in Risk group. Molecular mechanisms underlying the modifier functions of the relevant genetic variants are discussed.
IX
C
ONTENTS
CHAPTER I……….………..……….………..1
I. Introduction ... 3
I.1. Human Hemoglobin ... 3
I.2. Sickle Cell Disease ... 6
1.2.1. Genetic basis and Pathophysiology of Sickle Cell Disease ... 6
1.2.2. Disease transmission and presentation ... 7
1.2.3. Genetic origins and prevalence of the sickle cell hemoglobin gene ... 8
1.2.4. Clinical manifestations ... 9
I.3. Cerebral Vasculopathy in Sickle Cell Disease ... 12
I.3.1. Silent Cerebral Infarcts and Overt Strokes ... 12
I.3.2. Incidence ... 13
I.3.3. Risk Factors and Predictors ... 14
I.3.4. Pathophysiology of Ischemic Stroke ... 14
I.3.5. Diagnosis of vasculopathy in SCD patients... 16
I.4. Disease Management ... 18
I.5. Genetic Modifiers ... 20
I.5.1. Genetic modulation of overall SCD severity ... 20
I.5.2. Putative Genetic modulators of Ischemic Stroke in SCD……….…………...22
Objectives………...…………..25
CHAPTER II ……….…………..……….………...………..27
II. Methods and Materials ... 29
II.1. Sample ... 29
II.1.1. Population sample ... 29
II.1.2 Biological samples ... 29
II.2. Methods ... 29
II.2.1. Genomic DNA amplification through PCR ... 30
II.2.2. Restriction fragment length polymorphism ... 31
II.2.3. Automated Sanger Sequencing ... 311 II.2.4. Fluorescent Fragment Length Analysis ... 32
X
II.2.6. Statistical Analysis ... 32
CHAPTER III……….…….……….………...………..35
III. Results and Discussion. ... 37
Part 1: Genetic Characterization ………...37
III.1.1. Confirmation of the presence of HbS mutation in homozygous state ... 37
III.1.2. β-globin cluster haplotype determination ... 38
III.1.3. Diagnosis of α-thalassemia (-α3.7 kb del) ... 41
III.1.4. Analysis of putative genetic modulators ... 42
III.1.4.1. BCL11A ... 42
III.1.4.2. VCAM-1 ... 43
III.4.3. THBS-1 ... 45
III.1.4.4. CD36 ... 47
III.1.4.5. NOS3 ... 48
III.1.4.6. ET-1 ... 50
III.1.4.7. TNF-α ... 52
III.1.4.8. HMOX-1 ... 53
Part 2: Association Studies ………...55
III.2.1. VCAM-1, SNP rs1409419 modulates stroke risk ... 55
III.2.2. NOS3 polymorphisms are associated with stroke risk and events ... 57
III.2.3. Long HMOX-1 promoter repeats may predispose to stroke events ... 62
III.2.4. Other putative disease modulator genes were not associated to stroke risk or protection ... 63
Part 3: Biochemical Characterization ………...65
III.3.1. “HbSF” phenotype is responsible for the low %HbS in this population ... 65
III.3.2. High HbF levels result from Senegal haplotype and BCL11A ... 66
III.3.3. Lower HbF levels are associated with stroke episodes ... 67
III.3.4. Severity of anemia was equivalent in all groups ... 68
III.3.5. Level of hemolysis is associated with cerebrovascular disease... 68
III.3.6. Pro-inflammatory and pro-coagulant states may contribute to stroke events ... 70
Concluding Remarks……….………..………72
Future Perspectives………...………..74
XI
F
IGURES
CHAPTER I - INTRODUCTION
Figure I.1.: A – Hemoglobin molecule. B – Globin chain. ... 3
Figure I.2.: Schematic representation of chromosomal localization and genomic organization of the human globin genes. ... 4
Figure I.3.: Development of erythropoiesis during embryonic, fetal and adult phases. ... 5
Figure I.4.: Sickle cell disease. A – Pathophysiology of SCD. B – Peripheral blood smear. ... 7
Figure I.5.: Common haplotypes associated with the βS-globin gene. ... 8
Figure I.6.: Model of overlapping subphenotypes of SCD. ... 10
Figure I.7.: Decreased NO bioavailability in SCD. ... 12
Figure I.8.: Rates of infarctive and hemorrhagic stroke in SCA patients by age. ... 13
Figure I.9.: Representation of the Circle of Willis in situ. ... 15
Figure I.10.: Pathophysiology of stroke in SCD. ... 16
CHAPTER III – RESULTS AND DISCUSSION Figure III.1.: Diagnosis of sickle cell mutation by PCR-RFLP... 37
Figure III.2.: Electrophoresis of products of enzymatic restriction for β-globin cluster haplotype determination. ... 39
Figure III.3.: Gap-PCR analysis for diagnosis of -α3.7 kb del (α-thalassemia). A – Schematic representation of the breakpoints in genes α2 and α1 and the resulting hybrid gene. B – Electrophoresis in agarose gel showing the three possible genotypes associated to α-thalassemia ... 41
Figure III.4.: Electrophoresis of the products of enzymatic restriction with MboII for characterization of the SNP rs11886868 of BCL11A. ... 43
Figure III.5.: Automated sequencing output of a fragment of the promoter of VCAM-1. ... 44
Figure III.6.: Electrophoresis of products of enzymatic restriction with FauI for characterization of rs2292305 of THBS-1. ... 46
Figure III.7.: Allelic frequencies for SNP rs2292305 of THBS-1 for overall population and African, American and European subpopulations. ... 46
Figure III.8.: Automated sequencing output of a fragment of CD36 for analysis of SNP rs1984112... 47
Figure III.9.: Electrophoresis of DNA products for characterization of the polymorphisms of NOS3. A – SNP rs2070744. B – SNP rs1799983. C – VNTR 27 bp. ... 48
Figure III.10.: Electrophoresis of products of enzymatic restriction with CaC8I for diagnosis of the SNP rs5370 of ET-1.. ... 51
Figure III.11.: Sequencing output for SNP rs1800997 of ET-1... 51
Figure III.12.: ARMS-PCR for characterization of the SNP rs1800629 of TNF-α, for samples 056-058. ... 52
Figure III.13.: ARMS-PCR for chaacterization of rs2071746 of HMOX-1, for the identified samples. ... 53
Figure III.14.: GeneScanTM output for characterization of rs3074372 of HMOX-1. ... 54
XII
Figure III.16.: Distributions of %HbS in the total population of study and the “High HbF” and “Low HbF”
groups.. ... 65
Figure III.17.: Distributions of LDH values in the 3 phenotype groups... 69
Figure III.18.: Distribution of reticulocyte counts in the 3 phenotype groups. ... 70
Figure III.19.: A - Distributions of leukocyte counts in the 3 phenotype groups. B - Distribution of platelet
XIII
T
ABLES
CHAPTER I - INTRODUCTION
Table I.1.: Hematologic parameters characterizing different sickle cell disease genotypes. ... 8
Table I.2.: Stroke risk in children with SCA. ... 17
CHAPTER II – METHODS AND MATERIALS Table II.1. Molecular methodologies applied according to the genetic variant under study ... 30
CHAPTER III – RESULTS AND DISCUSSION Table III.1.: Determination of the three main African β-globin cluster haplotypes based on RFLP profile of specific SNPs. ... 38
Table III.2.: SNP profile for β-globin cluster haplotype of the 22 new samples. ... 39
Table III.3.: Comparison between haplotype distributions obtained in the current study and reported by Lavinha et al., 1992. ... 39
Table III.4.:Haplotypes for SNPs in the promoter of VCAM-1 generated by PHASE software. ... 45
Table III.5.: Haplotypes for SNPs in the promoter of NOS3 generated by PHASE software. ... 50
Table III.6.: VCAM-1 SNP rs1409419 significantly associated with phenotypic groups. ... 55
Table III.7.: VCAM-1 haplotypes significantly associated with phenotypic groups ... 56
Table III.8.: NOS3 individual polymorphisms significantly associated with phenotypic groups. ... 58
Table III.9.: NOS3 haplotypes significantly associated with phenotypic groups. ... 60
Table III.10.: HMOX-1 STR rs3074372 significantly associated with phenotypic groups. ... 62
Table III.11.: Association between levels of HbF and the presence of Senegal haplotype or C allele for rs11886868 of BCL11A. ... 66
XV
A
BBREVIATIONS
ACS – Acute chest syndrome
BMT – Bone marrow transplantation
bp – base pairs
CAM – Cell adhesion molecule
CBT – Chronic blood transfusion (therapy)
CD36 – Cluster of differentiation 36
CO – Carbon monoxide
CVA – Cerebrovascular accident
CVD – Cardiovascular disease
ddNTP- dideoxyribonucleotide
dNTP - deoxyribonucleotide
ECM – Extracellular matrix
eNOS – Endothelial nitric oxide synthase
ET – Endothelin
EtBr – Ethidium bromide
Hb – Hemoglobin
HbA – Adult hemoglobin
HbC – C variant hemoglobin
HbF – Fetal hemoglobin
HbS – Sickle hemoglobin
HED – Hemolysis-endothelial dysfunction
(subphenotype)
HO – Heme oxygenase
HPFH – Hereditary persistence of fetal hemoglobin
HPLC – High performance liquid chromatography
HS – Hypersensitive site
HU – Hydroxyurea
ICA – Internal carotid artery
IVS – Intervening sequence
LCR – Locus control region
LDH – Lactate dehydrogenase
MCA – Middle cerebral artery
MCS – Multispecies conserved sequence
MCV – Mean corpuscular volume
MRA – Magnetic resonance angiography
MRE – Major regulatory element
MRI – Magnetic resonance imaging
NO – Nitric oxide
NOS – Nitric oxide synthase
O2 – Oxygen
RBC – Red blood cell
SCA – Sickle Cell Anemia
SCD – Sickle Cell Disease
SCI – Silent cerebral infarct
SIT – Silent Infarct Transfusion (Trial)
STR – Short tandem repeat
TAMMV –Time-averaged mean of maximum
velocity
TCD – Transcranial Doppler (ultrasonography)
Td – Delay time
THBS – Thrombospondin
TIA – Transient ischemic attack
TNF – Tumor necrosis factor
TSP – Thrombospondin
Tt – Transit time
UTR – Untranslated region
UV – Ultra-violet (light)
VCAM – Vascular cell adhesion molecule
VVO – Viscosity-vaso-occlusion (subphenotype)
VNTR – Variable number tandem repeat
1
C
HAPTER
I
3
I.
I
NTRODUCTIONI.1.
Human Hemoglobin
Hemoglobin (Hb) is the oxygen-transporting protein in erythrocytes of vertebrates. It is composed of four subunits, each comprising one prosthetic group (heme) and one polypeptide chain (globin). Heme is an iron-containing pigment that combines with molecular oxygen (O2), allowing hemoglobin
to transport it (Nussbaum, et al., 2007). Globin chains are either α-like or β-like proteins, and hemoglobin has two of each globin chains, being therefore described as a tetramer or as a dimer of αβ promoters (Nelson & Cox, 2005). The tertiary structure of all globin polypeptides is extremely conserved throughout species, with seven or eight helical regions (A to H – see Figure I.1.).
Figure I.1.: A – Hemoglobin molecule. Hemoglobin is a tetramer composed of two identical α-like chains and two identical β-like chains. Each chain possesses one polypeptide and one prosthetic group, heme (highlighted in red). B – Globin chain. Each globin chain contains eight helical regions, named from A to H. The tertiary structure of the globin chains is highly conserved. However, only two amino acid residues have been conserved (His92, which covalently binds iron of heme, and Phe42 that correctly allocates the porphyrin ring of heme group in its pocket of the folded protein). Adapted from PDB.Nussbaum, et al., 2007
Human genes coding for globin chains group in two clusters: α-like chain genes (ξ, α2 and α1) in
chromosome 16 and β-like chain genes (ε, Gγ, Aγ, δ and β) in chromosome 11 (Nussbaum, et al., 2007). In both clusters (Figure I.2.), genes are arranged in the same transcriptional orientation and in the same order in which they will be expressed throughout development (Nussbaum, et al., 2007).
In healthy individuals, the synthesis of α- and β-globin chains is finely balanced during terminal erythroid differentiation (Higgs, et al., 2005) so that, although each copy of chromosome 16 possesses two identical α genes and each copy of chromosome 11 only contains one β gene, there is always equimolar production of the α-like and β-like globin chains (Nussbaum, et al., 2007). Coordinated expression of the genes in each cluster at all stages of development is dependent on critical regulatory elements located upstream from the genes.
4
Higgs & Gibbons, 2010). Three of these elements, MCS-R1 to -R3 lie within introns of NPR3L
(previously C16orf15), a housekeeping gene transcribed opposite to the direction of the transcription of α-globin genes (Razin, et al., 2012). MCS-R2 consists of one major DNase I hypersentitive site, located ~40 kb upstream from the ζ-globin gene (Chen, et al., 1997), and is therefore also designated HS-40 or α-MRE (for Major Regulatory Element), since it is the only regulatory element that has been shown to be essential in chicken for expression of the downstream α-globin genes. HS-40 is a powerful erythroid-specific enhancer, with a core of ~350 bp that contains several binding sites for erythroid-specific transcription factors (Razin, et al., 2012).
Figure I.2.: Schematic representation of chromosomal localization and genomic organization of the human globin genes. The α-like globin cluster (top) is situated near the telomeric region of the short arm of chromosome 16 and includes the ζ-, α2-, and α1-globin genes, which are under the control of mainly one upstream remote regulatory region, MCS-R2 or HS-40 (a DNAse I–hypersensitive site located approximately 40 kb upstream of the 5′ end of the ζ-globin gene), as well as two pseudogenes (Ψα) and the θ-gene, with unknown function. The β-like globin cluster (bottom) is interstitial and located in the short arm of chromosome 11; expression of the genes in this cluster (ε-, Gγ
-, Aγ-, δ- and β-globin genes) is under the control of a group of remote regulatory elements/DNAse I–hypersensitive sites collectively known as the locus control region (LCR). This cluster also contains one pseudogene, Ψβ. For every gene, as evidenced for genes α1 (top) and β (bottom), black boxes represent the three coding regions, white boxes represent the two intervening sequences (IVS-1 and IVS-2), and hatched boxes are the 5' and 3' untranslated regions, as depicted. The numbers below the area of coding sequences represent the number of the amino acid residue coded by this particular sequence. Adapted from Antonarakis et al., 1985; Higgs et al., 2005; andCao & Galanello, 2010.
5
Hemoglobin shows heterogeneity throughout the different human developmental stages (Weatheral & Clegg, 1976). There are six “normal” human hemoglobins: Hb Gower 1 (ζ2ε2), Hb Gower 2 (α2ε2)
and Hb Portland (ζ2 γ2) are present at the embryonic stage; HbF (α2γ2) is the main hemoglobin during
fetal development and counts for about 70% of total hemoglobin at birth, when it starts to decline until approximately 1% during adult life; HbA (α2β2) and HbA2(α2δ2) are the two hemoglobins of the adult,
with HbA comprising about 97% of the total hemoglobin during adult life (Nussbaum et al., 2007; Weatheral & Clegg, 1976).
As previously mentioned, human globin genes are arranged in clusters in the same order of their expression during development. This change in expression is sometimes referred to as globin switching (Nussbaum, et al., 2007). In the early embryo, ε-globin synthesis is the first to occur, followed shortly after by α-globin synthesis. These α-chains combine first with ε-chains to form Hb Gower 2, and later with γ -chains to form Hb F (Weatheral & Clegg, 1976). β-globin synthesis begins by 8 weeks but it only becomes significant near pregnancy term, around 36 weeks (Figure I.3.). By birth, synthesis of γ –chains is slightly higher than synthesis of β-chains, but this is rapidly reversed. The beginning of δ-chains production is uncertain, but there are traces of these globin chains in cord blood and their adult levels are reached by the end of the first year of life (Weatheral & Clegg, 1976).
Figure I.3.: Development of erythropoiesis during embryonic, fetal and adult phases. The globin switching is accompanied by changes in the major erythropoietic site. By 3 months of age, almost all the hemoglobin present is of the adult type, Hb A. (see text for details) Adapted from Nussbaum, et al., 2007.
DNA-6
binding proteins, interacts with the genes of the locus to form an active chromatin hub (a nuclear compartment), that directly associates with the different genes in the cluster, in a sequential manner, from the 5’ ε-gene in embryos, to the 3’ δ- and β-globin genes in adults (Nussbaum, et al., 2007). The ζ- to α-globin gene switch is controlled predominantly at the transcriptional level, although post-transcriptional mechanisms are also involved (Stamatoyannopoulos, 2005).
The temporal switches of globin synthesis are accompanied by changes in the major site of erythropoiesis (Figure I.3.): embryonic globin synthesis occurs in the yolk sac, from weeks 3 to 8; around the 5th week of gestation, globin synthesis occurs primarily in the fetal liver; and by adulthood, the major site of erythropoiesis is the bone marrow (Nussbaum, et al., 2007).
I.2.
Sickle Cell Disease
The hemoglobinopathies are a class of hereditary diseases that can be further divided in three distinct groups, according to the resulting consequence of the mutation: i) structural (qualitative) variants, in which the mutation causes an alteration in the globin polypeptide without affecting its rate of synthesis; ii) thalassemias (quantitative defects) in which the synthesis or stability of the globin protein are affected, causing an imbalance in the available globin chains; and iii) hereditary persistence of fetal hemoglobin (HPFH), a defect in the globin switching, that impairs the switch from γ- to β-globin, leading to high levels of HbF during adulthood (Nussbaum, et al., 2007). HPFH is a benign condition that can ameliorate the outcome of some cases of β–globin associated anemias.
1.2.1.
Genetic basis and Pathophysiology of Sickle Cell Disease
Sickle cell disease (SCD) is a hemolytic anemia caused by a single mutation in the β-globin gene that alters the hemoglobin protein to HbS (sickle hemoglobin). The mutation, a substitution of valine for glutamic acid at the sixth amino acid residue of β-globin (Kumar, et al., 2013), does not alter the ability of the protein to transport oxygen. However, in low-oxygenated blood the HbS molecule has only about 1/5 of the solubility of the HbA molecule. This leads to the aggregation of HbS molecules, that will form polymeric fibers, deforming the red blood cells (RBCs) (see Figure I.4.), rendering them a sickle form (Nussbaum, et al., 2007). These sickle erythrocytes are less deformable and stickier, causing vessel obstruction (vaso-occlusion) and local ischemia. The polymerization of HbS molecules is also accompanied by membrane damage and RBC dehydration, accelerating hemolysis and causing anemia.
Several factors directly interfere with the polymerization of HbS: i) a decreased pH implicates a decrease in hemoglobin affinity to O2, increasing polymerization of HbS; ii) increased temperature
7
substitution of the glutamic acid in the 6th position of the β-globin chain, this time by lysine) (Schnog, et al., 2004).
Figure I.4.: Sickle cell disease. A – Pathophysiology of SCD. Due to the presence of the abnormal valine residue at position 6, Hb S molecules form polymers during low oxygen sates. These polymers cause a distortion of the erythrocyte, which becomes elongated with a sickle shape. The sickling episode is accompanied by a calcium influx that causes loss of potassium and water, with further damages to the membrane skeleton. The distortion is reversible upon reoxygenation, at an early stage; over time, the cumulative damage causes an irreversible distortion in the red blood cell, which is then rapidly hemolyzed. B – Peripheral blood smear. The arrows point to two sickle erythrocytes, the phenotypic hallmark of sickle cell disease. Adapted from Kumar, et al., 2013.
1.2.2.
Disease transmission and presentation
SCD presents itself in homozygous individuals (HbS: αA2βS2) or compound heterozygous
individuals with a different mutation in the second β allele (β0
-thalassemia, β+-thalassemia, HbC). Heterozygous individuals for the hemoglobin S variant (HbAS: [αA2βA2, αA2βS2] and [αA2βAβS]) are
clinically “normal” but may present the sickle cell anemia trait, ie, in extreme low-oxygenation situations, such as high altitudes or great physical efforts, their RBCs may deform (Nussbaum, et al., 2007).
SCD is therefore a recessive disease in its clinical manifestations but the affected gene has dominant expression, since HbAS individuals may present sickle RBCs in deoxygenated blood samples (Schnog, et al., 2004).
8
formed with oxygen depletion, allows the confirmation of the presence of HbS but it does not make a distinction between the different genotypes (summarized in Table I.1) (Schnog, et al., 2004).
Table I.1.: Hematologic parameters characterizing different sickle cell disease genotypes
HbSS HbS-β0tal HbS-β+tal HbSC HbAS
no HbA no HbA 1-25% HbA
> 85% HbS >85% HbS > 50% HbS 50-55% HbS ~ 40% HbS normal HbA2 ↑HbA2 (> 3,5%) ↑HbA2 (> 3,5%)
Adapted from Schnog, et al., 2004.
Methods for the determination of the presence of abnormal hemoglobin forms include hemoglobin electrophoresis, high performance liquid chromatography (HPLC), isoelectric focusing (Schnog, et al., 2004) and targeted mutation analysis to the globin genes sequence.
1.2.3.
Genetic origins and prevalence of the sickle cell hemoglobin gene
It is believed that the βS
mutation had a multicentric origin, occurring independently at least four times in Africa and once in Asia (Pagnier, et al., 1984). The different origins are associated with five main β-globin cluster haplotypes, named after the geographical location where they were first reported: Benim, Bantu, Senegal, Cameroon and Arab-Indian. These haplotypes consist in multiple DNA polymorphisms in and surrounding the β-globin gene cluster, detected by accession of restriction endonucleases (Pagnier, et al., 1984).
Figure I.5.: Common haplotypes associated with the βS-globin gene. Arrows indicate the approximate locations of each restriction endonuclease recognition site in the β-globin cluster. In the bottom table, SNP profiles associated to each haplotype are depicted as “+” for enzyme recognition and hydrolysis or “-“ for absence of enzymatic recognition. Adapted from Steinberg, 2009.
In Portugal, carrier prevalence varies from virtually zero in the north to about 1.1% in the south of the country, with high prevalence pockets where prevalence reaches 5-6%, in the regions of Coruche, Alcácer do Sal and Pias (Martins, et al., 1993; Miranda, et al., 2013).
9
Ferreira, et al., 2011, implicates heme oxygenase 1 (HO-1) induction by low levels of free heme and consequent production of carbon monoxide (CO). CO binds cell-free hemoglobin and inhibits its oxidation, thus preventing the release of heme, which is required to trigger the onset of experimental cerebral malaria.
Gene migration to the autochthon Portuguese people is thought to have occurred by two distinct waves: the first one probably during the Roman Empire and until the Arabic occupation (7th and 8th centuries); the second one with the slave trade, around the 15th century (Lavinha, et al., 1992). Slaves were brought to work in rice camps in the low valleys of Sado, Guadiana and Tejo rivers, where malaria was endemic (Martins, et al., 1993). Nowadays, importation is still significant as a result of Africans migration (Lavinha, et al., 1992). It should also be noted that the main African haplotypes mentioned above are found within phenotipically caucasian Portuguese people, which can be related to the previous occupation of Africa by Portuguese settlers (Martins, et al., 1993).
1.2.4.
Clinical manifestations
Sickle cell anemia is a mendelian single-gene disorder, and the presence of the altered gene product, HbS, is absolutely necessary to originate disease (Steinberg, 2009). However there is a broad spectrum of phenotypic manifestations and complications that makes this disease resemble a multigenic trait (Steinberg, 2009).
Clinical manifestations of sickle cell anemia derive essentially from two phenomena: hemolysis and vaso-occlusion. Given its spectrum of prevalence and severity, attempts have been made to categorize patients in subgroups that would allow physicians to anticipate major complications. Kato et al, 2007, proposed two subphenotypes based on these two main phenomena: the viscosity-vaso-occlusive (VVO) subphenotype, with relatively high hemoglobin levels and related to polymerization of HbS; and the hemolysis-endothelial dysfunction (HDE) subphenotype, associated with low hemoglobin levels and high levels of hemolytic markers (reticulocyte counts, serum lactate dehydrogenase, plasma hemoglobin and arginase).
Viscosity-vaso-occlusion subphenotype:
This subphenotype is characterized by the sickling of erythrocytes and consequent vaso-occlusive events. Microvasculature obstruction by sickle RBCs causes tissue damage in virtually every organ (Kumar, et al., 2013), leading to complications of sickle cell anemia such as vaso-occlusive pain crisis, acute chest syndrome and osteonecrosis (Kato, et al., 2007).
10
bone marrow (high Tt); and iii) the greater adhesive interactions of sickle erythrocytes with vascular endothelial cells (high Tt), which also contributes to the vaso-occlusive process (Schnog, et al., 2004; Kumar, et al., 2013). Additionally, these patients present a proinflammatory state, hypercoagulability and endothelial dysfunction, further promoting a sickle cell-mediated vaso-occlusion predisposition (Schnog, et al., 2004).
Reticulocytes are the most adherent sickle RBCs, displaying a high level of receptors and ligands for their adherence to both endothelium and leukocytes (Kato, et al., 2007). Reticulocyte count is a marker of hemolysis, as the production rate of these cells is increased to compensate for the chronic hemolytic state. The increased adhesiveness of these reticulocytes and sickle erythrocytes then provides a link between hemolytic anemia and vaso-occlusion, where the low nitric oxide (NO) bioavailability in SCD patients (see below) might play an important role, since endothelial cell adhesion molecules that bind the circulating cells will not be suppressed by NO (Kato, et al., 2007).
Figure I.6.: Model of overlapping subphenotypes of SCD. Patients with SCD that present higher hemoglobin levels are here categorized as belonging to the viscosity-vaso-occlusion (VVO) subphenotype, whereas those with low hemoglobin levels and high levels of hemolytic markers (ie, reticulocyte counts, serum lactate dehydrogenase, plasma hemoglobin and arginase) belong to the hemolysis-endothelial dysfunction (HED) subphenotype. In the first case, complications relate to polymerization of sickle hemoglobin, resulting in erythrocyte sickling and adhesion. In the second case, complications arise as consequence of a proliferative vasculopathy and dysregulated vasomotor function, due to a decreased NO bioavailability. The spectrum of prevalence and severity of each subphenotype overlap with each other. Adapted from Kato, et al., 2007.
11
death (Schnog, et al., 2004). Interestingly, there is a reduced rate of painful events associated with hyperhemolysis cases, due to a reduction of blood viscosity. However, when these events occur in association with more severe hemolytic anemia, a reduced survival rate is observed (Steinberg, 2009).
Acute chest syndrome (ACS) occurs in 15-40% of sickle cell anemia patients and is characterized by a pulmonary infiltrate on chest X-ray in a patient displaying dyspnea, pleuritic pain, cof or fever, usually associated with a drop of hemoglobin levels. It could be caused by sickle erythrocytes sequestration, fat embolism or pulmonary vasculature thrombosis, and is usually recurrent (Schnog, et al., 2004).
Hemolysis-endothelial dysfunction subphenotype:
Hemolysis is a critical measure of SCD severity, and appears to be the cause of some disease complications, as mentioned above. The hemolytic process may be intra- or extravascular. Intravascular hemolysis occurs in the vascular compartment, i.e., inside the blood vessels, and might occur by mechanical forces, biochemical or physical agents (Kumar, et al., 2013), and complement recognition (Schnog, et al., 2004). Sickle RBCs are more sensitive to these aggressions due to the membrane damages that occur during deoxygenation. Extravascular hemolysis occurs essentially inside the spleen and liver, two organs rich in macrophages that capture the entrapped RBCs. Due to the loss of deformative capacity of sickle erythrocytes, they get stuck in splenic sinusoids much more frequently than normal RBCs, raising the rate of phagocytosis and therefore hemolysis (Kumar, et al., 2013). Both hemolytic processes account for the diminished life span of these cells, from the normal 120 days to only about 17 days (Schnog, et al., 2004).
In order to compensate for the reduced life time of RBCs, these patients have an elevated rate of erythropoiesis, which ultimately causes normally inactive bone marrow sites to reactivate (Schnog, et al., 2004), leading to bone reabsortion and secondary bone formation with consequent skeletal deformation (usually high cheekbones and skull alterations) (Kumar, et al., 2013). Additionally, to maintain a steady oxygen supply, patients develop a hyperdynamic circulation, with plasma volume expansion, eventually leading to dilated cardiomyopathy in an early age (Schnog, et al., 2004).
Chronic hemolysis causes retention of degradation resulting products (Kumar, et al., 2013) due to saturation of excretory mechanisms. Heme degradation leads to high levels of non-conjugated bilirubin which in turn causes jaundice and development of gallstones (Schnog, et al., 2004).
12
production of free oxygen radicals, further limiting NO bioavailability and activating endothelium; iii) lysed RBCs also liberate arginase that destroys L-arginine, the precursor of NO (Kato, et al., 2007).
Figure I.7.: Decreased NO bioavailability in SCD. Nitric oxide is produced by three different isoforms of NO synthase. Intravascular hemolysis reduces nitric oxide bioactivity by releasing hemoglobin and arginase, which inactivate NO and consume plasma L-arginine (NO precursor), respectively. Additionally NO is consumed by reactions with reactive oxygen species highly produced in SCD. The resulting decrease in NO is associated with leg ulceration, priapism, pulmonary hypertension and possibly non-hemorrhagic stroke. Lactate dehydrogenase (LDH) is also released from RBCs during the hemolytic process and constitutes a marker for the magnitude of hemoglobin and arginase release (marker of hemolysis). Adapted from Kato, et al., 2007.
The normal vascular balance is therefore skewed toward a vasoconstriction state, with endothelial activation and proliferation (Kato, et al., 2007).
This subphenotype is further characterized by a proliferative vasculopathy and dysregulated vasomotor functions, including leg ulcers, priapism, pulmonary hypertension and possibly non-hemorrhagic stroke (Kato, et al., 2007).
I.3.
Cerebral Vasculopathy in Sickle Cell Disease
I.3.1.
Silent Cerebral Infarcts and Overt Strokes
13
SCIs vary from clinical strokes in size and location, therefore accounting for their different severity: SCIs usually occur deep in the white matter of the frontal (81%) and parietal (45%) lobes and are typically smaller, whereas clinically apparent strokes locate in the cortex and deep in the white matter, with larger dimensions (DeBaun, et al., 2012).
I.3.2.
Incidence
Global incidence of overt stroke in children is 1.29/100000 per year. Children with SCD have a 221-times greater risk for the occurrence of overt stroke and an increased risk for cerebral infarcts to develop of about 410 times (Switzer, et al., 2006). SCI are the most common cause of neurological disease in children with SCD, occurring in 17% of the cases before the 6th birthday, and 27% before the 14th birthday(Switzer, et al., 2006). Overt stroke occurs in about 11% of SCD patients before the age of 20 and in 24% of such patients by the age of 45 (Switzer, et al., 2006). The major incidence is observed during the first decade of life, with 2-5% of occurrences happening before the 6th anniversary (DeBaun, et al., 2012).
Among patients with the common genotypes of SCD, cerebrovascular accidents (CVAs) are most frequent in those with genotype αA
2βS2 (SS), followed in decreasing order by genotypes αA2βSβ0
-thalassemia (Sβ0-thal), αA2βSβ+-thalassemia (Sβ+-thal) and αA2βSβc (SC) (Ohene-Frempong, et al.,
1998).
Children with less than 2 years of age have the lowest CVA incidence (Ohene-Frempong, et al., 1998), but the highest risk for infarctive stroke occurs during the first decade of life, between ages 2 and 9. This risk decreases during the second decade, to rise again throughout the third (Switzer, et al., 2006). About two thirds of patients present recurrent cerebral infarction within the two to three years after the initial event (Switzer, et al., 2006).
Hemorrhagic strokes appear to occur less frequently in children. However, while ischemic stroke is rarely fatal, 1/4 of patients die because of a hemorrhagic stroke (Switzer, et al., 2006).
14
I.3.3.
Risk Factors and Predictors
The most relevant risk factors for SCIs to occur include seizures, low hemoglobin levels, systolic hypertension in adults (but not children), and being male (Kinney, et al., 1999) (DeBaun, et al., 2012). Seizures in children with SCD increase the risk for SCI 15 times (Kinney, et al., 1999). A higher frequency of ischemic lesions was reported in association with elevated red blood cell counts, probably associated with early impairment of spleen function, and with the Senegal βS haplotype (Kinney, et al., 1999). This haplotype effect is independent of HbF concentration, a major modulator of SCD severity (see page 21) since there appears to be no protective effect from higher HbF levels in the lesions (Kinney, et al., 1999). An elevated white blood cell (WBC) count has also been implicated as risk factor for SCIs (Kinney, et al., 1999; Switzer, et al., 2006).
Aside from the steady-state leukocytosis and baseline hemoglobin below 7 g/dL (Fasano, et al., 2015), stroke predictors differ from SCI risk factors, further implying different etiologies for these cerebrovascular anomalies. The most significant predictors of stroke comprise previous transient ischemic attack (TIA), relative hypertension, increased frequency of acute chest syndrome (Fasano, et al., 2015) and nocturnal hypoxemia (O2 saturation below 96%) (Switzer, et al., 2006). The presence of
SCI is a risk factor for additional neurological damage, increasing 14 times the risk of overt stroke and progressive silent cerebral infarct (DeBaun, et al., 2012).
High white blood cell counts have been implicated in both ischemic (Switzer, et al., 2006) and hemorrhagic stroke (Ohene-Frempong, et al., 1998), the latter probably when in association with low total hemoglobin levels (Switzer, et al., 2006). The type of stroke may arise by different pathophysiologic mechanisms or as a consequence of progressive cerebrovascular damage (Ohene-Frempong, et al., 1998).
I.3.4.
Pathophysiology of Ischemic Stroke
Stroke in SCD has been described since 1923 and, in 1972, Stockman et al. conducted a case-study that demonstrated the particular vulnerability of the internal carotid artery and circle of Willis to these ischemic events. In this case-study, the authors proposed that the large vessel disease might derive from a small vessel disease, where the sickle RBCs would occlude the nutrient arteries of the large arteries (vasa vasorum) causing ischemia and progressive intima and media-wall proliferation of the latter (Stockman, et al., 1972). This sickle cell entrapment in the microvasculature may also be the cause of silent cerebral infarcts (Switzer, et al., 2006). In SCD patients, sickle RBCs are unusually adherent to the vascular endothelium and the strength of interaction appears to correlate to the clinical severity of vaso-occlusive events inherent to the disease (Switzer, et al., 2006).
15
The stroke syndrome in children with SCD occurs mainly by infarction of the large arteries of the anterior portion of the Circle of Willis, preferentially just beyond the origin of the ophthalmic artery, internal carotids (Adams, 2007) and anterior cerebral arteries (Switzer, et al., 2006) (See Figure I.9.). Intermediate regions are less involved and the posterior vasculature is almost entirely spared (Switzer, et al., 2006).
Figure I.9.: Representation of the Circle of Willis in situ. Localization of the large arteries of the brain. In a dashed line the Circle of Willis is depicted. The arteries mainly implicated in ischemic stroke events are also highlighted (full boxes). Adapted from Netter, 2006.
The most common hystopathological finding in CVAs associated to SCD is damage to the endothelium of the mentioned arteries, particularly at branch points, inducing intimal proliferation, fibrin deposition and thrombus formation (Kassim & DeBaun, 2013). Thickening of the tunica intima
is due to the proliferation of fibroblasts and smooth muscle cells that occurs as a consequence of recurrent endothelial damage by RBCs (Switzer, et al., 2006).
16
Consequently, strokes in children do not have an embolic etiology but rather result from progressive stenosis of arteries due to intimal proliferation (Fasano, et al., 2015). The extent of stroke correlates to the severity of the underlying stenosis (Fasano, et al., 2015).
Is has been proposed that the ischemic events leading to stroke may result from a basal hyperemia caused by dilation of the intracranial vasculature as a compensatory mechanism for anemia (Switzer, et al., 2006). The rather increased viscosity of the blood in these patients limits blood flow through stenotic vessels (Fasano, et al., 2015) and episodes of systemic stress cause depletion of vascular reserves, ultimately deriving to perfusion insufficiency distal to the stenotic area (Switzer, et al., 2006).
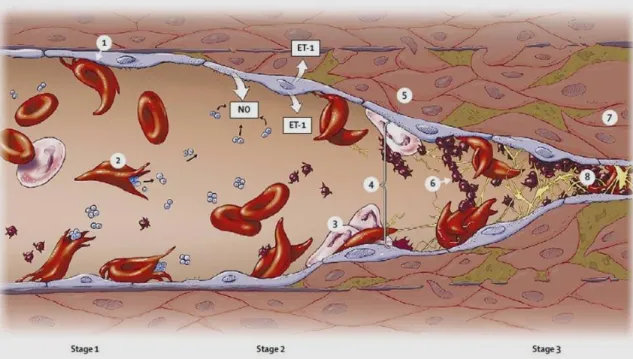
Figure I.10.: Pathophysiology of stroke in SCD. The abnormal adherence (1) and high rate hemolysis (2) of the sickle erythrocytes are the basis for the development of cerebrovascular disease in patients with SCD. The activated endothelium expresses a great amount of endothelium-specific molecules, promoting leukocyte adhesion (3), platelet aggregation (6), and increased release of the vasoconstrictor endothelin (ET-1). The scavenging of NO by cell-free hemoglobin further increases vasomotor tone (4). Tissue remodeling due to smooth-muscle cells and fibroblasts proliferation in the intimal layer (5) leads to luminal narrowing, followed by vasculopathy (7) and occlusion (8). Adapted from Switzer, et al., 2006.
I.3.5.
Diagnosis of vasculopathy in SCD patients
17
and blood viscosity, which is influenced by the hematocrit (the percentage of RBC in the blood; also known as packed cell volume - PCV) and leukocyte and platelet counts (Asbeutah, et al., 2014).
Blood flow at the medial cerebral artery is measured as a time-averaged mean of maximum velocity (TAMMV) by TCD. Its values vary from adults (60 cm/s) to children, and from healthy children (90 cm/s) to those with SCD (130 cm/s) (Adams, 2007). TAMMV has a higher predictive value for overt stroke than peak systolic velocity (Fasano, et al., 2015). As mentioned before, increased blood velocity in the terminal portion of the internal carotid artery or the medial cerebral artery indicates intracranial vasculopathy that may progress to overt stroke (Kassim & DeBaun, 2013). Children with a TAMMV below 170 cm/s are considered “normal” or average risk; between 170 cm/s and 199 cm/s, children present a moderate risk, and are classified as “conditional”; 200 cm/s and above, children are at high risk for developing overt stroke (Adams, 2007). Additionally, velocities greater than 200 cm/s appear to be associated with a more impendent risk of stroke (Adams, 2007).
However, the relationship between an elevated TCD measurement and the incidence of stroke is not precise: approximately seven children with an elevated TCD measurement must undergo transfusion therapy (see below) in order to prevent one of them from having a stroke; and individuals above 16 years of age do not appear to have significantly higher risk of stroke even in the presence of elevated TCD measurements (Fasano, et al., 2015).
In a variety of studies, magnetic resonance angiography (MRA) on children with SCD allowed identification of about 10% of cases with cerebral vasculopathy, even when neurologically asymptomatic (Fasano, et al., 2015). The risk of developing a first overt stroke due to cerebral vasculopathy in the absence of an abnormal TCD has not been defined (Fasano, et al., 2015).
Since SCIs constitute a documented risk factor for the occurrence of overt stroke, MRI of the brain is an important tool in assessing this hazard. The annual stroke risk is considerably higher for children with concomitant SCIs and abnormal TCD velocities, when compared to those with abnormal TCD only (see Table I.2.).
Table I.2.: Stroke risk in children with SCA
Condition Annual Stroke Risk
Healthy children (without SCA or congenital heart disease) 0,003%
Children with SCA (HbSS) 0,5-1%
Children with SCA and SCI on MRI 2-3%
Children with SCA and conditional TCD 2-5%
Children with SCA and abnormal TCD 10-13%*
Children with SCA and previous overt stroke ~30% Children with SCA, previous overt stroke, and with progressive
cerebral vasculopathy
~9%
*For the first 3-4 years following abnormal TCD, the stroke-free survival plateaus at 60-70% Adapted from Fasano, et al., 2015.
18
did not have evidence of vasculopathy as assessed by MRA and, for those with both findings, there was no correlation between the side of vasculopathy and the side of SCI. About 1/3 of children lack vasculopathy at the time of first overt stroke, and about 20% of strokes in SCD patients coincide with other acute medical events (Casella, et al., 2010; Fasano, et al., 2015).
I.4.
Disease Management
Since SCD is a genetic disease, couples at high risk should attend genetic consults in order to be informed of their situation and options, namely the choice to submit to prenatal diagnostic testing. Neo-natal diagnostic measures should also be implemented, since the sooner a child is diagnosed with SCD, the easier it becomes to timely understand symptoms and try to ameliorate them, therefore improving the quality of life of these children. Screening programs are also important, especially in areas with high carrier prevalence.
Because a cure for SCD is unavailable, specific therapies are necessary to address the different clinical manifestations, such as vaccination and penicillin prophylaxis to prevent infections and administration of painkillers and fluids to relief pain crises (Schnog, et al., 2004).
Many pharmacological approaches have been and are being tested, but thus far only hydroxyurea (HU) has been proven to reduce pain crises and ACS (Schnog, et al., 2004). HU is a ribonucleotide reductase inhibitor, primarily used in myeloproliferative diseases (Schnog, et al., 2004). It has been showed to stimulate HbF production, therefore decreasing HbS concentration and inhibiting its polymerization (Switzer, et al., 2006). Furthermore, HU decreases expression of RBCs and endothelial-cell adhesion molecules, may work as a NO donor and reduces reticulocyte (Switzer, et al., 2006), leukocyte and platelet counts (Fasano, et al., 2015).
Additionally, HU therapy decreases TCD velocity, probably as a result of a reduction in turbulent flow and consequent endothelial damage around stenosis, and improves cerebral oxygen saturation, (probably due to increased hemoglobin levels and lower total blood viscosity), which may raise the threshold for infarction (Verduzco & Nathan, 2009). However, its efficacy in preventing primary stroke events has not yet been supported by a controlled, randomized trial (Verduzco & Nathan, 2009). Despite being relatively safe and effective in pediatric patients (Schnog, et al., 2004), HU can cause marked neutropenia and thrombocytopenia, which requires close monitoring of cell counts (Switzer, et al., 2006). The carcinogenic potential appears to be small (Switzer, et al., 2006), but it cannot be discarded for long-term exposure (Schnog, et al., 2004). Also, about 40% of patients fail to respond to treatment with HU (Schnog, et al., 2004). For all the above mentioned reasons HU therapy is currently limited to clinically severely affected patients (Schnog, et al., 2004).
19
Chronic blood transfusion (CBT) has proven to be effective for both primary and secondary stroke prevention, in randomized controlled trials (Verduzco & Nathan, 2009) (Fasano, et al., 2015), with a reduction of the risk of a first overt stroke in children with high TCD velocities of about 90%, and a decrease from 70% to 20% of a second stroke event (Fasano, et al., 2015). When discontinued, a high rate of strokes or recurrence was observed (Adams, 2007) (Fasano, et al., 2015).
Blood transfusions improve oxygen saturation by increasing arterial oxygen pressure and hemoglobin-oxygen affinity, therefore reducing RBC sickling (Switzer, et al., 2006). This might explain the reduced incidence of stroke, as well as painful crises and ACS (Schnog, et al., 2004). An immediate hemodynamic effect has been described, with reduction of blood velocity in middle cerebral artery (Switzer, et al., 2006).
Although CBT apparently delays the progression of cerebral vasculopathy, it does not reverse vasculopathy, prevent its progression or eliminate de ongoing risk of cerebral infarcts (Fasano, et al., 2015). Those cases where CBT fails to normalize TCD values are considered high risk (Fasano, et al., 2015).
As mentioned above, seven patients must undergo CBT to prevent one stroke (Fasano, et al., 2015). Additionally, CBT-related complications, such as alloimunization, risk of transmission of viral infections and iron overload (Schnog, et al., 2004) raise some concerns in both families and clinicians about the benefits vs risks of this approach (Switzer, et al., 2006). In case of iron overload, a concomitant chelation therapy must be performed in order to continue transfusion therapy. (Schnog, et al., 2004).
HU therapy has been considered an acceptable alternative to CBT for children with TCD velocities higher than normal that lack significant cerebral vasculopathy, since in small cohorts it has shown a reduction of TCD values from abnormal or conditional to normal (Fasano, et al., 2015). Some studies showed a similar stroke recurrence between patients transitioned from CBT to HU and those undergoing transfusion prophylaxis (Switzer, et al., 2006). The efficacy of a combination of both therapies, however, remains to be studied in large cohorts (Fasano, et al., 2015).
Severely affected patients may be referred by clinicians for bone marrow transplantation (BMT), the only potentially curative treatment currently available for SCD (Switzer, et al., 2006). BMT has resulted in marked disease amelioration (Schnog, et al., 2004), with no stroke recurrence history and actual vasculopathy regression (Switzer, et al., 2006). This allows children to become transfusion-independent (Fasano, et al., 2015).
20
There is no established therapy available for primary or secondary SCI prevention (DeBaun, et al., 2012), although there are some lines of evidence of lesion reduction following blood transfusions as well as a decrease in the risk of new silent infarcts (Switzer, et al., 2006).
I.5.
Genetic Modifiers
The great phenotypic variability of SCD patients makes it very hard for clinicians to anticipate the disease’s clinical course (Thein, 2013). It has been proposed that this variability might be associated, at least to some extent, with different genetic backgrounds.
Ideally the identification of specific biomarkers for disease severity would help stratify patients according to their susceptibility for major SCD-related complications. HbF and α-thalassemia are two well studied biomarkers for severity in SCD. These conditions are also the two main modulators of the disease, as they are capable of changing the intracellular concentration of HbS, which in turn dictates the rate of polymerization – the key phenomenon to causing SCD related medical problems (Damanhouri, et al., 2015).
As mentioned before, the brain is a major site of morbidity in children with SCD and nowadays TCD screening is the main biomarker used for detection of cerebral vasculopathy (Thein, 2013). However, a truly meaningful point for primary prevention should avert vascular damage prior to the increase in TCD velocities (Thein, 2013). The limitations of TCD screening on accurately identifying all SCD patients at risk for development of cerebrovascular complications, associated with some reluctance of both physicians and families to commit to an indefinite chronic transfusion program, demand the determination of more sensitive and specific stroke prediction biomarkers (Flanagan, et al., 2011).
Studies with twins showed an increased risk for stroke if a child has a sibling that has already experienced an overt stroke. These studies show a genetic contribution to stroke, furthermore evidenced by several association studies between putative gene polymorphisms and the development of cerebrovascular disease in SCD patients (Domingos, et al., 2014). Hence the identification of such genetic modulators can provide a more accurate estimation of disease severity as well as evidence or clues for new targets for therapeutic intervention (Thein, 2013).
One should however keep in mind that the clinical course of the disease is not only influenced by genetic factors, but also environmental, social and economical factors (Domingos, et al., 2014).
I.5.1. Genetic modulation of overall SCD severity
β-globingenotype
21
usually presenting milder forms of the disease (Thein, 2013). However, this tendency is not an absolute rule.
βS
-globinassociated haplotypes
As mentioned earlier, the sickle cell mutation occurs in association with specific βS-globin haplotypes (see page 8), characteristic of the geographical origin of the primitive mutation. Although there is high heterogeneity of clinical manifestations within each haplotype, these haplotypes have been associated with clear hematological and clinical differences (Steinberg, 2009). As general rule, the most severe clinical courses have been associated to Bantu haplotype, with highest incidence of organ damage; milder phenotypes, as measured by lower rates of hospitalization and fewer painful episodes, have been associated to Senegal/Arab-Indian haplotypes; and Benim haplotype has been associated to intermediate features (Steinberg, 2009).
Hereditary persistence of fetal hemoglobin (HPFH)
Akinsheye, et al., 2011, have defined the “HbSF” phenotype described in 1984 by Steinberg, as the presence of 10% or more HbF in SCD patients with 4 or more years of age, since this is the age at which HbF levels stabilize. HbF prevents polymerization of HbS molecules by two means: by decreasing the intracellular concentration of HbS, it slows the polymerization rate; and the hybrid tetramers (α2βγ) (Thein, 2013) are incapable of entering the HbS polymerization phase, halting it
(Damanhouri, et al., 2015).
HbF is genetically modulated (Steinberg, 2009). It varies from adult hemoglobin due to its higher affinity for oxygen, necessary for the growing fetus to better access it from the mother’s bloodstream (Damanhouri, et al., 2015). Its persistence in adulthood is an abnormal condition (HPFH) that turns out to be advantageous to anemic patients. HbF level is a major survival predictor in SCD patients and lower levels have been implicated in increased risk for brain infarcts in children (Wang, et al., 2008).
Two main genetic alterations lead to increased %HbF and usually milder SCD phenotypes: i) a CT polymorphism 158 bp 5’ to HBG2 (rs7482144), associated with β-globin cluster haplotypes Senegal and Arab-Indian (Steinberg, 2009); and ii) a TC polymorphism in the second intron of
BCL11A (rs11886868), that locates at chromosome 2p16.1and codes for a γ-globin zinc-finger repressor (Uda, et al., 2008).
Other minor mechanisms are certainly involved in further regulating HbF expression.
Co-inheritance of α-thalassemia
22
These SCD-α-thalassemia patients have higher %Hb and RBC lifespan, with lower MCV, reticulocyte counts, bilirubin level and RBC aggregates (Damanhouri, et al., 2015). In fact, by reducing the mean cellular HbS concentration, α-thalassemia lowers its polymerization and consequent sickling and hemolysis of RBCs, while raising hematocrit and thus overall blood viscosity (Thein, 2013).
Due to the decreased rate of hemolysis and the evidence of a reduction in the incidence of elevated TCD flow velocities and stroke (Steinberg, 2009), several authors associate this condition with stroke prevention, albeit the apparently little effect in overall survival (Thein, 2013; Coelho, et al., 2014). Flanagan et al, 2001, however, found a higher frequency of the deletion in their study control group (ie, no-stroke group).
Although extensively studied and repeatedly implicated in modulating the overall sickle cell disease severity, HbF level and co-inheritance of α-thalassemia cannot fully explain the phenotypic diversity. Several genes, and their alterations, have been studied for implications in particular clinical or laboratory manifestations, based on their potential role in pathophysiologic events.
1.5.2. Putative Genetic modulators of Ischemic Stroke in SCD
In the context of ischemic stroke, such polymorphic genes may be divided into three main groups, according to the underlying pathologic event, known to participate in the pathophysiology of vasculopathy (see above): endothelium activation, vasodilation/vasoconstriction balance and systemic inflammation. It should be noted that this division is not strict but rather a simplification to aid in the understanding of the possible roles of the gene alterations since all genes mentioned below have systemic implications, and may contribute in more than one way to the outcome of the disease.
I. ENDOTHELIUM ACTIVATION
Vascular cell adhesion molecule – 1 gene: VCAM-1
VCAM-1 is a critical member of the cell adhesion molecules (CAMs) that coordinates the inflammatory response (Taylor, et al., 2002). A link has been observed between an increased serum lactate dehydrogenase (LDH) level – a proximal biochemical marker of hemolysis – and a generalized endothelial activation, characterized by increased levels of adhesion molecules, especially VCAM-1 (Coelho, et al., 2014). This sialoglycoprotein is highly expressed at the surface of endothelial cells of both large and small vessels, following cytokine stimulation, and sickle erythrocytes are particularly prone to adhere to VCAM-1 (Swerlick, et al., 1993; Gee & Platt, 1995).
23
al., 2002), respectively, and some promoter haplotypes have been associated to hyperactive variants (Idelman, et al., 2007).
Thrombospondin-1 gene: THBS-1
Thrombospondin (THBS) is an extracellular matrix (ECM) homotrimeric glycoprotein that binds various matrix proteins, integrins and cell surface receptors, such as Cluster of Differentiation – 36 (CD36; see below) (Liu, et al., 2015). It modulates a wide range of biological functions including cell adhesion, endothelial cell proliferation and chemotaxis (Liu, et al., 2015). There have been reports of increased levels of THBS in conditions associated with tissue damage and inflammation, (Liu, et al., 2015).
One nonsynonymous SNP, rs2292305, has been described in the THBS-1 gene – located in chromosome 15q15 (Jaffe, et al., 1990) – as being associated with intima-media thickness (IMT) in the internal carotid artery (Liao, et al., 2008). IMT is a marker of subclinical atherosclerosis and is associated with increased risk of stroke and cardiovascular disease (CVD) (O'Leary, et al., 1999).
Cluster of Differentiation – 36 gene: CD36
CD36 is a transmembrane protein (Rać, et al., 2007 ) whose expression is significantly higher in reticulocytes and RBCs of SCD patients, when compared to controls (Odièvre, et al., 2008). This glycoprotein is implicated in the binding of RBCs to endothelial lining of blood vessels by its binding to THBS (Damanhouri, et al., 2015).
CD36 gene locates in chromosome 7q11.2, and possesses 15 exons (Rać, et al., 2007 ). At least one SNP at the 5’UTR, rs1984112, has been associated with higher reticulocyte counts, a marker for increased hemolysis (Coelho, et al., 2014).
II. VASODILATION/VASOCONSTRICTION BALANCE Endothelial Nitric Oxide Synthase gene: eNOS or NOS3
NO is produced in a basal level by eNOS in endothelial cells, allowing for the establishment of a resting tone of the resistance vessels that regulates the arterial blood pressure (Kelm, et al., 1999). The importance of NO and the relevance in NO production disequilibrium in SCD have been discussed above. NO produced by eNOS appears to be beneficial in ischemic stroke (Tao & Chen, 2009).
NOS3 gene is located on chromosome 7q35-q36 and contains 26 exons throughout 21 kb (Tao & Chen, 2009). Three polymorphisms have been implicated in decreased NO production and propensity for vascular disease: rs2070744 (in the promoter of NOS3), rs1799983 (in exon 7, missense) and a 27-bp VNTR in intron 4 (for detailed review consult Cooke, et al., 2007).
Endothelin-1 gene: ET-1