This work is licensed under the Creative Commons Attribution-NonCommercial-ShareAlike 4.0 International License.
Attendance in Physical Education classes and
associated factors among high school students
Participação nas aulas de Educação Física e fatores associados em estudantes do
ensino médio
AUTHOR’S Alcides Prazeres Filho1,2
Gerfeson Mendonça2,3
João Miguel Souza Neto2
Rafael Miranda Tassitano4
Anderson Barbosa Paiva Silva2
José Cazuza de Farias Júnior1,2,5
1 Post-Graduation Associated Program in Physical Education – UPE/UFPB, Department of Physical Education, João Pessoa, Paraíba, Brazil. 2 Research and Study Group in Epidemiology of Physical Activity – GEPEAF, João Pessoa, Paraíba, Brazil.
3 University Center Cesmac, Maceió, Alagoas, Brazil.
4 Rural Federal University of Pernambuco, Department of Physical Education, Recife, Pernambuco, Brazil.
5 Federal University of Paraíba, Department of Physical Education, João Pessoa, Paraíba, Brazil. CORRESPONDING
Alcides Prazeres Filho [email protected]
Federal University of Paraíba, Department of Physical Education Campus I, Cidade Universitária, João Pessoa, Paraíba, Brazil. ZIP Code: 58059-900.
DOI
10.12820/rbafs.24e0083
ABSTRACT
This study examined the prevalence of attendance in Physical Education (PE) classes and associated factors among high school students. A cross-sectional study performed with 2,874 public and private high school students (57.9% girls, mean age of 16.45 years; SD = 1.22) from João Pessoa, Paraíba, Brazil. Attendance in PE classes was measured by the question: ‘How many PE classes do you attend during a normal week? The factors measured were: attitude, self-efficacy, risks and benefits related to physical activity (PA), perceived health, PA level, sedentary behavior and nutritional status. Binary logistic regression was used. It was observed that 41.9% attended two or more PE classes per week, with higher prevalence rates in public school students than private school counterparts (56.6% vs. 6.6%; p < 0.001). Higher attendance in PE classes was observed in male and younger students from both school systems. It was also observed in students who did not work, were members of the highest economic class and whose parents had higher schooling levels in public schools, and from 1st and
2nd grades of high school education in private institutions. Attending two or more PE classes per
week is positively associated with a more favorable attitude to engaging in PA as well as its level, in both school systems, and with positive health perception among public students. In conclusion, attendance in PE classes was low, particularly in private schools. Attending two or more PE classes per week was associated with positive aspects of PA and health in the students under study.
Keywords: Physical education; Adolescent; Motor activity; School health; Motivation.
RESUMO
O presente estudo determinou a prevalência de participação nas aulas de Educação Física (EF) e analisou fatores associados em estudantes do ensino médio. Estudo transversal com 2.874 estudantes do ensino médio das redes pública e privada (57,9% feminino, média de idade = 16,45 anos; DP = 1,22) de João Pessoa, Paraíba, Brasil. A participação nas aulas foi mensurada pela pergunta: ‘Durante uma semana normal, em quantas aulas de EF você participa?’. Os fatores mensurados foram: atitude, autoeficácia, riscos e benefícios relacionados à prática de atividade física (AF), percepção de saúde, nível de AF, comportamento sedentário e estado nutricional. Foi utilizada regressão logística binária. Observou-se que 41,9% dos estudantes parti-cipavam de duas aulas ou mais de EF por semana, sendo maior nas escolas públicas comparado às privadas (56,6% vs. 6,6%; p < 0,001). Uma maior participação nas aulas foi identificada nos estudantes do sexo masculino e mais jovens de ambas redes de ensino, nos estudantes da rede pública que não trabalhavam, de classe econômica mais alta e com maior escolarização dos pais, e naqueles da rede privada das 1ª e 2ª séries do ensino médio. Participar de duas ou mais aulas de EF por semana foi positiva e significativamente associada com atitude mais favorável à prática e ao nível de AF dos estudantes; e com percepção positiva de saúde nos estudantes da rede pública. A participação nas aulas de EF foi baixa, particularmente na rede privada. Participar de duas ou mais aulas de EF por semana se associou a aspectos positivos em relação à AF e à saúde dos estudantes.
Palavras-chave: Educação Física; Adolescente; Atividade motora.
Introduction
According Worldwide Survey of School Physical Edu-cation (PE) – Final Report 2013, PE is a mandatory curricular component of basic education in several cou-ntries1. In Brazil, the Law of National Guidelines and
Bases of National Education - LDB2 made PE
man-datory for elementary and secondary students, except
for those who work six or more hours a day, persons aged 30 years or older, armed forces personnel, those with chronic diseases or disorders, and female students with children2.
The quality of PE report of United Nations Educa-tional, Scientific and Cultural Organization (UNES-CO) suggests this discipline is a basic right and should
be an important part of the educational system. In ad-dition, it is an essential component for empowering an active and healthy lifestyle3 and contributing to the
de-velopment of biological, affective, cognitive, motor and sociocultural aspects of human movement.
Previous state and municipal surveys have report-ed low attendance in PE classes, such as Pernambu-co – 33.1%4, Santa Catarina – 58.8%5, São Paulo city
(São Paulo) – 49.5%6, Londrina (Paraná) – 72.9%7 and
Aracaju (Sergipe) – 79.5%8. According to UNESCO
reports3, this problem is not confined to Brazil, but
prevalent worldwide. The scenario can be even more worrisome if the effective attendance of students is considered6.
Attending PE classes has been associated with less exposure to sedentary behaviors9, higher levels of
phys-ical activity4,7, greater participation in sports7, healthy
eating habits4 and lower likelihood of consuming legal
and illegal drugs5. Self-efficacy10, positive attitudes
to-ward physical activity1 and perceived risks and benefits
of physical activity10 are factors linked to physical
ac-tivity in adolescents. Thus, attending PE classes may be associated with these factors in students.
However, important knowledge gaps persist, re-garding high school student attendance in PE classes and their distribution in public and private schools; the association between attending these classes and behav-ioral factors, physical activity correlates, nutritional sta-tus and perceived health stasta-tus.
Information on student attendance in PE classes may help identify groups with lower attendance and increase knowledge about the possible benefits asso-ciated with attending these classes. Thus, the aim of this study was to determine the prevalence of PE class attendance and analyze the association with physical activity level, sedentary behavior, correlates of physical activity, nutritional status, and perceived health sta-tus among public and private high school students in Northeastern Brazil.
Methods
This cross-sectional epidemiological study was conduc-ted with data from a representative sample of public and private high school students in João Pessoa, Paraí-ba, Northeastern Brazil, in 2009. The reference popula-tion of 32,112 high school students, given the multiple outcomes of the project was considered to determine sample size prevalence estimated at 50%; maximum er-ror of three points percentage points; 95% confidence
interval; design effect (deff) of two; and 30% increase in the minimum sample size to compensate for losses and refusals, resulting in a sample of 2,686 students.
In the first stage, of the 82 existing schools in the municipality, 30 schools were systematically selected, distributed proportionally by size (number of students enrolled), type (16 public and 14 private) and geo-graphic location (north, south, east and west). In the second, 135 classes were randomly selected (based on an estimated 20 students per class), distributed accord-ing to the proportion of students enrolled per grade (1st,
2nd and 3rd grade) and study shift (morning, afternoon
and night). Adolescents who did not provide written informed consent were considered sample losses. Ex-clusion criteria were adolescents outside the established age range (younger than 14 and older than 19), any im-pairment that hindered or limited physical activity and/ or prevented them from completing the questionnaire.
Data collection was carried out between May and September 2009 by a team of six previously trained PE students submitted to a pilot study under the same conditions as the primary study. The students who were present for at least one of two data collection team vis-its responded to the questionnaire during regular class time, in the form of a collective interview (mean dura-tion of 25 minutes per applicadura-tion).
The sociodemographic variables measured were sex (male and female), age in years and later categorized (14-15 and 16-19 years of age), father’s and moth-er’s schooling (elementary, secondary and university), employment status (working or not working), skin color (white and non-white [mulatto, black, yellow and indigenous]) and economic class (Methodology of the Brazilian Association of Research Companies - ABEP11, using the following categories: class A/B and
class C/D/E).
Attendance in PE classes was measured by the question “How many PE classes do you attend dur-ing a normal week?” The answer options were: I don’t have physical education classes; I do not participate in classes; 1 class per week; 2 lessons per week and; > 3 classes per week. This variable was categorized as fol-lows: none, one class per week and two or more classes per week (kappa coefficient = 0,90).
Physical activity was measured by a questionnaire that presented high levels of reproducibility (ICC = 0.88; 95%CI: 0.84-0.91) and moderate levels of valid-ity (rho = 0.61; p < 0.01)12. The students provided
(minutes/day) of moderate to vigorous physical activi-ties engaged in for at least 10 minutes a day, during the week preceding data collection. Physical activity level was determined by adding the products of time and frequencies, resulting in a score expressed as minutes per week. Students who engaged in 300 minutes or more per week were classified as physically active and the remainder as physically inactive13.
The measure of sedentary behavior consisted of questions regarding time (hours/day) spent by students watching television, using the computer or playing vid-eogames, during the week (Monday to Friday) and on the weekend (Saturday or Sunday). The weighted mean was calculated by multiplying the number of hours of sedentary behavior on weekdays by five and by two for weekends, adding to two amounts and dividing the re-sult by seven to obtain the average number of hours per day. This variable was categorized as follows: ≤ 2h/day and > 2h/day of sedentary behavior14.
The following correlated factors of physical activ-ity were measured: self-efficacy, attitude, perceived risks and benefits of physical activity. Self-efficacy for physical activity and the perceived risks and benefits were measured by 10 and 12-item scales, respectively, with a four-point Likert scale (ranging from strongly disagree = 1 to strongly agree = 4). Attitude toward physical activity was measured by a five-item scale based on a four-point semantic differential scale. All the scales were previously validated15. A score was
cal-culated using the mean value of the sum of the items on each scale for each of the correlated factors, and for the purpose of analysis, tertiles of these variables were calculated and categorized as low (1st and 2nd tertile)
and high (3rd tertile).
Nutritional status was assessed by body mass in-dex (BMI = body mass [kg] / height [m]²), based on self-reported measures of body mass and height. Nu-tritional status classification followed the criteria sug-gested by Cole et al.16, grouping students into no excess
body weight (low weight + normal weight) and excess body weight (overweigh + obesity). Perceived health status was measured by the question ‘How do you clas-sify your health status’ (poor, fair, good, very good, ex-cellent). Next, these response categories were grouped into negative (poor, fair) and positive health perception (good, very good, excellent).
Mean, standard deviation and 95% confidence in-terval (95%CI) were used to describe numerical vari-ables and relative and absolute frequency distribution
(%) for categorical variables. The chi-square test for heterogeneity was applied to compare the proportion of students in PE classes according sociodemographic characteristics, correlates of physical activity, physical activity level, sedentary behavior, nutritional status and perceived health status.
Binary logistic regression was used to assess the crude and adjusted association between attendance in PE classes (no class/week = 0; one class/week = 1; two or more classes/week = 2) and the dependent variables (physical activity: physically active = 1 and physically inactive = 0; sedentary behavior: < 2 hours/day = 1 and > 2 hours/day = 0; self-efficacy: high = 1 and low = 0; at-titude: high = 1 and low = 0; risks: not perceived = 1 and perceived = 0; benefits: perceived = 1 and not perceived = 0; nutritional status: no excess body weight = 1 and excess body weight = 0; and perceived health: positive = 1 and negative = 0). In multivariate analysis all the independent variables were maintained in the model regardless of p-value. Analyses were stratified by type of school (public vs private), given that this variable exhib-ited significant interaction with the variables sex, age, school grade, parents schooling, economic class, skin color, employment status and perceived health status. Potential confounding factors were: sex, age, economic class, school grade and skin color. Statistical analyses were conducted in Stata 11.0 software. A 5% signifi-cance level was adopted for the two-tailed tests.
The study was approved by the Ethics Commit-tee of the Federal University of Paraiba (Protocol 0062/2009). All adolescents younger than 18 years of age were given permission to take part in the study by their mother/father/legal guardian and those 18 years and older gave their informed consent.
Results
A total of 3,220 students were interviewed, 231 were excluded due < 14 or > 19 years of age, 105 did not provide their age, five had some physical disability that limited or impeded their engaging in physical activity, and five did not respond adequately to the question-naire (many unanswered questions). The final sample consisted of 2,874 students (850 from private schools and 2,024 from public schools) – losses and refusals totaled 17.8% of the cases. A posteriori calculation de-monstrated that sample size of students from private schools had a power of 80% to detect an odds ratios greater than or equal to 1.41 as significant with preva-lence of outcome between 54.5% and 75.0% (among
the exposed) and between 46.5% and 67.7% among the unexposed. Among public schools, the sample size had 80% power to detect odds ratios greater than or equal to 1.26 as significant with prevalence of outcome between 42.7% and 72.9% (among the exposed) and between 37.2% and 67.8% among the unexposed.
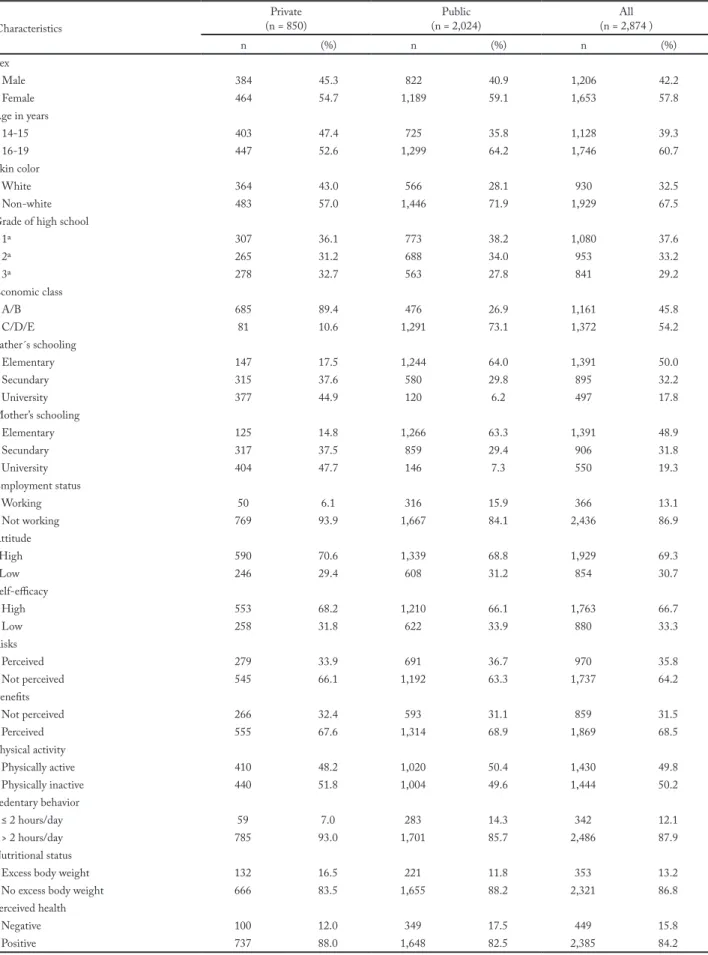
The largest proportion of students was from public schools (70.4%), girls (57.8%), aged between 16 and 19 years (60.7%), belonging to the lower economic classes (C/D/E: 54.2%), whose parents had elementa-ry schooling (fathers: 50.0% and mothers: 48.9%) and who were not working (86.9%). Information on phys-ical activity level, nutritional status, perceived health, sedentary behavior and correlated factors of physical activity are described in Table 1.
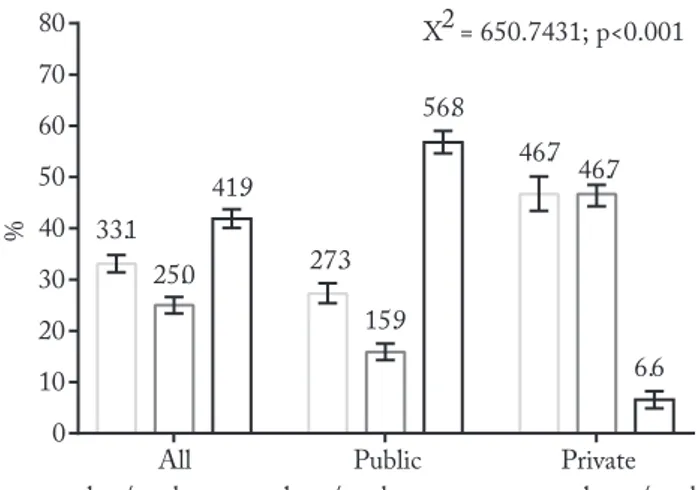
The proportion of students who reported to par-ticipate two or more PE classes per week was 41.9% (95%CI: 40.1 – 43.7), with significantly higher pro-portions in public schools (56.8%; 95%CI: 54.6 – 59.0) when compared to private institutions (6.6%; 95%CI: 4.9 – 8.2; p < 0.001) – Figure 1.
Figure 1 – Frequency of participation in Physical Education classes among public and private high school students, João Pessoa, Paraíba, Brazil, 2009 (n = 2,874 students)
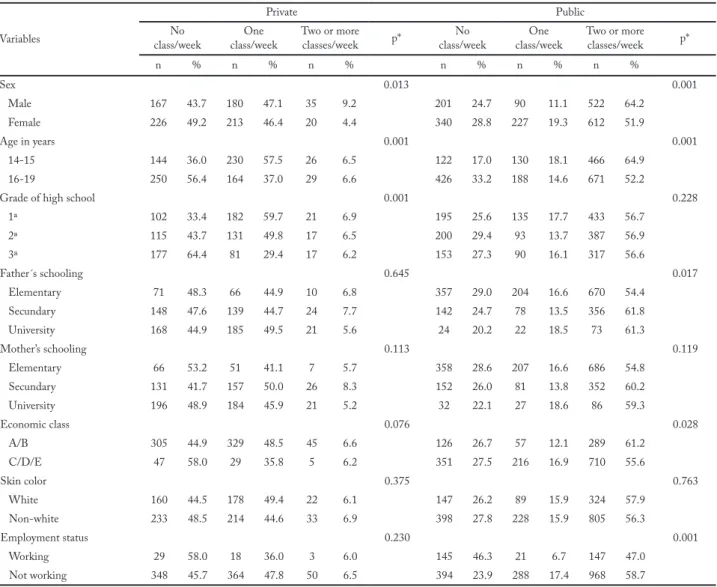
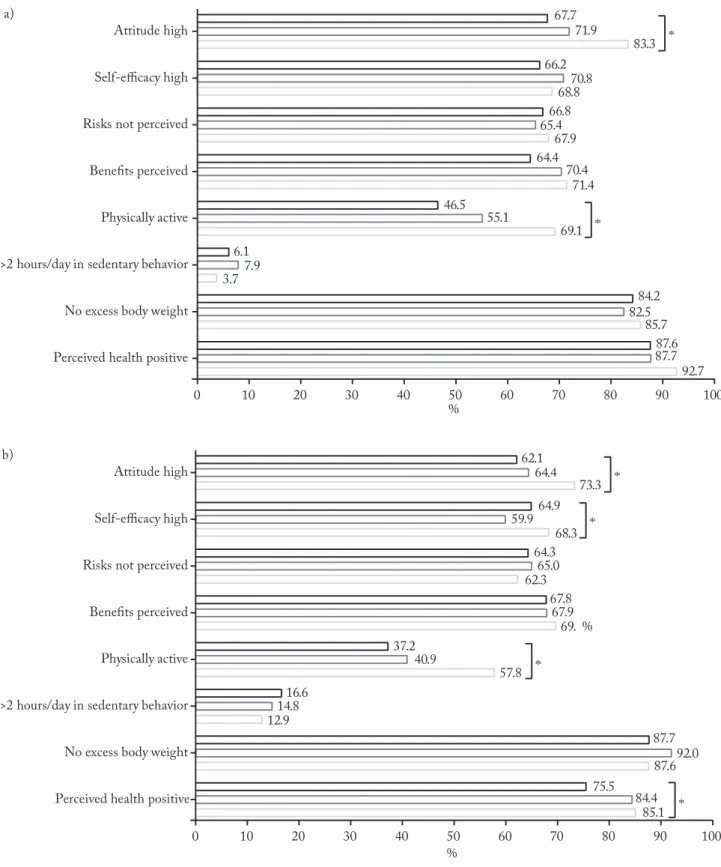
There was a higher proportion of boys attending two or more PE classes in both school systems. Higher attendance in PE classes was observed in older stu-dents (16-19 years old) and those in grades 1 and 2 of high school from private schools, and in younger students (14-15 years old), those whose parents had more schooling (high school or university), belonged to a high economic class (A/B) and did not work from public institutions (Table 2). The adolescents from both schools systems, who had the highest attitude and were physically active, and those from the public
schools who had the highest self-efficacy and positive health perception, had a higher proportion of attend-ing two or more PE classes (Figure 2).
Crude logistic regression showed a significant associa-tion between student attendance in two or more PE class-es and a positive attitude toward physical activity, higher levels of physical activity and positive health perception among students from both public and private schools.
In adjusted analyses at private schools, students that attended two or more PE classes per week reported more positive attitudes (OR = 3.07; 95%CI: 1.07 – 8.83) and being more physically active (OR = 2.69; 95%CI: 1.16 – 6.24) that those who did not. At public schools, those who attended two or more PE classes per week were more physically active (OR = 2.20; 95%CI: 1.66 – 2.91) 67% and 48% more likely to exhibit highly positive atti-tudes and positive health perception, respectively com-pared to those who attended no classes (Table 3).
Discussion
Attendance in PE classes was generally low, particu-larly at private schools, girls and older students. Those who attended these classes more frequently had more positive attitudes toward physical activity, higher levels of it and a higher positive health perception.
The prevalence of attending two or more PE class-es observed in the prclass-esent study was low (41.9%), lower compared with other studies in United States (81.6%)17 and Canada (76.8%)18, as well as studies in
Santa Catarina state (48.1%)5, Paraná state (78.9%)19
and São Paulo city (49.5)6. However, it was higher than
studies that were performed with high school students in Pernambuco state (35.154 to 37.6%)20. Data from the
2015 National Student Health Survey (PeNSE)21 of 9th
grade elementary students in 27 Brazilian state capitals found that 48.0% attended two or more PE classes per week, with the highest prevalence obtained in Santa Catarina (87.2%) and lowest in the Pará (15.9%). In João Pessoa (Paraíba), PeNSE data showed that 47.2% of students attended two or more PE classes per week, indicating that attendance tends to decline as children progress to higher grades of elementary education21.
The UNESCO report3 of a worldwide survey on PE
classes revealed a set of administrative (absence of politi-cal incentives for mandatory PE classes in school curricu-lums; lack of investment in teacher training and develop-ment), environmental (adequate class facilities, equipment and resources) and social factors (lack of strategic part-nerships with the community) as determinants for the
Table 1 – Characteristics of students sample from João Pessoa, Paraíba, Brazil, 2009 Characteristics Private (n = 850) (n = 2,024)Public (n = 2,874 )All n (%) n (%) n (%) Sex Male 384 45.3 822 40.9 1,206 42.2 Female 464 54.7 1,189 59.1 1,653 57.8 Age in years 14-15 403 47.4 725 35.8 1,128 39.3 16-19 447 52.6 1,299 64.2 1,746 60.7 Skin color White 364 43.0 566 28.1 930 32.5 Non-white 483 57.0 1,446 71.9 1,929 67.5
Grade of high school
1ª 307 36.1 773 38.2 1,080 37.6 2ª 265 31.2 688 34.0 953 33.2 3ª 278 32.7 563 27.8 841 29.2 Economic class A/B 685 89.4 476 26.9 1,161 45.8 C/D/E 81 10.6 1,291 73.1 1,372 54.2 Father´s schooling Elementary 147 17.5 1,244 64.0 1,391 50.0 Secundary 315 37.6 580 29.8 895 32.2 University 377 44.9 120 6.2 497 17.8 Mother’s schooling Elementary 125 14.8 1,266 63.3 1,391 48.9 Secundary 317 37.5 859 29.4 906 31.8 University 404 47.7 146 7.3 550 19.3 Employment status Working 50 6.1 316 15.9 366 13.1 Not working 769 93.9 1,667 84.1 2,436 86.9 Attitude High 590 70.6 1,339 68.8 1,929 69.3 Low 246 29.4 608 31.2 854 30.7 Self-efficacy High 553 68.2 1,210 66.1 1,763 66.7 Low 258 31.8 622 33.9 880 33.3 Risks Perceived 279 33.9 691 36.7 970 35.8 Not perceived 545 66.1 1,192 63.3 1,737 64.2 Benefits Not perceived 266 32.4 593 31.1 859 31.5 Perceived 555 67.6 1,314 68.9 1,869 68.5 Physical activity Physically active 410 48.2 1,020 50.4 1,430 49.8 Physically inactive 440 51.8 1,004 49.6 1,444 50.2 Sedentary behavior ≤ 2 hours/day 59 7.0 283 14.3 342 12.1 > 2 hours/day 785 93.0 1,701 85.7 2,486 87.9 Nutritional status
Excess body weight 132 16.5 221 11.8 353 13.2
No excess body weight 666 83.5 1,655 88.2 2,321 86.8
Perceived health
Negative 100 12.0 349 17.5 449 15.8
nonexistence or low attendance of students in PE classes. In many cases, these classes have been character-ized by repetitive content, involving practicing basic sport principles and executing technical movements, but without a logical sequence, disconnected from the pedagogic aims of each grade, as well as from students’ needs and expectations. This could be referred to as ‘ex-ercise for the sake of it’. Aspects such as scarce of safe, accessible, well maintained facilities22, lack PE practices
for minorities and people with disabilities, absence of clear definitions regarding contents and their seriation over the course of schooling, lack of strategic part-nerships with the wider community, nonexistence of monitoring and quality control systems for PE3, large
number of requests to miss class23, lack of teacher’s
mo-tivation and empowerment, and low social and
finan-cial recognition of teachers24 are factors that may help
explain the poor attendance in PE classes in Brazil. The lower class attendance in the Northeast of the country may be due the poor conditions for engaging in sports and physical activity because of low invest-ment in facilities (gymnasiums and soccer fields) and materials (balls, cones, hoops, among others)22. Higher
attendance among public school students can be ex-plained by the fact that PE classes are optional in the vast majority of private institutions5. This is owing to
the priority given to preparing students for university entrance examinations.
As observed in other studies7,19, the attendance rate
PE classes was higher in boys. This finding can be ex-plained by the predominance of sport contents in the classes20, given that boys prefer sport activities requiring
Table 2 – Attendance in Physical Education classes among public and private high school students according sociodemographic characteris-tics, João Pessoa, Paraíba, Brazil, 2009
Variables
Private Public
No
class/week class/weekOne Two or more classes/week p* class/weekNo class/weekOne Two or more classes/week p*
n % n % n % n % n % n % Sex 0.013 0.001 Male 167 43.7 180 47.1 35 9.2 201 24.7 90 11.1 522 64.2 Female 226 49.2 213 46.4 20 4.4 340 28.8 227 19.3 612 51.9 Age in years 0.001 0.001 14-15 144 36.0 230 57.5 26 6.5 122 17.0 130 18.1 466 64.9 16-19 250 56.4 164 37.0 29 6.6 426 33.2 188 14.6 671 52.2
Grade of high school 0.001 0.228
1ª 102 33.4 182 59.7 21 6.9 195 25.6 135 17.7 433 56.7 2ª 115 43.7 131 49.8 17 6.5 200 29.4 93 13.7 387 56.9 3ª 177 64.4 81 29.4 17 6.2 153 27.3 90 16.1 317 56.6 Father´s schooling 0.645 0.017 Elementary 71 48.3 66 44.9 10 6.8 357 29.0 204 16.6 670 54.4 Secundary 148 47.6 139 44.7 24 7.7 142 24.7 78 13.5 356 61.8 University 168 44.9 185 49.5 21 5.6 24 20.2 22 18.5 73 61.3 Mother’s schooling 0.113 0.119 Elementary 66 53.2 51 41.1 7 5.7 358 28.6 207 16.6 686 54.8 Secundary 131 41.7 157 50.0 26 8.3 152 26.0 81 13.8 352 60.2 University 196 48.9 184 45.9 21 5.2 32 22.1 27 18.6 86 59.3 Economic class 0.076 0.028 A/B 305 44.9 329 48.5 45 6.6 126 26.7 57 12.1 289 61.2 C/D/E 47 58.0 29 35.8 5 6.2 351 27.5 216 16.9 710 55.6 Skin color 0.375 0.763 White 160 44.5 178 49.4 22 6.1 147 26.2 89 15.9 324 57.9 Non-white 233 48.5 214 44.6 33 6.9 398 27.8 228 15.9 805 56.3 Employment status 0.230 0.001 Working 29 58.0 18 36.0 3 6.0 145 46.3 21 6.7 147 47.0 Not working 348 45.7 364 47.8 50 6.5 394 23.9 288 17.4 968 58.7
physical strength and competitiveness, while girls would
rather take part in physical activities involving emotion- al and social skills, characteristics scarcely investigated in PE classes25. Since the classes are given during class
Figure 2 – Attendance in Physical Education classes among private (a) and public (b) high school students according physical activity corre-lates, physical activity level, sedentary behavior, nutritional status and perceived health status, João Pessoa, Paraíba, Brazil, 2009
time, some of the girls may not participate for esthetic reasons, assuming that perspiring during these activities will ruin/mess up their hair and make-up.
As with Feitosa et al.20, who studied high school
students from Caruaru, Pernambuco state, the present investigation found a significant reduction in PE class attendance as students progressed to higher secondary school grades. This behavior may be related to the fact that at most schools, attending these classes is not a priority and the time that could be spent on this disci-pline is used to prepare students for university entrance examinations. As a result, expectations regarding PE are a matter of secondary importance.
In the present study, public students whose parents had a higher schooling level and better economic class (Class A/B) attended more PE classes. Parents who be-long to higher socioeconomic strata could better afford to enroll their children in well-structured schools, pro-vide more social support for engaging in physical activi-ty26, and encourage them to participate more in physical
activities, especially at school7. Taken together, these
factors lead to greater student attendance in PE classes.
It was found that students who reported higher at-tendance in PE classes were more likely to follow rec-ommendations regarding physical activities, reinforcing the findings of earlier studies4,13. Adolescents who are
more physically active outside the school setting may be more interested in attending PE classes because they feel more able to engage in physical activities (great-er p(great-erceived self-efficacy), and value their importance (more favorable attitudes toward engaging in physical activities)7,10. However, PE classes may represent an
important part of weekly physical activities. In some cases, it may be the primary or only opportunity for students to participate in regular physical activity27.
Students who attended more PE classes were like-ly to have more favorable attitudes toward engaging in physical activity. Some studies suggest that great-er attendance in PE classes is directly associated with positive attitudes toward physical activity1,28. One
ex-planation for this result is that students who attend PE classes have higher levels of knowledge of and interest in physical activity, leading to more positive attitudes10.
Public students who attended more PE classes were
Table 3 – Binary logistic regression analyses to crude and adjusted association between attendance in Physical Education classes and physical activity correlates, physical activity level, sedentary behavior, nutritional status and perceived health status in students from João Pessoa, Paraíba, Brazil, 2009
Frequency of attendance in PE classes
Attitude Self-efficacy Risks Benefits activity levelPhysical Sedentary behavior Nutritional status health statusPerceived OR
(95% CI) (95% CI)OR (95% CI)OR (95% CI)OR (95% CI)OR (95% CI)OR (95% CI)OR (95% CI)OR Private schools
Crude analyses
One class/week 1.22
(0.90 – 1.66) (0.91 – 1.68)1.24 (0.69 – 1.26)0.94 (0.97 – 1.78)1.31 (1.07 – 1.87)1.41 (0.76 – 1.63)1.11 (0.60 – 1.30)0.88 (0.66 – 1.55)1.01 Two or more class/week 2.39
(1.13 – 5.03) (0.59 – 2.09)1.12 (0.57 – 1.94)1.05 (0.72 – 2.65)1.38 (1.41 – 4.72)2.58 (0.29 – 1.73)0.71 (0.48 – 2.63)1.13 (0.63 – 5.23)1.81 Adjusted analyses*
One class/week 1.14
(0.76 – 1.71) (0.71 – 1.51)1. 03 (0.75 – 1.57)1.85 (0.92 – 2.00)1.36 (0.94 – 1.91)1.34 (0.79 – 1.92)1.23 (0.47 – 1.24)0.77 (0.56 – 1.62)0.95 Two or more class/week 3.07
(1.07 – 8.83) (0.49 – 2.64)1.14 (0.66 – 3.08)1.42 (0.53 – 2.70)1.20 (1.16 – 6.24)2.69 (0.21 – 1.89)0.62 (0.39 – 2.85)1.06 (0.29 – 3.96)1.07 Public schools
Crude analyses
One class/week 1.10
(0.82 – 1.47) (0.60 – 1.09)0.81 (0.76 – 1.39)1.03 (0.74 – 1.36)1.00 (0.88 – 1.55)1.17 (0.76 – 1.45)1.05 (0.98 – 2.64)1.61 (1.22 – 2.52)1.75 Two or more class/week 1.67
(1.34 – 2.08) (0.93 – 1.46)1.17 (0.73 – 1.14)0.92 (0.87 – 1.36)1.09 (1.87 – 2.85)2.31 (0.65 – 1.06)0.83 (0.72 – 1.37)0.99 (1.44 – 2.40)1.86 Adjusted analyses *
One class/week 1.22
0.81 – 1.82 (0.47 – 1.00)0.69 (0.74 – 1.58)1.08 (0.64 – 1.43)0.96 (0.91 – 1.93)1.32 (0.58 – 1.37)0.89 (0.57 – 1.94)1.05 (1.10 – 2.90)1.79 Two or more class/week 1.23 – 2.281.67 (0.76 – 1.36)1.01 (0.80 – 1.42)1.07 (0.75 – 1.39)1.02 (1.66 – 2.91)2.20 (0.59 – 1.13)0.81 (0.53 – 1.26)0.82 (1.04 – 2.11)1.48
PE = Physical Education; Reference: no class/week; *Adjusted for sex, age, economic class, skin color, grade of high school and other depend-ents variables without model analyzed as in the dependent variables
more likely to exhibit positive perceived health com-pared to those who did not participate. Adolescents who attended more PE classes were probably the most physically active and thus displayed positive health per-ception and may have been more exposed to health-re-lated issues in PE classes. PE classes have been con-sidered important in promoting healthy eating habits, physical activity and greater perception of its benefits3.
A systematic review of intervention studies29
car-ried out in Latin America demonstrated that interven-tions to promote physical activity at school are more effective when they involve actions developed in PE classes (for example, small changes in the content taught and the use of instructional teaching resourc-es). These findings show that if high-quality classes are given, they can play an important role in promoting physical activity. Starting from the principle that PE classes are favorable to changing behavior5, this
disci-pline acts as an important educational agent for stu-dents to adopt a physically active and healthy lifestyle. The main limitations of this study include: its cross-sectional nature, precluding establishing a cause-effect relationship between attending PE classes and associated factors (attitudes toward physical activ-ity, levels of activactiv-ity, perceived health status). The fol-lowing are strengths: it considered the weekly attend-ance in PE classes, not limiting itself to dichotomous outcomes, as do the majority of studies (attend vs do not attend7,19,20); is representative of the sample of
pub-lic and private school students, since most studies have only involved the former7,19,20.
It can be concluded that high school student at-tendance in PE classes was low, particularly at private schools, girls and older students (at both public and private institutions), as well as those belonging to eco-nomic classes C, D and E (public schools). Attending two or more PE classes per week was a favorable aspect for engaging in physical activity (higher levels and more favorable attitudes) and positive health perception.
These results may help create future school-based strategies that seek to make society, authorities, direc-tors and family members aware of the importance of PE in order to improve the quality of these classes and student attendance3, mainly because it may contribute
to higher levels of physical activity, positive health per-ception and positive attitudes toward exercise.
Conflicts of interest
The authors declare no conflict of interest.
Acknowledgment
We would like to thank Coordenação de Aperfeiçoamento de Pessoal de Nível Superior (CAPES), for study and research grants.
Authors’ contributions
Prazeres Filho A, participated in the conception and writing of the manuscript, analysis and interpretation of the data. Mendonça G, Souza Neto JM, Silva ABP participated in the writing and critical analysis of the manuscript and data analysis. Tassitano RM participated in the critical review of the manuscript. Farias JC Ju-nior, participated in all stages of construction of the manuscript.
References
1. Hardman CM, Barros SSH, Andrade MLSS, Nascimento JV, Nahas MV, Barros MVG. Participation in physical education classes and indicators of attitudes toward physical activity in adolescents. Rev Bras Educ Fis Esporte. 2013;27(4):623-31.
2. BRASIL. Law n. 9394/96 of 20 December 1996. Law of guidelines and bases for national education. Brasília; 1996. [citado em 2019 ago 11]. Disponível em: https://www2. senado.leg.br/bdsf/bitstream/handle/id/70320/65.pdf.
3. UNESCO. Diretrizes em educação física de qualidade (EFQ) para gestores de políticas. UNESCO: Brasília; 2015. [citado em 2019 ago 11]. Disponível em: https:// unesdoc.unesco. org/ ark:/48223/pf0000231963.
4. Tassitano RM, Barros MV, Tenório M, Bezerra J, Florindo AA, Reis RS. Enrollment in Physical Education Is Associated With Health‐Related Behavior Among High School Students. J Sch Health. 2010;80(3):126-33.
5. Silva KS, Nahas MV, Peres KG, Lopes AS. Factors associated with physical activity, sedentary behavior, and participation in physical education among high school students in Santa Catarina State, Brazil. Cad Saude Publica. 2009;25(10):2187-200.
6. Ceschini FL, Andrade DR, Oliveira LC, Araújo Júnior JF, Matsudo VK. Prevalence of physical inactivity and associated factors among high school students from state’s public schools. J Pediatr (Rio J). 2009;85(4):301-6.
7. Coledam DHC, Ferraiol PF, Pires Junior R, Santos JW, Oliveira AR. Factors associated with participation in sports and physical education among students from Londrina, Paraná State, Brazil. Cad Saude Publica. 2014;30(3):533-45.
8. Silva RJ, Silva DA, Oliveira AC. Low Physical Activity Levels and Associated Factors in Brazilian Adolescents From Public High Schools. J Phys Act Health. 2013;11:1438-45.
9. Costa BG, Silva KS, George AM, Assis MAA. Sedentary behavior during school-time: Sociodemographic, weight status, physical education class, and school performance correlates in Brazilian schoolchildren. J Sci Med Sport. 2017;20(1):70-4.
10. Sterdt E, Liersch S, Walter U. Correlates of physical activity of children and adolescents: A systematic review of reviews. Health Educ J. 2013;73(1):72-89.
11. Brazilian Association of Research Companies - ABEP. Brazil Economic Classification Criterion. ABEP; 2009. [citado em 2019 ago 11]. Disponível em: http://www. abep.org/new/ codigos Condutas.aspx.
12. Farias Júnior JC, Lopes AS, Mota J, Santos MP, Ribeiro JC, Hallal PC. Validity and reproducibility of a physical activity questionnaire for adolescents: adapting the Self-Administered Physical Activity Checklist. Rev Bras Epidemiol. 2012;15(1):198-210.
Quote this article as:
Prazeres Filho A, Mendonça G, Souza Neto JM, Tassitano RM, Silva ABP, Farias Júnior JC. Attendance in Physical Education classes and asso-ciated factors among high school students. Rev Bras Ati Fis Saúde. 2019;24:e0083. DOI: 10.12820/rbafs.24e0083
13. World Health Organization. Global recommendations on physical activity for health. WHO; 2010. [citado em 2019 ago 11]. Disponível em: https://apps.who.int/iris/bitstream / handle/10665/44399/9789241599979_eng.pdf?s.
14. Tremblay MS, LeBlanc AG, Janssen I, Kho ME, Hicks A, Murumets K, et al. Canadian sedentary behaviour guidelines for children and youth. Appl Physiol Nutr Metab. 2011;36(1):59-64.
15. Farias Júnior JC, Lopes AS, Reis RS, Nascimento JV, Borgatto AF, Hallal PC. Development and validation of a questionnaire measuring factors associated with physical activity in adolescents. Rev Bras Saude Mater Infant. 2011;11(3):301-12.
16. Cole TJ, Bellizzi MC, Flegal KM, Dietz WH. Establishing a standard definition for child overweight and obesity worldwide: international survey. BMJ. 2000;320(7244):1240.
17. Loprinzi PD, Cardinal BJ, Cardinal MK, Corbin CB. Physical education and sport: Does participation relate to physical activity patterns, observed fitness, and personal attitudes and beliefs? Am J Health Promot. 2018;32(3):613-20.
18. Naiman DI, Leatherdale ST, Gotay C, Mâsse LC. School factors associated with the provision of physical education and levels of physical activity among elementary school students in Ontario. Can J Public Health. 2015;106(5):e290-e6.
19. Bacil E, Rech C, Hino A. Physical activity patterns among high school students of Ponta Grossa, PR. Rev Bras Ativ Fís Saúde. 2013;18(2):177-85.
20. Feitosa W, Tassitano R, Tenório M, Albuquerque A, Guimarães F, Lima Neto A. Physical education class on hifh scool in Caruaru’s state public schools: compulsory curriculim component or an optional? Rev Educ Fís/UEM. 2011;22(1):97-109.
21. BRASIL. National School of Health Survey (PeNSE) 2015. Instituto Brasileiro de Geografia e Estatística - IBGE: Rio de Janeiro; 2016. [citado em 2019 ago 11]. Disponível em: https://biblioteca.ibge.gov.br/visualizacao/livros/liv97870.pdf.
22. Tenório MCM, Tassitano RM, Lima MC. Knowing the school environment for physical education classes: is there a difference between schools? Rev Bras Ativ Fís Saúde. 2013;17(4):307-13.
23. Souza Júnior OM, Darido SC. Attendance exemption in physical education classes: Showing the way to minimize the effects of an archaic legislation. Pensar Prát. 2009;12(2):1-12.
24. Tenório MCM, Lima MCO, Tassitano RM. Motivação de Professores e Estudantes Para as Aulas de Educação Física do Ensino Médio [Doctoral dissertation]: Universidade Federal de Pernambuco, Brasil; 2014.
25. Uchoga LAR, Altmann H. Educação física escolar e relações de gênero: diferentes modos de participar e arriscar-se nos conteúdos de aula. Rev Bras Cienc Esporte. 2016;38(2):163-70.
26. Mendonça G, Farias Júnior JC. Physical activity and social support in adolescents: analysis of different types and sources of social support. J Sports Sci. 2015:1-10.
27. Dauenhauer BD, Keating XD. The influence of physical education on physical activity levels of urban elementary students. Res Q Exerc Sport. 2011;82(3):512-20.
28. Bagøien TE, Halvari H, Nesheim H. Self-determined motivation in physical education and its links to motivation for leisure-time physical activity, physical activity, and well-being in general. Percept Mot Skills. 2010;111(2):407-32.
29. Hoehner CM, Soares J, Perez DP, Ribeiro IC, Joshu CE, Pratt M, et al. Physical activity interventions in Latin America: a systematic review. Am J Prev Med. 2008;34(3):224-33.
Receipt: 24/05/2019 Approved: 09/11/2019