Rev Bras
Cineantropom
Hum
DOI: http://dx.doi.org/10.5007/1980-0037.2016v18n1p114
original article
1 Federal University of Santa Cata-rina. Graduate Program in Physical Education. Florianópolis, SC. Brazil. 2 University of Pernambuco. Gradu-ate Program in Physical Education. Research Group in Lifestyle and Health s. Recife, PE. Brazil.
Received: 18 September 2014 Accepted: 29 October 2015
Leisure-time physical activity and associated
factors among adolescents of Pernambuco,
Brazil: From 2006 to 2011
Mudanças na atividade física no lazer e fatores
associados em adolescentes de Pernambuco, Brasil:
de 2006 a 2011
Jorge Bezerra1,2
Adair da Silva Lopes1
Giovâni Firpo Del Duca1
Valter Cordeiro Barbosa Filho1
Mauro Virgilio Gomes de Barros1,2
Abstract – Leisure-time physical activity (LTPA) has important implications in promot-ing physical activity among young people. he present study aimed to analyze variations occurred in the 2006-2011 period in LTPA and associated factors among high school boys and girls in the state of Pernambuco, Northeastern Brazil. A cross-sectional school-based and statewide survey was conducted in 2006 (n = 4,207) and 2011 (n = 6,264), and samples of adolescents (14-19 years) were compared. Data were collected through a questionnaire. he practice of LTPA was obtained by the question “Do you perform regularly, some kind of physical activity in your free time?” Poisson regression was used (conidence interval (CI) 95%) in crude and adjusted analyses stratiied by gender. From 2006 to 2011, there was stability in the proportion of adolescents practicing LTPA both among boys (77.5% versus 78.9%) and girls (51.2%, versus 54.0%). he weekly frequency of physical education classes was directly associated with LTPA both in girls and boys, regardless of the survey year. Age, marital status, grade and computer use were signiicantly associated with LTPA, but there were distinctions between genders and surveys. In conclusion, there was a temporal variation between 2006 and 2011, but the reduction or increment in LTPA practice varied according to stratiication of subgroups of adolescents. In general, physical education class was a factor that remained associated with LTPA in the investigated period.
Key words: Adolescents; Brazil; Leisure activities; Motor activity; Risk behavior.
Rev Bras Cineantropom Desempenho Hum 2016, 18(1):114-126
INTRODUCTION
Regular physical activity provides many beneits to the health of adolescents both in the short and long term. Increased cardiorespiratory itness and muscle strength, weight control and reduced risk of metabolic diseases, depression symptoms and mortality rates from cardiovascular disease and diabetes are the main beneits1. Although many health problems do not manifest at early age2, current recommendations from the World Health Organization1 and Center for Disease Control and Prevention3 emphasize the need for an active lifestyle in all cycles of life, including childhood and adolescence.
In adolescence, leisure-time physical activities appear to be especially important, with positive association with attention span and inversely re-lated to the occurrence of insomnia and depression4. However, this concern with the options of activities available and choices of young people in leisure time results from the set of observational studies that showed high percent-ages of physical inactivity and preference for sedentary leisure activities in this population5. In addition, it turns out that girls show higher prevalence of sedentary leisure habits compared to boys6. In addition, the stability of physically active behaviors from adolescence to adulthood seems to be dependent on intrinsic and extrinsic factors that are more easily observed in leisure time than in other domains such as domestic tasks and work7.
Monitoring the practice of leisure-time physical activity (LTPA) occurs more frequently in high-income countries where trends observed in these contexts are diferent from those in low- and middle-income countries8 and between9. In Brazil, epidemiological surveillance of this behavior is still incipient. For example, the National Survey of Students’ Health10 includes only students from the ninth grade of elementary school of Brazilian state capitals and is not focused on LTPA. However, the assessment of changes and population subgroups most likely to reduce LTPA can contribute to the development of public actions to stimulate PA among young people, especially in leisure time, but there are few studies on time trends of physi-cal activity in young people, speciiphysi-cally addressing the leisure domain9-11, and if any, are focused on adolescent populations from the Southern and Southeastern regions of Brazil12.
METHODS
Design
his study compared data from two epidemiological, cross-sectional, school-based and statewide surveys called “Projeto Atitude”. he irst had data collection carried out from April to October 2006 and the second from May to November 2011. Both surveys were conducted in a target population of students (359,897 in 2006 and 367,813 in 2011) from state public schools of Pernambuco in the age group 14-19 years.
his limitation is justiied by the need to obtain data for this population in order to support the development of policies for public schools in the state of Pernambuco. In addition, students enrolled in public schools (668 in 2006 and 769 in 20110 represented 80.2% in 2006 and 85.6% in 2011 of the total number of high school students in the state of Pernambuco (448,653 in 2005 and 429,451 in 2010), while the rest were distributed as follows: 13.2% in 2005 and 11.2% in 2010 in private schools, 5.9% in 2005 and 1.3% in 2010 in municipal schools and 0.72% in 2005 and 1.82% in 2010 in federal schools.
All requirements regarding ethical aspects were adopted with the research protocol of survey conducted in 2006 was approved by the Ethics Committee in Research with Human Beings of the “Agamenom Magal-hães” Hospital (Recife, PE) while protocol of survey conducted in 2011 was approved by Ethics Research Committee of the University of Pernambuco (CAAE: 0158.0.097.000-10).
Planning and sample selection
he sample design including the sample size and the strategy adopted to select participants followed similar methodological procedures. However, the parameters used to establish the minimum sample size were diferent, and in 2006, a larger sample design efect value was adopted (def = 4.0 in 2006; def = 2.0 in 2011), while that in the survey conducted in 2011, lower maximum tolerable error was adopted (3% in 2006 and 2% in 2011). hese adjustments resulted in minimum sample sizes of 4,217 and 4,770 in 2006 and 2011, respectively. In 2006, the parameters and procedures adopted for sample designing are described in previous publications15, while compared to the survey conducted in 2011, these were similar to those reported by Silva et al.16.
All public schools of Pernambuco were considered eligible for the study and were arbitrarily classiied into three levels: small size (schools with less than 200 students), midsize (200-499 students) and large (≥500 students).
Rev Bras Cineantropom Desempenho Hum 2016, 18(1):114-126
hen, considering the average number of students per high school class, the number of classes that should be drawn was deined, so that it reached the minimum sample size. In 2006, to reach the sample size previously deined, 234 high school classes were randomly selected14, while in 2011 323 were randomly selected. he draw of classes was random, consider-ing the proportionality of classes per shift (day and night). All students in selected classes were invited to participate in the study, excluding those older than the target age group (14-19 years).
Instrument
Data were collected through an adapted version of the questionnaire “Global School-based Student Health Survey” proposed by the World Health Organization17. Prior to carrying out both surveys, pilot studies (test-retest after a week) were performed to test the instrument. Data for the pilot study in 2006 were collected in two public schools of Recife, with a sample of 138 adolescents aged 14-19 years (59 girls). he 2011 pilot study was conducted with 86 adolescents in the same age group in a school of the State Public Network located in the Metropolitan Region of Recife. Kappa concordance indexes ranged from 0.52 to 1.00 in 2006 and 0.63 to 0.98 in 2011. Data collection was conducted by previously trained researchers (theory and practice) and the questionnaire was applied to students in classroom, without the presence of teachers.
he practice of LTPA was assessed using the following question: Do you perform regularly some type of physical activity in your free time, like exercise, sports, dance or martial arts (yes/no). Adolescents who answered positively were considered physically active during leisure time. Demo-graphic (gender, age and marital status) and economic variables (maternal education, housing zone, occupational status, ownership of computer and geographic mesoregion) and those related to school (grade, shift and participation in physical education classes) were collected and categorized as shown in Table 1.
Data tabulation was performed using the EpiData software, version 3.1. Typing was performed in duplicate on separate data iles, which were compared (“check” function) in order to identify and correct typing errors. After cleaning data iles of 2006 and 2011, these were stored together in a single ile so that analyses proposed in this study could be performed.
Data analysis
housing zone, age and marital status). Socioeconomic variables (employment status, ownership of computer and maternal schooling) were considered at level 2. Level 3 included variables related to school (grade, school shift and physical education classes). he association of a variable with LTPA was controlled by the variables of the same level and previous hierarchical levels.
To control possible confounding factors, all variables were taken to multivariate analysis, regardless of the level of signiicance in the bivari-ate analysis and respecting their respective conceptual level. In the inal analysis, 5% signiicance level was considered to identify variables associ-ated with the outcome. In all analyses, procedures for studies with complex methodologies were adopted (sampling by conglomerates, multiple stages) incorporating to the syntax “svyset” preix, feature available in STATA. All analyses were stratiied by sex.
RESULTS
he percentage of participation in the study was 98.1% and 95.7% in 2006 and 2011, respectively. In 2006, 6,112 students in selected classes attended the school during the period of data collection and were invited to participate in the study, but 83 students refused to participate; 1,819 questionnaires were excluded from the study because students were older than 19, and the other 03 for being under 14 years. hus, the inal sam-ple was composed of 4,207 adolescents. In 2011, they 7,467 students of selected classes attended school in the data collection period, but 282 students refused to participate; 930 questionnaires were excluded because students aged above 19 years, resulting in a inal sample of 6,264 students. he inal sample was slightly lower in 2006 and higher than the sample dimension previously established in 2011. Table 1 shows the demographic and economic characteristics and those related to school of participants in both surveys.
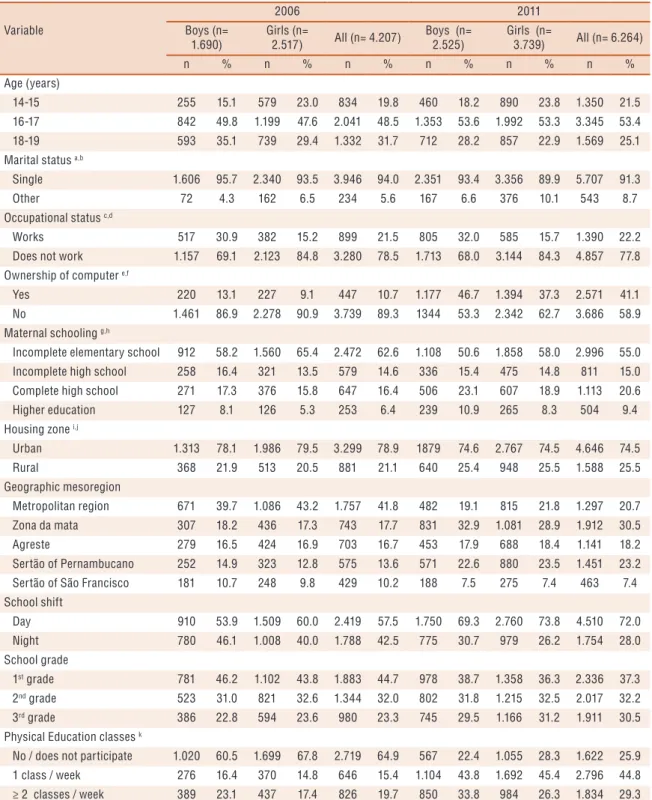
In both surveys, there was a higher proportion of single female students aged 16-17 years who reported not working and living in urban areas. It was also observed that, from 2006 to 2011, there was a rise in the propor-tion of adolescents who had computer (from 10.7% to 41.1%; p <0.001), students in the morning shift (from 57.5% to 72.0%; p <0.001) and those who participated in physical education classes (35.1% to 74.1%; p <0.001).
Rev Bras Cineantropom Desempenho Hum 2016, 18(1):114-126
Table 1. Characteristics of samples of adolescents aged 14-19 years, high school students from the public education network of Pernambuco in 2006 and 2011, by sex.
Variable
2006 2011
Boys (n= 1.690)
Girls (n=
2.517) All (n= 4.207)
Boys (n= 2.525)
Girls (n=
3.739) All (n= 6.264)
n % n % n % n % n % n %
Age (years)
14-15 255 15.1 579 23.0 834 19.8 460 18.2 890 23.8 1.350 21.5
16-17 842 49.8 1.199 47.6 2.041 48.5 1.353 53.6 1.992 53.3 3.345 53.4
18-19 593 35.1 739 29.4 1.332 31.7 712 28.2 857 22.9 1.569 25.1
Marital status a,b
Single 1.606 95.7 2.340 93.5 3.946 94.0 2.351 93.4 3.356 89.9 5.707 91.3
Other 72 4.3 162 6.5 234 5.6 167 6.6 376 10.1 543 8.7
Occupational status c,d
Works 517 30.9 382 15.2 899 21.5 805 32.0 585 15.7 1.390 22.2
Does not work 1.157 69.1 2.123 84.8 3.280 78.5 1.713 68.0 3.144 84.3 4.857 77.8
Ownership of computer e,f
Yes 220 13.1 227 9.1 447 10.7 1.177 46.7 1.394 37.3 2.571 41.1
No 1.461 86.9 2.278 90.9 3.739 89.3 1344 53.3 2.342 62.7 3.686 58.9
Maternal schooling g,h
Incomplete elementary school 912 58.2 1.560 65.4 2.472 62.6 1.108 50.6 1.858 58.0 2.996 55.0
Incomplete high school 258 16.4 321 13.5 579 14.6 336 15.4 475 14.8 811 15.0
Complete high school 271 17.3 376 15.8 647 16.4 506 23.1 607 18.9 1.113 20.6
Higher education 127 8.1 126 5.3 253 6.4 239 10.9 265 8.3 504 9.4
Housing zone i,j
Urban 1.313 78.1 1.986 79.5 3.299 78.9 1879 74.6 2.767 74.5 4.646 74.5
Rural 368 21.9 513 20.5 881 21.1 640 25.4 948 25.5 1.588 25.5
Geographic mesoregion
Metropolitan region 671 39.7 1.086 43.2 1.757 41.8 482 19.1 815 21.8 1.297 20.7
Zona da mata 307 18.2 436 17.3 743 17.7 831 32.9 1.081 28.9 1.912 30.5
Agreste 279 16.5 424 16.9 703 16.7 453 17.9 688 18.4 1.141 18.2
Sertão of Pernambucano 252 14.9 323 12.8 575 13.6 571 22.6 880 23.5 1.451 23.2
Sertão of São Francisco 181 10.7 248 9.8 429 10.2 188 7.5 275 7.4 463 7.4
School shift
Day 910 53.9 1.509 60.0 2.419 57.5 1.750 69.3 2.760 73.8 4.510 72.0
Night 780 46.1 1.008 40.0 1.788 42.5 775 30.7 979 26.2 1.754 28.0
School grade
1st grade 781 46.2 1.102 43.8 1.883 44.7 978 38.7 1.358 36.3 2.336 37.3
2nd grade 523 31.0 821 32.6 1.344 32.0 802 31.8 1.215 32.5 2.017 32.2
3rd grade 386 22.8 594 23.6 980 23.3 745 29.5 1.166 31.2 1.911 30.5
Physical Education classes k
No / does not participate 1.020 60.5 1.699 67.8 2.719 64.9 567 22.4 1.055 28.3 1.622 25.9
1 class / week 276 16.4 370 14.8 646 15.4 1.104 43.8 1.692 45.4 2.796 44.8
≥ 2 classes / week 389 23.1 437 17.4 826 19.7 850 33.8 984 26.3 1.834 29.3
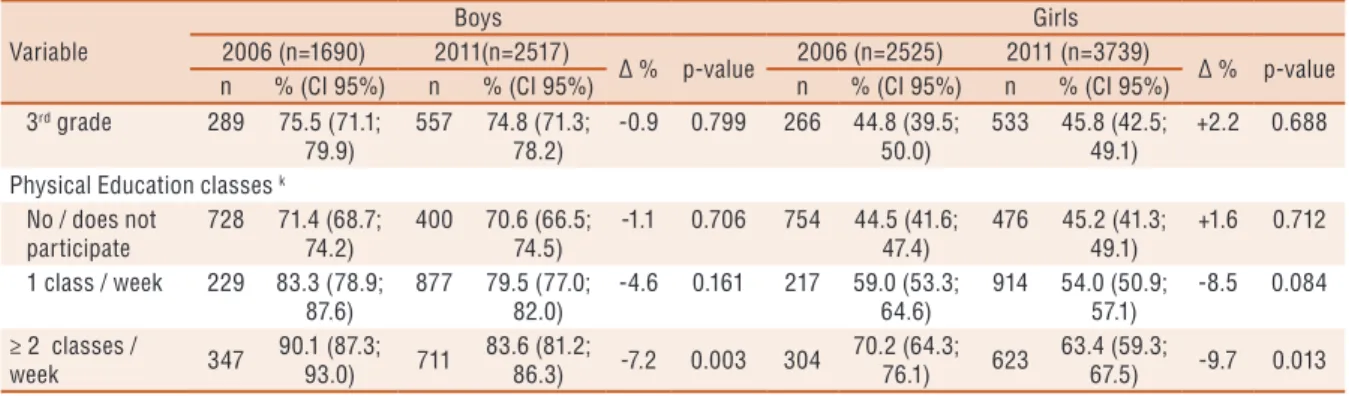
Especially among girls, the proportion of leisure-time physically active students increased from 2006 to 2011 among those not working, among those who reported not having computer, among those whose mothers have not completed elementary school, among those resident in the sertão
Table 2. Comparison of prevalence in 2006 versus 2011 of leisure-time practice of physical activity among high school students of the Pernambuco according to demographic, economic variables and those related to school, by sex.
Variable
Boys Girls
2006 (n=1690) 2011(n=2517)
∆ % p-value 2006 (n=2525) 2011 (n=3739) ∆ % p-value
n % (CI 95%) n % (CI 95%) n % (CI 95%) n % (CI 95%)
Age (years)
14-15 212 83.5 (78.8;
88.2)
378 82.4 (79.2; 85.6)
-1.3 0.707 338 58.9 (54.4; 63.4)
538 60.4 (56.0; 64.9)
+2.5 0.551
16-17 642 76.6 (73.8;
79.4)
1091 80.6 (78.4; 82.8)
+5.2 0.024 579 48.4 (45.0; 51.9)
1066 53.6 (51.0; 56.2)
+10.7 0.005
18-19 450 76.3 (72.9;
79.7)
521 73.3 (69.8; 76.7)
-3.9 0.217 363 49.6 (45.9; 53.3)
413 48.3 (44.4; 52.2 )
-2.6 0.609
Marital status a,b
Single 1242 77.7 (75.5;
80.0)
1847 78.6 (76.8; 80.4)
+1.6 0.514 1202 51.7 (49.2; 54.2)
1811 54.0 (51.8; 56.3)
+4.4 0.084
Other 55 76.4 (66.1;
86.7)
139 83.2 (77.5; 88.9)
+8.9 0.214 73 45.1 (37.7; 52.4)
200 53.2 (47.1; 59.3)
+18.0 0.084
Occupational status c,d
Works 387 75.0 (71.1;
98.9)
629 78.2 (75.4; 81.1)
+4.3 0.173 201 52.8 (47.4; 58.1)
315 53.9 (49.1; 58.8)
+2.1 0.719
Does not work 907 78.8 (76.5; 81.1)
1356 79.2 (77.2; 81.3)
+0.5 0.794 1073 50.9 (48.3; 53.4)
1695 54.0 (51.6; 56.3 )
+6.1 0.028
Ownership of computer e,f
Yes 174 79.1 (73.7;
84.5)
932 79.3 (76.7; 81.8)
+0.3 0.957 120 53.1 (46.6; 59.6)
691 49.7 (46.7; 52.7)
-6.4 0.340
No 1123 77.3 (75.0;
79.5)
1055 78.6 (76.2; 80.9)
+1.3 0.420 1153 50.9 (48.3; 53.5)
1325 56.6 (53.8; 59.4)
+11.2 <0.001
Maternal schooling g,h
Incomplete ele-ment. School
694 76.4 (73.5; 79.4)
873 78.8 (76.4; 81.2)
+3.1 0.205 786 50.7 (47.8; 53.6)
1019 54.9 (52.1; 57.8)
+8.3 0.014
Incomplete high school
199 77.4 (72.3; 82.6)
270 80.4 (76.0; 84.7)
+3.9 0.385 161 50.5 (44.6; 56.4)
242 51.0 (46.3; 55.6)
+1.0 0.895
Complete high school
218 80.7 (76.3; 85.3)
396 78.4 (74.6; 82.2)
-2.9 0.447 198 52.8 (47.4; 58.2)
315 51.9 (47.8; 56.0)
-1.7 0.783
Higher educa-tion
104 81.9 (75.1; 88.7)
200 83.7 (78.9; 88.5)
+3.5 0.663 70 56.5 (47.7; 65.2)
153 58.0 (51.7; 64.2 )
+2.7 0.780
Housing zone i,j
Urban 1026 78.4 (76.1;
80.6)
1467 78.1 (76.1; 80.1)
-0.4 0.858 997 50.5 (47.8; 53.3)
1448 52.4 (50.1; 54.7)
+3.8 0.201
Rural 270 74.2 (69.5;
78.9)
517 80.9 (77.9; 83.9)
+9.0 0.013 271 53.0 (48.3; 57.8)
556 58.7 (54.5; 62.9)
+10.8 0.037
Geographic mesoregion Metropolitan region
524 78.3 (75.1; 81.5)
374 77.6 (73.2; 81.9)
-0.9 0.767 528 49.1 (45.3; 52.8)
420 51.6 (46.1; 57.1)
+5.1 0.277
Zona da mata 234 76.7 (71.6; 81.8)
662 79.7 (76.5; 82.8)
+3.9 0.282 218 50.2 (43.9; 56.6)
576 53.3 (49.9; 56.8)
+2.1 0.274
Agreste 214 77.3 (71.6;
82.9)
355 78.5 (74.7; 82.4)
+1.6 0.684 222 52.6 (47.1; 58.1)
348 50.6 (46.0; 55.1)
-3.8 0.512
Sertão of Per-nambucano
197 78.8 (73.8; 83.4)
445 77.9 (74.5; 81.4)
-1.1 0.782 191 59.3 (52.7; 66.0)
510 58.1 (53.0; 63.1)
-2.0 0.702
Sertão of São Francisco
135 74.6 (67.9; 81.2)
154 82.4 (76.5; 88.2)
+10.5 0.070 121 48.8 (41.0; 56.7)
163 59.3 (50.8; 67.8)
+21.5 0.016
School shift
Day 713 78.8 (76.1;
81.5)
1405 80.3 (78.4; 82.3)
+1.9 0.347 785 52.2 (48.9; 55.4)
1487 53.9 (51.3; 56.6)
+3.3 0.276
Night 591 76.1 (73.0;
79.1)
585 75.6 (72.2; 78.9)
-0.7 0.825 495 49.6 (45.9; 53.3)
530 54.2 (50.3; 58.1)
+9.3 0.041
School grade
1st grade 612 78.9 (75.7;
82.1)
783 80.2 (77.7; 82.7)
+1.6 0.483 629 57.6 (54.4; 60.8)
814 60.0 (56.2; 63.7)
+4.2 0.233
2nd grade 403 77.1 (73.7;
80.4)
650 81.1 (78.1; 84.0)
+4.4 0.079 385 47.2 (43.4; 51.0)
670 55.2 (51.5; 58.9)
+16.9 <0.001
Rev Bras Cineantropom Desempenho Hum 2016, 18(1):114-126 Variable
Boys Girls
2006 (n=1690) 2011(n=2517)
∆ % p-value 2006 (n=2525) 2011 (n=3739) ∆ % p-value
n % (CI 95%) n % (CI 95%) n % (CI 95%) n % (CI 95%)
3rd grade 289 75.5 (71.1;
79.9)
557 74.8 (71.3; 78.2)
-0.9 0.799 266 44.8 (39.5; 50.0)
533 45.8 (42.5; 49.1)
+2.2 0.688
Physical Education classes k
No / does not participate
728 71.4 (68.7; 74.2)
400 70.6 (66.5; 74.5)
-1.1 0.706 754 44.5 (41.6; 47.4)
476 45.2 (41.3; 49.1)
+1.6 0.712
1 class / week 229 83.3 (78.9; 87.6)
877 79.5 (77.0; 82.0)
-4.6 0.161 217 59.0 (53.3; 64.6)
914 54.0 (50.9; 57.1)
-8.5 0.084
≥ 2 classes /
week 347
90.1 (87.3;
93.0) 711
83.6 (81.2;
86.3) -7.2 0.003 304
70.2 (64.3;
76.1) 623
63.4 (59.3;
67.5) -9.7 0.013
∆ = proportional variation
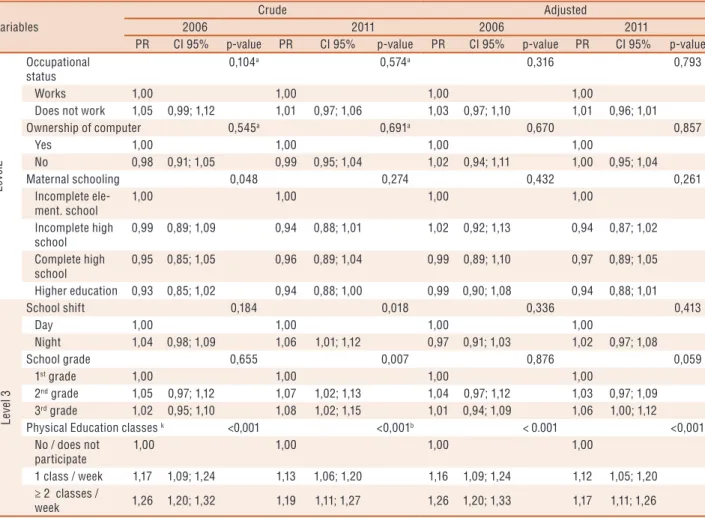
In the adjusted analysis, an inverse association between LTPA and age was found among boys in 2011 but not in 2006. here was a direct association between LTPA and participation in physical education classes both in 2006 as in 2011. After adjustments, boys who had marital status diferent from single (other) were more likely to perform LTPA. he other variables were not statistically associated with LTPA among boys (p> 0.05), both in 2006 as in 2011 (Table 3).
In analysis adjusted for girls, it was found that high grades were as-sociated with lower prevalence of LTPA practice in 2006 and 2011. he frequency of physical education classes had positive association with the practice of LTPA in both surveys. Finally, girls who had no computer were more likely to perform LTPA only in 2011. he remaining variables were not statistically associated with LTPA among women (p> 0.05), both in 2006 as in 2011 (Table 4).
Variables
Crude Adjusted
2006 2011 2006 2011
PR CI 95% p-value PR CI 95% p-value PR CI 95% p-value PR CI 95% p-value
L
ev
el 1
Geographic mesoregion 0,832b 0,639b 0,877b 0,499b
Metropolitan region
1,00 1,00 1,00 1,00
Zona da mata 0,98 0,91; 1,06 1,03 0,96; 1,10 0,99 0,92; 1,07 1,03 0,97; 1,10
Agreste 0,99 0,91; 1,07 1,01 0,94; 1,09 0,99 0,92; 1,07 1,02 0,95; 1,09
Sertão of Per-nambucano
1,01 0,93; 1,08 1,00 0,94; 1,08 1,02 0,95; 1,10 1,00 0,93; 1,07
Sertão of São Francisco
0,95 0,87; 1,04 1,06 0,97; 1,16 0,97 0,88; 1,06 1,06 0,98; 1,15
Housing zone i,j 0,114a 0,112a 0,129 0,061
Urban 1,00 1,00 1,00 1,00
Rural 0,95 0,88; 1,01 1,04 0,99; 1,08 0,95 0,89; 1,02 1,04 1,00; 1,09
Age (years) 0,048 <0,001 0,341 0,001
14-15 1,00 1,00 1,00 1,00
16-17 1,00 0,95; 1,06 1,10 1,04; 1,16 0,98 0,93; 1,04 1,09 1,03; 1,15
18-19 1,09 1,02; 1,18 1,12 1,06; 1,19 1,05 0,97; 1,13 1,11 1,03; 1,18
Marital status 0,807 0,111 0,675 0,052
Single 1,00 1,00 1,00 1,00
Other 1,02 0,89; 1,17 0,94 0,88; 1,01 1,03 0,89; 1,19 0,94 0,87; 1,00
Continues... ... continues
Variables
Crude Adjusted
2006 2011 2006 2011
PR CI 95% p-value PR CI 95% p-value PR CI 95% p-value PR CI 95% p-value
L
eve
l2
Occupational status
0,104a 0,574a 0,316 0,793
Works 1,00 1,00 1,00 1,00
Does not work 1,05 0,99; 1,12 1,01 0,97; 1,06 1,03 0,97; 1,10 1,01 0,96; 1,01
Ownership of computer 0,545a 0,691a 0,670 0,857
Yes 1,00 1,00 1,00 1,00
No 0,98 0,91; 1,05 0,99 0,95; 1,04 1,02 0,94; 1,11 1,00 0,95; 1,04
Maternal schooling 0,048 0,274 0,432 0,261
Incomplete ele-ment. school
1,00 1,00 1,00 1,00
Incomplete high school
0,99 0,89; 1,09 0,94 0,88; 1,01 1,02 0,92; 1,13 0,94 0,87; 1,02
Complete high school
0,95 0,85; 1,05 0,96 0,89; 1,04 0,99 0,89; 1,10 0,97 0,89; 1,05
Higher education 0,93 0,85; 1,02 0,94 0,88; 1,00 0,99 0,90; 1,08 0,94 0,88; 1,01
L
ev
el 3
School shift 0,184 0,018 0,336 0,413
Day 1,00 1,00 1,00 1,00
Night 1,04 0,98; 1,09 1,06 1,01; 1,12 0,97 0,91; 1,03 1,02 0,97; 1,08
School grade 0,655 0,007 0,876 0,059
1st grade 1,00 1,00 1,00 1,00
2nd grade 1,05 0,97; 1,12 1,07 1,02; 1,13 1,04 0,97; 1,12 1,03 0,97; 1,09
3rd grade 1,02 0,95; 1,10 1,08 1,02; 1,15 1,01 0,94; 1,09 1,06 1,00; 1,12
Physical Education classes k <0,001 <0,001b < 0.001 <0,001
No / does not participate
1,00 1,00 1,00 1,00
1 class / week 1,17 1,09; 1,24 1,13 1,06; 1,20 1,16 1,09; 1,24 1,12 1,05; 1,20
≥ 2 classes /
week 1,26 1,20; 1,32 1,19 1,11; 1,27 1,26 1,20; 1,33 1,17 1,11; 1,26
* n = 4207 **n = 6264; a = Wald test for linear trend; b = Wald test for heterogeneity.
Table 4. Crude and adjusted analysis of leisure-time physical activity in 2006 * and 2011 **, among high school female students of Pernambuco according to demographic, economic variables and those related to school.
Variables
Crude Adjusted
2006 2011 2006 2011
PR CI 95% p-value PR CI 95% p-value PR CI 95% p-value PR CI 95% p-value
L
ev
el 1
Geographic mesoregion 0,066 0,108 0,285 0,569
Metropolitan region
1.00 1.00 1.00 1.00
Zona da mata 1.02 0.87; 1.18 1.03 0.92; 1.17 1.04 0.90; 1.21 1.07 0.96; 1.21
Agreste 1.07 0.94; 1.22 0.98 0.86; 1.13 1.05 0.93; 1.20 1.06 0.94; 1.20
Sertão of Per-nambucano
1.21 1.06; 1.38 1.13 0.98; 1.29 1.16 1.02; 1.33 1.10 0.97; 1.25
Sertão of São Francisco
0.99 0.84; 1.17 1.15 0.97; 1.36 1.02 0.87; 1.19 1.13 0.95; 1.34
Housing zone i,j 0.350 0.004 0.713 0,244
Urban 1.00 1.00 1.00 1.00
Rural 1.05 0.95; 1.16 1.12 1.04; 1.21 1.02 0.91; 1.14 1.05 0.97; 1.14
Age (years) 0.002 <0.001 0.039 0,001
14-15 1.00 1.00 1.00 1.00
16-17 0.98 0.89; 1.08 1.11 1.02; 1.21 0.96 0.87; 1.07 1.06 0.97; 1.16
18-19 1.19 1.07; 1.32 1.25 1.12; 1.39 1.12 1.01; 1.25 1.11 0.99; 1.24
Marital status 0.104 0.794 0.258 0,858
Single 1.00 1.00 1.00 1.00
Other 1.15 0.97; 1.35 1.02 0.90; 1.14 1.10 0.93; 1.30 0.99 0.88; 1.11
... continues
Rev Bras Cineantropom Desempenho Hum 2016, 18(1):114-126 Variables
Crude Adjusted
2006 2011 2006 2011
PR CI 95% p-value PR CI 95% p-value PR CI 95% p-value PR CI 95% p-value
L
ev
el 2
Occupational status 0.503 0.992 0.595 0,652
Works 1.00 1.00 1.00 1.00
Does not work 0.96 0.87; 1.07 1.00 0.91; 1.10 0.97 0.87; 1.08 0.98 0.89; 1.07
Ownership of computer
0.524 0.001 0.804 0,001
Yes 1.00 1.00 1.00 1.00
No 0.96 0.84; 1.09 1.14 1.06; 1.23 0.98 0.86; 1.13 1.14 1.05; 1.23
Maternal schooling 0.221 0.774 0.221 0,520
Incomplete ele-ment. school
1.00 1.00 1.00 1.00
Incomplete high school
0.94 0.78; 1.12 0.90 0.80; 1.01 0.96 0.80; 1.14 0.90 0.90; 1.01
Complete high school
0.89 0.73; 1.09 0.88 0.77; 1.00 0.90 0.74; 1.10 0.88 0.77; 1.00
Higher education 0.90 0.76; 1.06 0.95 0.84; 1.06 0.91 0.77; 1.07 0.92 0.81; 1.03
L
ev
el 3
School shift 0.302 0.915 0.245 0,253
Day 1.00 1.00 1.00 1.00
Night 1.05 0.95; 1.16 1.00 0.91; 1.09 0.94 0.85; 1.04 0.95 0.87; 1.04
School grade 0.821 <0.001 0.817 0,017
1st grade 1.00 1.00 1.00 1.00
2nd grade 1.29 1.13; 1.46 1.31 1.19; 1.44 1.23 1.07; 1.42 1.22 1.11; 1.35
3rd grade 1.05 0.92; 1.21 1.21 1.09; 1.33 1.06 0.92; 1.22 1.16 1.05; 1.28
Physical Education classes k <0.001 <0.001 <0.001 <0,001
No / does not participate
1.00 1.00 1.00 1.00
1 class / week 1.33 1.19; 1.48 1.19 1.08; 1.32 1.29 1.16; 1.45 1.17 1.06; 1.28
≥ 2 classes /
week 1.58 1.42; 1.75 1.40 1.27; 1.55 1.55 1.40; 1.71 1.38 1.25; 1.52
DISCUSSION
his study was pioneer in estimating changes occurring speciically in LTPA and potential associated factors after a period of ive years, in a rep-resentative sample of adolescent students of a state in northeastern Brazil. Regarding the total sample, changes were not observed in the proportion of leisure-time physically active adolescents from 2006 to 2011.
he increase in the practice of LTPA in turn, was observed in some subgroups of adolescents students. his may be due to the reduction of social inequalities that occurred from 2006 to 2011, especially because the state of Pernambuco presented a growth rate higher than that of Brazil as a whole19. In addition, this period was also marked by expansion of some public programs to encourage the practice of physical activity speciically focused on young populations, such as the Programa Segundo Tempo20
and
Programa Saúde na Escola21.
he irst study conducted in Brazil covering time trends of physical activity in adolescent students (10-19 years) was conducted in southern Brazil24. he results were similar to those found in this study; however, the proportion of students classiied to be physically active during leisure time was very diferent between studies, being higher in this study (61.8% in 2006 versus 64.0% in 2011) than in the survey conducted by Coll et al.24, 26.3 % in 2005 versus 28.1% in 2012. he National Survey of Students’ Health from 2009 to 201210 does not bring data on time trends of PA, total or during leisure.
Compared to the indings of international studies, the results of this study were similar to those found in American students in the period from 1991 to 200725, but diferent from those observed among Catalan adoles-cents 26. Among Catalan adolescents (10-17 years) who were followed from 1993 to 2003, the prevalence of leisure time physical activity increased from 66% to 78.1% among boys and from 45% to 52.8% among girls.
he trend in the reduction of prevalence of LTPA among students for greater participation in physical education classes was found between boys and girls from Pernambuco. his inding was somehow unexpected, as results of cross-sectional studies have shown positive relationship among variables27,28, and longitudinal and intervention studies have shown that participation in physical education classes can positively inluence physical activity29.
It is noteworthy that the considerable increase in the participation of students in physical education classes in the state did not contribute, within ive years, for the increase in the practice of LTPA among adolescents. So, it could not be said that this trend began with the action of the physical education teacher at school, providing physical and sporting activities, encouraging and guiding students for a physically active and healthy life-style, which would be ideal. On the contrary, perhaps traditional physical education classes (speciic sports, practices with low motor variation)30 could be a factor that discourages leisure-time physical activity, especially among high school students. his may also be partly explained by the entry of older adolescents into the labor market and / or their withdrawal from other activities to devote exclusively to technical training courses and / or preparation for entry into the university.
he main strengths of this study are the performance of extensive ieldwork with the use of previously tested tool and with data collection in samples suiciently large for the proposed analyses. he methodological similarity of both surveys and their scope, including the participation of students of the night shift and those living in rural areas are also a strong point. he main limitation of the study was the use of a tool that only al-lows obtaining self-reported measures.
CONCLUSION
Rev Bras Cineantropom Desempenho Hum 2016, 18(1):114-126
those who participate in two or more physical education classes and in-creased among residents in rural areas. he weekly frequency of physical education classes was directly associated with the practice of LTPA among girls and boys, both in 2006 as in 2011. Age, marital status, grade and the ownership of computer were also signiicantly associated with LTPA, but with distinctions between genders and surveys.
However, it is necessary to review the strategies of physical activity programs to adapt to the diferent ages of adolescence. Changes in the structure of the physical education classes seem to be essential in the LTPA promotion among adolescents. Interventions are needed to prevent the negative impact of urbanization and technological growth in the lifestyle of young people, especially the excessive use of computer / video games during leisure time.
Acknowledgments
We would like to thank the Department of Education of the State of Per-nambuco for permission and support the performance of surveys; managers of regional oices of education, school managers, teachers who allowed using their class for data collections and to all students who participated in this study. We also thank the UPE Reprographics printing the irst survey questionnaires.
REFERENCES
1. World Health Organization. Global Recommendations on physical activity for
health. Cataloguing-in-Publication Data Global Library. Geneve. 2010. Available from: <http://www.who.int/dietphysicalactivity/publications/9789241599979/ en/>. [2013 Jun 28].
2. Flynn MAT, McNeil DA, Malof B, Mutasingwa D, Wu M, Ford C, et al.
Re-ducing obesity and related chronic disease risk in children and youth: a synthesis of evidence with ‘best practice’ recommendations. Obes Rev 2006;7(S1):7-66.
3. Centers for Disease Control and Prevention. Improving the Health of Adolescents
& Young Adults: A Guide for States and Communities. Atlanta, GA: 2004. Available from: http://nahic.ucsf.edu/wp-content/uploads/2011/11/Complete-2010Guide.pdf > [2014 Ago 28].
4. Al-Eisa E, Buragadda S, Melam G. Association between physical activity and
psychological status among Saudi female students. BMC Psychiatry 2014;14(1):238.
5. Santos M P, Gomes H, Ribeiro JC, Mota J. Variação sazonal na actividade
física e nas práticas de lazer de adolescentes portugueses. Rev Port Cien Desp 2005; 5(2):192-201.
6. Sales-Nobre FS, Jornada-Krebs R, Valentini NC. Práticas de lazer, nível de
atividade física e aptidão física de moças e rapazes brasileiros. Rev Salud Públi-ca 2009;11(5):713-23.
7. Cleland V, Dwyer T, Venn A.Which domains of childhood physical
activity pre-dict physical activity in adulthood? A 20-year prospective tracking study. Br J Sports Med 2012;46(8):595-602.
8. Hallal PC, Andersen LB, Bull FC, Guthold R, Haskell W, Ekelund U, et al.
Global physical activity levels: Surveillance progress, pitfalls, and prospects. Lancet 2012; 380(9838):247-57.
9. Hallal PC, Dumith SC, Bastos JP, Reichert FF, Siqueira FV, Azevedo MR, et
CORRESPONDING AUTHOR
Jorge Bezerra
Rua Antonio de Castro 133/1003, Casa amarela
52070-080 - Recife - PE, Brasil,
E-mail: [email protected]
10. Malta DC, Andreazzi MAR, Oliveira-Campos M, Andrade SSCA, Sá
NNB, Moura L, et al. Tendência dos fatores de risco e proteção de doenças crônicas não transmissíveis em adolescentes, pesquisa nacional de saúde do escolar (pense 2009 e 2012) Rev Bras Epidemiol, 2014; (suppl. Pense):77-91
11. Dumith SC. Physical activity in Brazil: a systematic review. Cad Saúde Pública
2009;25(Suppl. 3):415-26.
12. Barbosa Filho VC, Campos W, Lopes AS. Epidemiology of physical inactivity,
sedentary behaviors, and unhealthy eating habits among Brazilian adolescents: a systematic review. Cien Saude Coletiva 2014;19(1):173-94.
13. Farias Júnior JC, Nahas MV, Barros MVG, Loch MR, Oliveira ESA, De Bem
MFL, et al. Comportamentos de risco à saúde em adolescentes no Sul do Brasil: prevalência e fatores associados. Rev Panam Salud Publica 2009;25(4):344-52.
14. Tenório MCM, Barros MVG, Tassitano RM, Bezerra J, Tenório JM, Hallal PC.
Atividade física e comportamento sedentário em adolescentes estudantes do ensino médio. Rev Bras Epidemiol 2010;13(1):104-17.
15. Carvalho PD, Barros MVG, Santos CM, Melo EN, Oliveira NKR, Lima RA.
Prevalência e fatores associados a indicadores de saúde mental em adolescentes estudantes do ensino médio em Pernambuco, Brasil. Rev Bras Saude Matern Infant 2011;11(3):227-38.
16. Silva KS, Lopes AS, Hoefelmann LP, et al. Health risk behaviors Project
(COM-PAC) in youth of the Santa Catarina State, Brazil: ethics and methodological aspects. Rev Bras Cineantropom Desempenho Hum 2013;1(1):1-15.
17. World Health Organization. Global school-based student health survey (GSHS).
Available from: < http://www.who.int/chp/gshs/en/> [2014 Ago 28].
18. Dumith SC. Proposta de um modelo teórico para a adoção da prática de Atividade
Física, Rev Bras Ativ Física Saúde 2008;13(2):110-20
19. Governo de Pernambuco. Focos estratégicos/desenvolvimento econômico.
Avail-able from: <http://www.pe.gov.br/governo/focos-estrategicos/desenvolvimento-economico> [2014 Ago 28].
20. Brasil - Programa Segundo Tempo. Portaria Interministerial MEC/ME nº 3.497,
de 24 de novembro de 2003. Available from: <http://www2.esporte.gov.br/snelis/ segundotempo/legislacaoSegundotempo.jsp > [2014 Ago 28].
21. Brasil – Programa Saúde na Escola. Decreto Nº 6.286, de 5 de Dezembro de 2007.
(decreto de criação). Available from: <https://www.planalto.gov.br/ccivil_03/_ ato2007-2010/2007/decreto/d6286.htm [2014 Ago 28].
22. Vašíčková J, Groik D, Frömel K, Chmelík F, Wasowicz W.
Determining gen-der diferences in adolescent physical activity levels using IPAQ long form and pedometers. Ann Agric Environ Med 2013; 20(4):749-55.
23. Baquet G, Ridgers ND, Blaes A, Aucouturier J, Van Praagh E, Berthoin S.
Objectively assessed recess physical activity in girls and boys from high and low socioeconomic backgrounds. BMC Public Health 2014;14(192): 1-6.
24. Coll CVN, Knuth AG, Bastos JP, Hallal PC, Bertoldi AD. Time trends of
physi-cal activity among Brazilian adolescents over a 7-year period. J Adolesc Health 2014;54(2):209-13.
25. Li S, Treuth MS, Wang Y; How active are American adolescents and have they
become less active? Obes Rev 2010;11(12):847-62.
26. Roma–Vinãs B, Serra-Majem L, Ribas-Barba L, Roure-Cuspinera E, Cabezas
C, Vallbona C, Plasencia A. Trends in physical activity status in Catalonia, Spain (1992–2003). Public Health Nutr 2007;10(11):1389-95.
27. Cox AE, Smith AL, Lavon W. Change in physical education motivation and
physi-cal activity behavior during middle school. J Adolesc Health 2008;43(5):506-13.
28. Farias Júnior JC, Lopes AS, Mota J, Hallal PC. Prática de atividade física e
fatores associados em adolescentes no Nordeste do Brasil. Rev Saúde Pública 2012;46(3):505-15.
29. Nakamura PM, Teixeira IP, Papini CB, Lemos N, Nazario MES, Kokubun E.
Educação física escolar, atividade desportiva e atividade física total em adolescentes. Rev Bras Cineantropom Desempenho Hum 2013;15(5):517-26.
30. Kremer MM , Reichert FF, Hallal PC. Intensidade e duração dos esforços físicos