ABSTRACT:Objective: To analyze trend estimates on the prevalence of risk and protective behaviors for
chronic noncommunicable diseases in adolescents, according to data from the National School Health Survey in 2009, 2012 and 2015. Methods: Data from the three cross-sectional studies in Brazilian capitals and the Federal District were used. In total, 173,310 adolescents enrolled in the ninth grade of elementary school were interviewed, with average age of 14 years. The prevalence of indicators of protective (consumption of beans and fruit; physical education classes at school; practice of physical activity for 60 minutes or more) and risk factors (consumption of candies and soft drinks; use of cigarettes and alcohol in the last 30 days; drug testing) were estimated through linear regression. Results: There was a significant increase (p < 0.05) in the prevalence of fruit consumption and in the reduction of bean, soft drinks and candies consumption, as well as the consumption of alcoholic beverages and cigarettes. However, an increase in the prevalence of illicit drug experimentation was observed. Discussion: Despite the tendency to reduce risk factors, prevalences are high when compared with other sociocultural realities. Conclusion: The school is an important area of access to the adolescent public, and it is necessary to encourage school health promotion programs to reduce health risk behaviors, as well as to stimulate protective ones.
Keywords: Risk factors. Chronic disease. Adolescent. Public health.
Risk and protection factors for chronic
noncommunicable diseases in adolescents
in Brazilian capitals
Fatores de risco e proteção para as doenças crônicas
não transmissíveis em adolescentes nas capitais brasileiras
Maryane Oliveira-CamposI, Max Moura de OliveiraII, Simoni Urbano da SilvaI,
Maria Aline Siqueira SantosI, Laura Augusta BarufaldiI, Patricia Pereira Vasconcelos de OliveiraI, Silvânia Caribé de Araujo AndradeI, Marco Antonio Ratzsch de AndreazziIII, Lenildo de MouraIV, Deborah Carvalho MaltaV, Maria de Fátima Marinho de SouzaI
ORIGINAL ARTICLE / ARTIGO ORIGINAL
IDepartment of diseases and noncommunicable diseases surveillance and health promotion, Ministério da Saúde – Brasília (DF), Brazil. IIDepartment of Epidemiology, Faculty of Public Health, Universidade de São Paulo – São Paulo (SP), Brazil.
IIIBrazilian Institute of Geography and Statistics – Rio de Janeiro (RJ), Brazil. IVPan American Health Organization – Brasília (DF), Brazil.
VSchool of Nursing, Universidade Federal de Minas Gerais – Belo Horizonte (MG), Brazil.
Corresponding author: Laura Augusta Barufaldi. Núcleo de Avaliação de Tecnologias em Saúde (NATS)/Divisão de Pesquisa Populacional/Coordenação de Pesquisa – Instituto Nacional de Câncer (INCA). Rua Marquês de Pombal, 125, 7º andar, Centro, CEP: 20230-240. Rio de Janeiro, RJ, Brasil. E-mail: laura.barufaldi@saude.gov.br
INTRODUCTION
Non-communicable chronic diseases (NCDs) are the main cause of illness and death in Brazil and in the world. The main NCD groups are the ones of the circulatory system, chronic respiratory diseases, musculoskeletal diseases, neoplasias and diabetes1. There is
abundant evidence that integrated health promotion actions, acting on their risk factors (tobacco, alcohol, inadequate diet and physical inactivity), can reduce the burden of these diseases2. Thus, measures to promote health in the early stages of the life of children and
adolescents can impact on reducing morbidity and mortality and promote the improve-ment of the quality of life3,4.
Young people aged 10 to 24 years represent 27% of the world’s population. Their health has been largely neglected in global public health, once that this age group is often seen as healthy. However, the initiation or consolidation of risk habits for NCDs emerge at this stage, and opportunities for disease and injury prevention in this age group are not fully explored. The results of the global disease burden study suggest that investments in ado-lescent health and care would impact on less diseases, deaths and disabilities in the future5.
Most of the risk factors for NCDs begin in adolescence and can influence health in the short and long term4,5, and the school environment is an important territory for health
pro-motion, since there is a concentration of this public in these spaces. In Brazil, in 2016, about 20.3 million adolescents attended school6. Thus, in order to monitor the health of
school-children, the National School Health Survey (PeNSE) was implemented in 2009, which takes place every three years and is in its third edition.
RESUMO:Objetivo: Analisar as estimativas de tendência sobre a prevalência de comportamentos de risco e proteção para doenças crônicas não transmissíveis em adolescentes, segundo dados da Pesquisa Nacional de Saúde do Escolar em 2009, 2012 e 2015. Métodos: Foram utilizados dados dos três estudos transversais nas capitais brasileiras e no Distrito Federal. No total, entrevistaram-se 173.310 adolescentes matriculados no 9º ano do ensino fundamental, com idade média de 14 anos. Foram estimadas pelo modelo de regressão linear as prevalências dos indicadores de fatores de proteção (consumo de feijão e frutas; aulas de educação física na escola; prática de 60 minutos ou mais de atividade física) e de risco (consumo de guloseimas e refrigerantes; uso de cigarro e álcool nos últimos 30 dias; experimentação de drogas). Resultados: Houve aumento significativo (p < 0,05) da prevalência do consumo de frutas e redução de consumo de feijão, refrigerantes e guloseimas, assim como do uso de bebidas alcoólicas e cigarro, entretanto foi observado aumento na prevalência de experimentação de drogas ilícitas. Discussão: Apesar da tendência de redução em alguns fatores de risco, as prevalências encontradas são altas ao comparar com outras realidades socioculturais. Conclusão: A escola é um importante espaço de acesso ao público adolescente, e faz-se necessário estimular programas de promoção da saúde escolar para reduzir comportamentos de risco à saúde, assim como incentivar comportamentos protetores.
Most studies on health risk behavior trends among adolescents are in high-income coun-tries7,8, with few being found in Latin America9. The objective of this study was to analyze
trend estimates on the prevalence of risk and protective behaviors for NCD in adolescents.
METHODS
STUDY POPULATION, SAMPLING AND DATA COLLECTION
This is a time series study of the main risk and protection factors for NCDs among Brazilian schoolchildren, for Brazilian capitals and the Federal District, using data from the three editions of PeNSE.
The PeNSE was a study carried out with students of the ninth grade of public and pri-vate schools in the Brazilian capitals and in the Federal District for the years 2009, 2012 and 2015. The first edition was representative only of the Brazilian capitals, the second being expanded for Brazil and regions. In the 2015 sample, the results for the ninth grade were also representative for states and for the Federal District. In addition, a national sub-sample was included in 2015 to represent schoolchildren according to age (13, 14, 15, 16 and 17 years), allowing a comparison with more than 100 countries in the world that make up the Global School-Based Student Health Survey (GSHS)10. This study used data referring to
the sam-ple of ninth grade elementary students residing in Brazilian capitals, which allowed for the comparison of the results of the three editions.
Sample calculation, in all editions, considered the proportion estimate of 50% for the indicators of interest and probability of error type I or α of 0.05. The sampling plan was carried out in conglomerates with stages and selection with proportional probabilities11-13.
All students in the ninth year of elementary education, from public and private schools, present on the day of the interview were invited to participate in the research. Data col-lection occurred in the classroom. Students answered an individual questionnaire, using electronic equipment: a personal digital assistant (PDA) in 2009 and a smartphone in the following issues. The questionnaire was filled out by the adolescents, but under the super-vision of properly trained field researchers of the Brazilian Institute of Geography and Statistics (IBGE)11-13.
The three editions of the survey were approved by the National Commission for Research Ethics (CONEP), under No. 11.537/2009, 16.805/2012 and 1.006.467/2015. All students who participated in the interviews agreed to the informed consent. The details of the research methodology can be accessed in other publications11-13.
Study variables
The indicators studied and the respective questions were:
• regular bean consumption: percentage of schoolchildren who reported having consumed beans in at least five of the seven days prior to data collection. The indicator was obtained by the question: in how many of the last seven days did you eat beans?;
• regular consumption of fruits: percentage of schoolchildren who reported having consumed fruit in at least five of the seven days prior to data collection. The indicator was obtained by the question: in how many of the last seven days did you eat fresh fruit or fruit salad?;
• regular consumption of sweets: percentage of schoolchildren who reported having consumed sweets (candies, chocolate, chewing gum, or lollipops) on at least five of the seven days prior to data collection. The indicator was obtained by the question: in how many of the last seven days did you eat treats (candies, chocolates, chewing gum, or lollipops)?;
• regular consumption of soft drinks: percentage of schoolchildren who reported consuming soft drinks on at least five of the seven days prior to data collection. The indicator was obtained by the question: in how many of the last seven days did you drink soda?
2. Use of psychoactive substances:
• Current use of cigarette in the last 30 days: percentage of schoolchildren who reported having smoked at least once in the last 30 days prior to data collection, regardless of frequency and intensity. The indicator was obtained by the question: in how many of the last 30 days did you smoke cigarettes?;
• Alcohol consumption: percentage of schoolchildren who reported having consumed alcohol at least once in the last 30 days prior to data collection, regardless of frequency or intensity. The indicator was obtained by the question: in how many of the last 30 days did you have at least one glass or a dose of alcohol (one dose is equivalent to a can of beer, a glass of wine, or a dose of cachaça or whiskey etc.)?;
• Illicit drug experimentation in life: percentage of schoolchildren who reported having ever used illicit drugs. The indicator was obtained by the question: have you ever used any drugs, such as marijuana, cocaine, crack, glue, lollipop, lança-perfume, ecstasy, oxy etc.?
3. Physical activities:
• Physical education classes at school: percentage of schoolchildren who attended two or more physical education classes at school in the last seven days prior to the survey. The indicator was obtained by the question: in how many of the last seven days did you have physical education classes in school?
DATA ANALYSIS
Initially, general characteristics of the students were described for each year of the research. The prevalence and 95% confidence intervals (95%CI) of the indicators related to the risk and protection factors studied were estimated and stratified by gender and type of school and were included in the bivariate analysis with Pearson’s χ2 test for the years 2009,
2012 and 2015.
Then, age-adjusted modeling was performed using linear regression to verify trend esti-mates for each variable. A p <0.05 was considered a significant trend. The linear coefficient of the regression line determined the mean frequency variation over the period studied. Because of the change in the composition of the questions, the globally estimated physical activity indicator was presented only for the years 2012 and 2015. The analysis of the data was developed using Stata software version 12.0, using weights to correct the drawing effect of the study sample.
RESULTS
SAMPLE CHARACTERISTICS
In the three editions of the PeNSE, 173,310 students from the ninth year of public and private schools in the Brazilian capitals and the Federal District were interviewed, 60,973 in 2009, 61,145 in 2012 and 51,192 in 2015. Of the total, 51.4% are female, and the major-ity were in the 14-year-old age group, with similar percentages in all three editions of the survey. For the most part, adolescents attended public schools (75.5%), and this percentage decreased over the years (79.2% in 2009, 74.5% in 2012 and 72.9% in 2015) (data not pre-sented in table).
FOOD CONSUMPTION
For healthy food markers, the regular consumption of beans decreased from 62.6% in 2009 to 56.3% in 2015 (mean annual variation: -1.10%), and the regular consumption of fruit had a slight increase from 31.5% in 2009 to 32.8% in 2015 (mean annual varia-tion: 0.20%). A positive factor was a significant decrease in the proportion of school-children who ate unhealthy foods. Regular consumption of candies went from 50.9% in 2009 to 41.8% in 2015 (mean annual variation: -1.50%). On the other hand, regu-lar consumption of soft drinks increased from 37.2% in 2009 to 28.8% in 2015 (mean annual variation: -1.40).
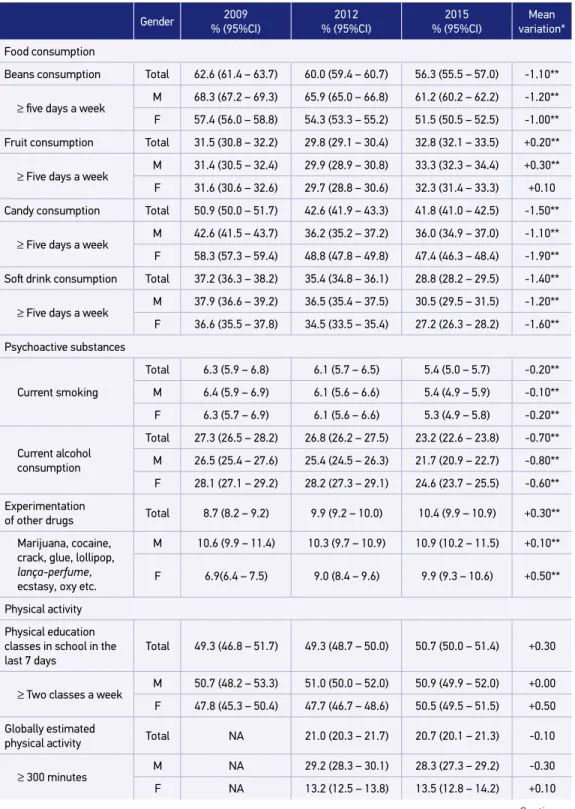
Table 1. Risk and protection factors for noncommunicable diseases in schoolchildren of the ninth grade of primary education in Brazilian capitals, according to gender and school administrative dependences. National School Health Survey 2009, 2012 and 2015.
Gender 2009
% (95%CI)
2012 % (95%CI)
2015 % (95%CI)
Mean variation*
Food consumption
Beans consumption Total 62.6 (61.4 – 63.7) 60.0 (59.4 – 60.7) 56.3 (55.5 – 57.0) -1.10**
≥ five days a week M 68.3 (67.2 – 69.3) 65.9 (65.0 – 66.8) 61.2 (60.2 – 62.2) -1.20**
F 57.4 (56.0 – 58.8) 54.3 (53.3 – 55.2) 51.5 (50.5 – 52.5) -1.00**
Fruit consumption Total 31.5 (30.8 – 32.2) 29.8 (29.1 – 30.4) 32.8 (32.1 – 33.5) +0.20**
≥ Five days a week
M 31.4 (30.5 – 32.4) 29.9 (28.9 – 30.8) 33.3 (32.3 – 34.4) +0.30**
F 31.6 (30.6 – 32.6) 29.7 (28.8 – 30.6) 32.3 (31.4 – 33.3) +0.10
Candy consumption Total 50.9 (50.0 – 51.7) 42.6 (41.9 – 43.3) 41.8 (41.0 – 42.5) -1.50**
≥ Five days a week
M 42.6 (41.5 – 43.7) 36.2 (35.2 – 37.2) 36.0 (34.9 – 37.0) -1.10**
F 58.3 (57.3 – 59.4) 48.8 (47.8 – 49.8) 47.4 (46.3 – 48.4) -1.90**
Soft drink consumption Total 37.2 (36.3 – 38.2) 35.4 (34.8 – 36.1) 28.8 (28.2 – 29.5) -1.40**
≥ Five days a week
M 37.9 (36.6 – 39.2) 36.5 (35.4 – 37.5) 30.5 (29.5 – 31.5) -1.20**
F 36.6 (35.5 – 37.8) 34.5 (33.5 – 35.4) 27.2 (26.3 – 28.2) -1.60**
Psychoactive substances
Current smoking
Total 6.3 (5.9 – 6.8) 6.1 (5.7 – 6.5) 5.4 (5.0 – 5.7) -0.20**
M 6.4 (5.9 – 6.9) 6.1 (5.6 – 6.6) 5.4 (4.9 – 5.9) -0.10**
F 6.3 (5.7 – 6.9) 6.1 (5.6 – 6.6) 5.3 (4.9 – 5.8) -0.20**
Current alcohol consumption
Total 27.3 (26.5 – 28.2) 26.8 (26.2 – 27.5) 23.2 (22.6 – 23.8) -0.70**
M 26.5 (25.4 – 27.6) 25.4 (24.5 – 26.3) 21.7 (20.9 – 22.7) -0.80**
F 28.1 (27.1 – 29.2) 28.2 (27.3 – 29.1) 24.6 (23.7 – 25.5) -0.60**
Experimentation
of other drugs Total 8.7 (8.2 – 9.2) 9.9 (9.2 – 10.0) 10.4 (9.9 – 10.9) +0.30**
Marijuana, cocaine, crack, glue, lollipop,
lança-perfume, ecstasy, oxy etc.
M 10.6 (9.9 – 11.4) 10.3 (9.7 – 10.9) 10.9 (10.2 – 11.5) +0.10**
F 6.9(6.4 – 7.5) 9.0 (8.4 – 9.6) 9.9 (9.3 – 10.6) +0.50**
Physical activity
Physical education classes in school in the last 7 days
Total 49.3 (46.8 – 51.7) 49.3 (48.7 – 50.0) 50.7 (50.0 – 51.4) +0.30
≥ Two classes a week
M 50.7 (48.2 – 53.3) 51.0 (50.0 – 52.0) 50.9 (49.9 – 52.0) +0.00
F 47.8 (45.3 – 50.4) 47.7 (46.7 – 48.6) 50.5 (49.5 – 51.5) +0.50
Globally estimated
physical activity Total NA 21.0 (20.3 – 21.7) 20.7 (20.1 – 21.3) -0.10
≥ 300 minutes M NA 29.2 (28.3 – 30.1) 28.3 (27.3 – 29.2) -0.30
F NA 13.2 (12.5 – 13.8) 13.5 (12.8 – 14.2) +0.10
Table 1. Continuation.
Gender Administrative dependences
2009 % (95%CI)
2012 % (95%CI)
2015 % (95%CI)
Mean variation*
Food consumption
Beans consumption
≥ five days a week
M Público 65,8 (64,6 – 67,0) 63,9 (63,1 – 64,6) 59,5 (58,6 – 60,3) -1,10**
F Privado 50,1 (48,2 – 52,0) 48,3 (47,3 – 49,9) 47,6 (46,3 – 48,9) -0,40**
Fruit consumption
≥ Five days a
week
M Público 31,4 (30,6 – 32,2) 29,7 (28,9 – 30,5) 33,3 (32,4 – 34,1) +0,30**
F Privado 31,8 (30,2 – 33,4) 30,0 (28,8 – 31,2) 31,7 (30,4 – 32,9) +0,00
Candy consumption
≥ Five days a
week
M Público 51,1 (50,1 – 52,1) 43,6 (42,8 – 44,4) 41,9 (41,1 – 42,8) -1,60**
F Privado 49,9 (48,5 – 51,3) 39,7 (38,5 – 41,0) 41,3 (40,0 – 42,7) -1,30**
Soft drink consumption
≥ Five days a
week
M Público 36,7 (35,7 – 37,7) 35,5 (34,7 – 36,3) 29,6 (28,7 – 30,4) -1,20**
F Privado 39,1 (36,6 – 41,6) 35,3 (34,1 – 36,5) 26,9 (25,7 – 28,2) -2,10**
Psychoactive substances
Current smoking
M Público 6,6 (6,1 – 7,1) 6,8 (6,4 – 7,2) 5,9 (5,5 – 6,4) -0,10
F Privado 5,3 (4,6 – 6,1) 4,1 (3,6 – 4,6) 3,7 (3,2 – 4,3) -0,30**
Current alcohol consumption
M Público 26,8 (25,8 – 27,8 27,7 (26,9 – 28,5) 24,2 (23,4 – 25,0) -0,40**
F Privado 29,5 (27,9 – 31,1) 24,3 (23,2 – 25,5) 20,6 (19,5 – 21,7) -1,70**
Experimentation of other drugs
Marijuana, cocaine, crack, glue, lollipop,
lança-perfume, ecstasy, oxy etc.
M Público 9,0 (8,4 – 9,6) 10,3 (9,8 – 10,8) 11,4 (10,9 – 12,0) +0,40**
F Privado 7,6 (6,7 – 8,5) 7,7 (7,0 – 8,4) 7,6 (6,9 – 8,4) -0,10
Physical activity
Physical education classes in school in the last 7 days
≥ Two classes a week
M Público 50,6 (47,9 – 53,3) 52,5 (51,6 – 53,3) 54,6 (53,7 – 55,4) +0,70**
F Privado 44,9 (38,2 – 49,9) 40,1 (38,9 – 41,3) 40,4 (39,1 – 41,7) -0,50**
Globally estimated physical activity
≥ 300 minutes M Público NA 20,3 (19,7 – 21,0) 20,7 (20,0 – 21,4) +0,20
F Privado NA 23,0 (21,9 – 24,1) 20,9 (19,8 – 22,0) -0,70**
M: male; F: female; 95%: 95% confidence interval; NA: not assessed; *mean variation in percentage points, adjusted by age; **statistically significant variations (p < 0.05); +: positive trend; -: negative trend.
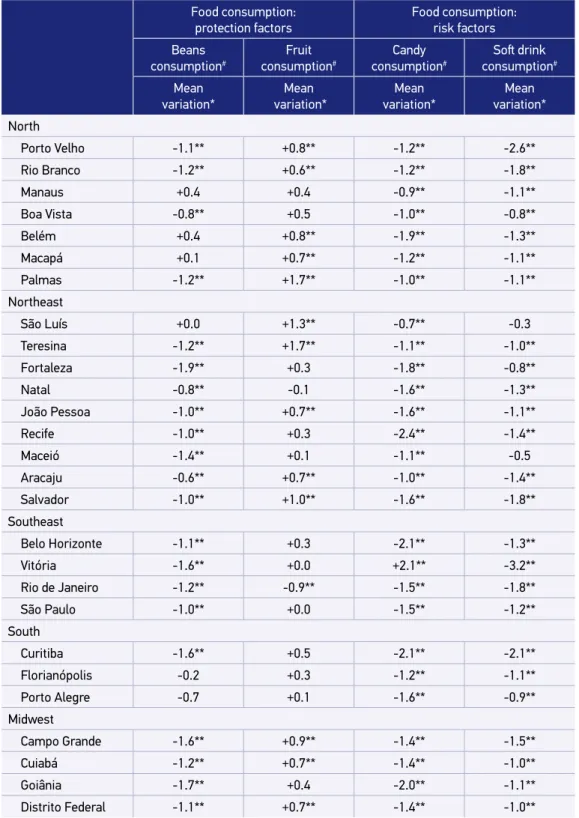
Table 2. Trend of risk and protection factors for chronic noncommunicable diseases in adolescentes in Brazilian capitals. National School Health Survey in 2009, 2012 and 2015.
Food consumption: protection factors
Food consumption: risk factors
Beans consumption#
Fruit consumption#
Candy consumption#
Soft drink
consumption#
Mean variation*
Mean variation*
Mean variation*
Mean variation*
North
Porto Velho -1.1** +0.8** -1.2** -2.6**
Rio Branco -1.2** +0.6** -1.2** -1.8**
Manaus +0.4 +0.4 -0.9** -1.1**
Boa Vista -0.8** +0.5 -1.0** -0.8**
Belém +0.4 +0.8** -1.9** -1.3**
Macapá +0.1 +0.7** -1.2** -1.1**
Palmas -1.2** +1.7** -1.0** -1.1**
Northeast
São Luís +0.0 +1.3** -0.7** -0.3
Teresina -1.2** +1.7** -1.1** -1.0**
Fortaleza -1.9** +0.3 -1.8** -0.8**
Natal -0.8** -0.1 -1.6** -1.3**
João Pessoa -1.0** +0.7** -1.6** -1.1**
Recife -1.0** +0.3 -2.4** -1.4**
Maceió -1.4** +0.1 -1.1** -0.5
Aracaju -0.6** +0.7** -1.0** -1.4**
Salvador -1.0** +1.0** -1.6** -1.8**
Southeast
Belo Horizonte -1.1** +0.3 -2.1** -1.3**
Vitória -1.6** +0.0 +2.1** -3.2**
Rio de Janeiro -1.2** -0.9** -1.5** -1.8**
São Paulo -1.0** +0.0 -1.5** -1.2**
South
Curitiba -1.6** +0.5 -2.1** -2.1**
Florianópolis -0.2 +0.3 -1.2** -1.1**
Porto Alegre -0.7 +0.1 -1.6** -0.9**
Midwest
Campo Grande -1.6** +0.9** -1.4** -1.5**
Cuiabá -1.2** +0.7** -1.4** -1.0**
Goiânia -1.7** +0.4 -2.0** -1.1**
Distrito Federal -1.1** +0.7** -1.4** -1.0**
Table 2. Continuation.
#Consumption in five or more days a week; &two or more classes a week; *mean variation in percentage points,
adjusted by age; +: positive trend; -: negative trend; **statistically significant variations (p < 0.05).
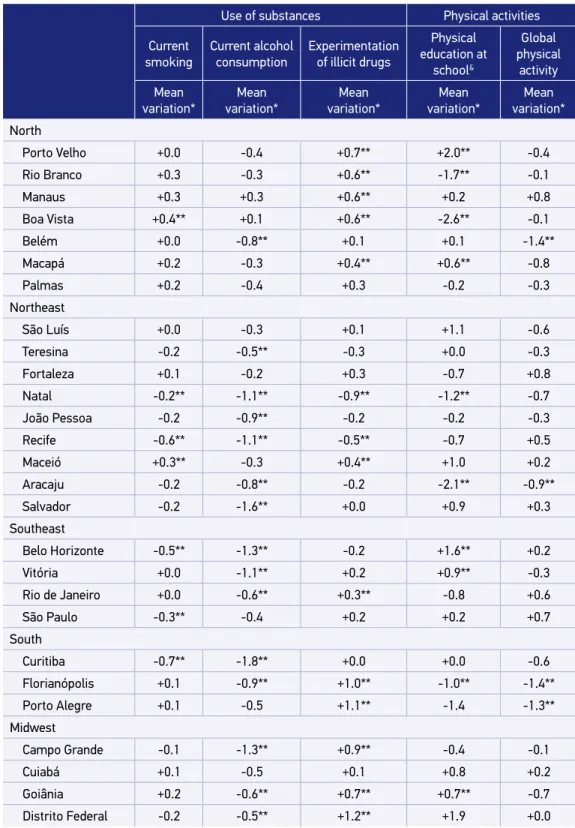
Use of substances Physical activities
Current smoking
Current alcohol consumption
Experimentation of illicit drugs
Physical education at
school&
Global physical
activity
Mean variation*
Mean variation*
Mean variation*
Mean variation*
Mean variation*
North
Porto Velho +0.0 -0.4 +0.7** +2.0** -0.4
Rio Branco +0.3 -0.3 +0.6** -1.7** -0.1
Manaus +0.3 +0.3 +0.6** +0.2 +0.8
Boa Vista +0.4** +0.1 +0.6** -2.6** -0.1
Belém +0.0 -0.8** +0.1 +0.1 -1.4**
Macapá +0.2 -0.3 +0.4** +0.6** -0.8
Palmas +0.2 -0.4 +0.3 -0.2 -0.3
Northeast
São Luís +0.0 -0.3 +0.1 +1.1 -0.6
Teresina -0.2 -0.5** -0.3 +0.0 -0.3
Fortaleza +0.1 -0.2 +0.3 -0.7 +0.8
Natal -0.2** -1.1** -0.9** -1.2** -0.7
João Pessoa -0.2 -0.9** -0.2 -0.2 -0.3
Recife -0.6** -1.1** -0.5** -0.7 +0.5
Maceió +0.3** -0.3 +0.4** +1.0 +0.2
Aracaju -0.2 -0.8** -0.2 -2.1** -0.9**
Salvador -0.2 -1.6** +0.0 +0.9 +0.3
Southeast
Belo Horizonte -0.5** -1.3** -0.2 +1.6** +0.2
Vitória +0.0 -1.1** +0.2 +0.9** -0.3
Rio de Janeiro +0.0 -0.6** +0.3** -0.8 +0.6
São Paulo -0.3** -0.4 +0.2 +0.2 +0.7
South
Curitiba -0.7** -1.8** +0.0 +0.0 -0.6
Florianópolis +0.1 -0.9** +1.0** -1.0** -1.4**
Porto Alegre +0.1 -0.5 +1.1** -1.4 -1.3**
Midwest
Campo Grande -0.1 -1.3** +0.9** -0.4 -0.1
Cuiabá +0.1 -0.5 +0.1 +0.8 +0.2
Goiânia +0.2 -0.6** +0.7** +0.7** -0.7
PSYCHOACTIVE SUSBTANCES
Regarding the use of psychoactive substances, there was a drop in the prevalence of cur-rent cigarette use, from 6.3% in 2009 to 5.4% in 2015 (mean annual variation: -0.20%), and alcohol consumption from 27.3% in 2009 to 23.2% in 2015 (mean annual variation: -0.70%), for both genders. The smoking trend among public school students and in most Brazilian capitals remained stable. With regard to alcohol consumption, there was a reduction in most Brazilian capitals, except for Manaus and Boa Vista (Tables 1 and 2).
As for experimentation on illicit drugs, there was an increase in prevalence from 8.7% in 2009 to 10.9% in 2015 (mean annual variation: +0.30%). This tendency of increase was observed among girls (mean annual variation: +0.50%) and public school students (mean annual variation: +0.40%) (Table 1). As for the capitals, there should be noted an increase in illicit drug experimentation in the capitals of the North, South and Midwest regions (Table 2).
PHYSICAL ACTIVITIES
The trend of the frequency indicators of two or more physical education classes in school and overall physical activity for the total number of students and both genders was observed. Regarding the type of school, there was an increase in the percentage of public school students who reported attending two or more physical education classes in school (mean annual change: +0.70%). However, for private school students, there was a reduction both for physical education classes and for overall estimated physical activity (mean annual variation of -0.50% and -0.70%, respectively) (Table 1). In relation to the capitals, most of them remained stable in these indicators (Table 2).
DISCUSSION
When comparing the three editions of PeNSE in the Brazilian capitals, there was a consistent reduction in the consumption of unhealthy foods, such as soft drinks and candy. With regard to healthy foods, there was a reduction in the regular consumption of beans and a slight increase in the regular intake of fruit. There was a decrease in the consumption of alcohol and cigarettes, but there was an expressive increase in the exper-imentation of illicit drugs and in the stability of the percentage of students who practice physical activities.
The consumption of food markers on five or more days of the week was high for both candies (half of the students) and soft drinks (one third of them). Regular consumption of these foods is a warning sign, since sugary treats and drinks increase the risk of over-weight and NCDs3,14. In Brazil, girls eat more sweets than boys, a pattern that has also been
There was a reduction in the regular consumption of beans among the students in the studied period. Beans are considered a healthy food, rich in fiber and protein and, with rice, plays an important role in the prevention of obesity16. Its consumption, although high in
the country, shows a decrease, according to population studies conducted in adults since 197417. There were important regional differences in bean consumption, which was lower
in the North and high in the Southeast states, similar to the one described in the System of Vigilance of Risk Factors and Protection for Chronic Diseases by Telephone Inquiry (Sistema de Vigilância de Fatores de Risco e Proteção para Doenças Crônicas por Inquérito Telefônico – Vigitel) for the adult population16. These factors can be attributed to cultural aspects and differences
in regional eating habits. In addition, they suggest that the observed changes among adults are reflected among adolescents.
There is also much evidence of the benefit of fruit and vegetable consumption in protect-ing against cardiovascular disease, cancer, among others. In the United States, an increase in the prevalence of fruit and vegetable consumption was observed between 2002 and 2010; the same happened in Brazil for adults. However, this consumption was low among ado-lescents, a result that is not different from other studies, such as the Health Behavior in School-aged Children (HSBC), in Europe, which showed 36% fruit consumption at 13 years of age and 31% at 153.
In relation to psychoactive substances, there was a reduction in alcohol and cigarette consumption and an increase in the use of illicit drugs. It should be noted, however, that the use of other tobacco products is growing, especially narghile, which should be closely mon-itored13. Tobacco is one of the most important risk factors for the onset of most NCDs, and
its use in adolescence is associated with a greater chance of using other psychoactive sub-stances, such as alcohol and illicit drugs18. Studies show that the greatest chance of tobacco
experimentation occurs in adolescence19. Therefore, preventing and delaying the initiation
of this habit is a great challenge for public health, making it a priority to develop policies for this age group20.
Brazil has always been a global reference in the fight against tobacco21. Public
poli-cies to regulate and prohibit tobacco advertising, to expand warning spaces and to create tobacco-free environments, including the prohibition of narghile, established in 201422,
are co-responsible for the low prevalence rates in this age group. However, the growth in consumption of other tobacco products, identified by PeNSE 2015, should be monitored, in order to adjust prevention actions and stop this trend.
Alcohol consumption is an important risk factor for accidents, violence, depres-sion, anxiety, bullying, as well as being a predictor of risk behavior, such as illicit drug use and unprotected sex. Their ingestion in adolescence may still predispose to use in adulthood9. In addition, there are behavioral and social factors associated with
alco-hol among adolescents, such as, for instance, lower academic performance23. In Brazil,
The use of alcohol in the country is very popular, being stimulated by the media25 and
advertisements, becoming something common both among adults and adolescents26,27.
The PeNSE identified that the states and capitals of the South Region have higher preva-lences13. The same has already been indicated in previous researches and is attributed to
cultural issues, such as the influence of European colonization27,28.
There has been an increase in drug experimentation in the country, which points out the need for preventive measures with regard to this public. An alert should also be given to much higher prevalences in the Federal District (17.8%), in the capitals of the South Region and in Goiânia, Campo Grande, Boa Vista and Porto Velho. Such data reinforce the importance of local drug prevention policies and the strengthening of family ties. Previous PeNSE studies suggest that the family consists of an important locus of prevention of psy-choactive substance use. Family supervision is a protective factor for the use of tobacco, alcohol and illicit drugs26.
The practice of physical activity is a significant factor in the protection against NCD and it influences physical and bone development and socialization in adolescents, increas-ing the chance of them becomincreas-ing more active adults29,30. Hallal et al. state that only 20% of
13- to 15-year-olds practice recommended levels of 1 hour/day of physical activity, or 300 minutes per week31. The low percentage of sufficiently active individuals in this age group
has been attributed to causes such as more time in front of the TV, in the internet, in social media, in videogames, as well as less options for active leisure, lack of adequate spaces to carry out activities in urban areas, low urban mobility, urban violence growth, little incen-tive from school to practice physical activities, among others30,32.
Only half of the students in all three surveys reported two or more physical education classes per week at school. This percentage remained stable in all PeNSE editions for boys and increased among girls. Promoting physical activity at school is an important action and results in more active students33.
In Brazil, the Strategic Action Plan for Coping with NCDs in Brazil 2011-2022 stands out as the NCD policy of choice34. Goals were defined for the control and prevention
of the main risk factors for all age groups, including school children. The Health in School Program, created in 2008, is inserted in this context and seeks to encourage pro-grams to increase physical activity, healthy eating and coping with tobacco and drugs in the school context.
Among the limits of the present investigation, this study is representative of ninth grade students of the Brazilian capitals and might not represent the entire adolescent population, especially those who are out of school. Young people in school may not be representative of all adolescents in a country, just as the prevalence and distribution of health risk behav-iors may be different between the two groups. This problem is minimized in Brazil by the wide coverage of the education system, since access to the school is of 98.2% for the popula-tion aged 6 to 14 and of 84.2% for the 15-19 age group, regardless of the monthly income35.
The PeNSE constitutes the most extensive research among students developed in the country, the result of a relevant partnership with IBGE, which makes it possible to support public policies involving the adolescent age group.
CONCLUSION
Data from the three editions of the PeNSE analyzed here indicated a significant reduc-tion in the prevalence of regular consumpreduc-tion of beans, sweets and soft drinks, and the use of alcoholic beverages and cigarettes, as well as an increase in illicit drug experimentation. The indicators related to physical activity presented stability. Despite the fall in the preva-lence of indicators related to risk factors such as alcohol and cigarette smoking, the num-bers found are high considering the population examined.
This study contributes, mainly, to the themes that should be prioritized about the health of Brazilian schoolchildren. It is necessary to encourage school health promo-tion programs to reduce such risk behaviors and encourage the adoppromo-tion of protective health behaviors.
1. Brasil. Ministério da Saúde. Secretaria de Vigilância em Saúde. Departamento de Vigilância de Doenças e Agravos não Transmissíveis e Promoção da Saúde. Saúde Brasil 2015/2016. Capítulo 5: Desigualdades regionais e de sexos na tendência da mortalidade prematura por doenças crônicas não transmissíveis no Brasil, 2000 a 2014. Brasília: Ministério da Saúde; 2016.
2. World Health Organization. From burden to “best buys”: reducing the economic impact of non-communicable diseases in low- and middle-income countries [Internet]. Genebra: World Health Organization and World Economic Forum; 2011 [citado em maio de 2017]. Disponível em: www.who.int/nmh/publications/best_buys_summary 3. Currie C, Zanotti C, Morgan A, Currie D, Looze M, Roberts C, et al. Social determinants of health and well-being among young people. Health Behaviour in School-aged Children (HBSC) study: international report from the 2009/2010 survey. Copenhagen: WHO Regional Office for Europe; 2012. (WHO Policy Series: Health Policy for Children and Adolescents, no. 6). 4. World Health Organization. Nutrition in adolescence:
issues and challenges for the health sector: issues in adolescent health and development [Internet]. Genebra; 2005 [citado em 31 jul. 2015]. Disponível em: http://apps. who.int/iris/bitstream/10665/43342/1/9241593660_ eng.pdf
5. Gore FM, Bloem DJ, Patton GC, Ferguson J, Joseph V, Coffey C, et al. Global burden of disease in young people aged 10-24 years: a systematic analysis. Lancet. 2011;377(9783):2093-102. https://doi.org/10.1016/S0140-6736(11)60512-6 6. Brasil. Ministério da Educação. Instituto Nacional
de Estudos e Pesquisas Educacionais Anísio Teixeira. Censo Escolar da Educação Básica, 2016 [Internet]. Brasil; 2017 [citado em maio de 2017]. Disponível em: http://download.inep.gov.br/educacao_basica/censo_ escolar/notas_estatisticas/2017/notas_estatisticas_ censo_escolar_da_educacao_basica_2016.pdf 7. Iannotti RJ, Wang J. Trends in physical activity, sedentary
behavior, diet, and BMI among U.S. adolescents, 2001– 2009. Pediatrics. 2013;132:606-14. https://dx.doi. org/10.1542%2Fpeds.2013-1488
8. Richter M, Pförtner TK, Lampert T, HBSC-Team Deutschland. Changes in tobacco, alcohol and cannabis use by adolescents from 2002 to 2010 in Germany. Gesundheitswesen. 2012;74:S42-8. https://doi. org/10.1055/s-0032-1314812
9. Ferrante D, Linetzky B, Ponce M, Goldberg L, Konfino J, Laspiur S. Prevalence of overweight, obesity, physical activity and tobacco use in Argentine youth: Global school-based student health survey and global youth tobacco survey, 2007–2012. Arch Argent Pediatr. 2014;112:496-503. https://doi.org/10.5546/aap.2014.496
10. Oliveira MM, Campos MO, Andreazzi MAR, Malta DC. Características da Pesquisa Nacional de Saúde do Escolar - PeNSE. Epidemiol Serv Saúde. 2017;26(3):605-16. http://dx.doi.org/10.5123/s1679-49742017000300017 11. Instituto Brasileiro de Geografia e Estatística. Pesquisa nacional de saúde escolar 2009 [Internet]. Rio de Janeiro: Instituto Brasileiro de Geografia e Estatística; 2009 [citado em maio de 2017]. Disponível em: http:// portalarquivos.saude.gov.br/images/pdf/2014/ dezembro/09/PeNSE-2009.pdf
12. Instituto Brasileiro de Geografia e Estatística. Pesquisa nacional de saúde escolar 2012 [Internet]. Rio de Janeiro: Instituto Brasileiro de Geografia e Estatística; 2012 [citado em maio de 2017]. Disponível em: http:// portalarquivos.saude.gov.br/images/pdf/2014/ dezembro/09/PeNSE-2012.pdf
13. Instituto Brasileiro de Geografia e Estatística. Pesquisa nacional de saúde escolar 2015 [Internet]. Rio de Janeiro: Instituto Brasileiro de Geografia e Estatística; 2016 [citado em maio de 2017]. Disponível em: https://biblioteca.ibge.gov.br/visualizacao/livros/ liv97870.pdf
14. World Health Organization. Global status report on noncommunicable diseases 2010 [Internet]. Genebra: World Health Organization; 2011 [citado em julho de 2017]. Disponível em: http://www.who.int/nmh/ publications/ncd_report_full_en.pdf
15. Claro RM, Santos MAS, Oliveira TP, Pereira CA, Szwarcwald CL, Malta DC. Consumo de alimentos não saudáveis relacionados a doenças crônicas não transmissíveis no Brasil: Pesquisa Nacional de Saúde, 2013. Epidemiol Serv Saúde. 2015;24(2):257-65. http:// dx.doi.org/10.5123/S1679-49742015000200008 16. Velásquez-Meléndez G, Mendes LL, Pessoa MC,
Sardinha LMV, Yokota RTC, Bernal RTI, et al. Tendências da freqüência do consumo de feijão por meio de inquérito telefônico nas capitais brasileiras, 2006 a 2009. Ciênc Saúde Coletiva. 2012;17(12):3363-70. http://dx.doi.org/10.1590/S1413-81232012001200021 17. Levy-Costa RB, Sichieri R, Pontes NS, Monteiro
CA. Disponibilidade domiciliar de alimentos no Brasil: distribuição e evolução (1974-2003). Rev Saúde Pública. 2005;39(4):530-40. http://dx.doi.org/10.1590/ S0034-89102005000400003
18. Barreto SM, Giatti L, Casado L, de Moura L, Crespo C, Malta D. Contextual factors associated with smoking among Brazilian adolescents. J Epidemiol Community Health. 2012;66(8):723-9. https://doi.org/10.1136/ jech.2010.122549
19. Brook DW, Brook JS, Zhang C, Whiteman M, Cohen P, Finch SJ. Developmental Trajectories of Cigarette Smoking from Adolescence to the Early Thirties: Personality and Behavioral Risk Factors.
Nicotine Tob Res. 2008;10(8):1283-91. https://doi. org/10.1080/14622200802238993
20. Bar reto SM, Giatti L, Oliveir a-Campos M, Andreazzi MA, Malta DC. Experimentação e uso atual de cigarro e outros produtos do tabaco entre escolares nas capitais brasileiras (PeNSE 2012). Rev Bras Epidemiol. 2014;17(1):62-76. https://doi. org/10.1590/1809-4503201400050006
21. Giovino GA, Mirza SA, Samet JM, Gupta PC, Jarvis MJ, Bhala N, et al. Tobacco use in 3 billion individuals from 16 countries: an analysis of nationally representative cross-sectional household sur veys. Lancet. 2012;380(9842):668-79. https://doi.org/10.1016/ S0140-6736(12)61085-X
22. Malta DC, Vieira ML, Szwarcwald CL, Caixeta R, Brito SMF, Reis AAC. Tendência de fumantes na população Brasileira segundo a Pesquisa Nacional de Amostra de Domicílios 2008 e a Pesquisa Nacional de Saúde 2013. Rev Bras Epidemiol. 2015;18(Suppl. 2):45-56. http://dx.doi.org/10.1590/1980-5497201500060005 23. Bosque-Prous M, Kuipers MAG, Espelt A, Richert M, Rimpelä A, Perelman J, et al. Adolescent alcohol use and parental and adolescent socioeconomic position in six European cities. BMC Public Health. 2017;17:646. https://doi.org/10.1186/s12889-017-4635-7 24. Jorge KO, Ferreira RC, Ferreira e Ferreira E, Vale
MP, Kawachi I, Zarzar PM. Binge drinking and associated factors among adolescents in a city in southeastern Brazil: a longitudinal study. Cad Saúde Pública. 2017;33(2):e00183115. http://dx.doi. org/10.1590/0102-311x00183115
25. Vendrame A, Pinsky I, Faria R, Silva R. Apreciação de propagandas de cerveja por adolescentes: relações com a exposição prévia às mesmas e o consumo de álcool. Cad Saúde Pública. 2009;25(2):359-65. http:// dx.doi.org/10.1590/S0102-311X2009000200014 26. Malta DC, Oliveira-Campos M, Prado RR, Andrade
SSC, Mello FCM, Dias AJR, et al. Uso de substâncias psicoativas, contexto familiar e saúde mental em adolescentes brasileiros, Pesquisa Nacional de Saúde dos Escolares (PeNSE 2012). Rev Bras Epidemiol. 2014;17(Suppl. 1):46-61. http://dx.doi. org/10.1590/1809-4503201400050005
27. Malta DC, Mascarenhas MDM, Porto DL, Barreto SM, Morais Neto OL. Exposição ao álcool entre escolares e fatores associados. Rev Saúde Pública. 2014;48(1):52-62. http://dx.doi.org/10.1590/S0034-8910.2014048004563 28. Coutinho ESF, França-Santos D, Magliano ES,
29. Organização Mundial de Saúde. Global strategy on diet physical activity and health. Fifty-seventh World Health Assembly [Internet]. Genebra: WHO; 2004 [citado em agosto de 2017]. Disponível em: http:// www.who.int/dietphysicalactivity/strategy/eb11344/ strategy_english_web.pdf
30. Hallal PC, Knuth AG, Cruz DKA, Mendes MI, Malta DC. Prática de atividade física em adolescentes brasileiros. Ciênc Saúde Coletiva. 2010;15(Suppl. 2):3035-42. http://dx.doi.org/10.1590/S1413-81232010000800008 31. Hallal PC, Andersen LB, Bull FC, Guthold R, Haskell W, Ekelund U. Global physical activity levels: surveillance progress, pitfalls and prospects. Lancet. 2012;380(9838):247-57. https://doi.org/10.1016/S0140-6736(12)60646-1 32. Malta DC, Silva MMA, Albuquerque GM, Lima CM, Cavalcante T, Jaime PC, et al. A implementação das prioridades da Política Nacional de Promoção da Saúde, um balanço, 2006 a 2014. Ciênc Saúde Coletiva. 2014;19(11):4301-12. http://dx.doi. org/10.1590/1413-812320141911.07732014
33. Hoehner CM, Soares J, Parra Perez D, Ribeiro IC, Joshu CE, Pratt M, et al. Physical activity interventions in Latin America: a systematic review. Am J Prev Med. 2008;34(3):224-33. https://doi.org/10.1016/j. amepre.2007.11.016
34. Brasil. Ministério da Saúde. Plano de ações estratégicas para o enfrentamento das doenças crônicas não transmissíveis (DCNT) no Brasil 2011-2022. Brasília: Ministério da Saúde; 2011.
35. Instituto Brasileiro de Geografia e Estatística. Pesquisa Nacional por Amostra de Domicílios [Internet]. Brasil: Instituto Brasileiro de Geografia e Estatística; 2012 [citado em agosto de 2017]. Disponível em: http://biblioteca.ibge.gov.br/ visualizacao/livros/liv65857.pdf
Received on: 10/31/2017
Final version presented on: 12/11/2017 Accepted on: 12/19/2017