Luís Carlos Serrachino Granadeiro
“Effects of vitamin K deficiency and its mechanisms in
vertebrate’s early development: zebrafish as a model.”
Universidade do Algarve
Departamento de Ciências Biomédicas e Medicina
Luís Carlos Serrachino Granadeiro
“Effects of vitamin K deficiency and its mechanisms in vertebrate’s early
development: zebrafish as a model.”
Mestrado em Ciências Biomédicas
Master’s Degree in Biomedical Sciences
Supervisors:
Dr. Ignacio Fernández Dr. Paulo J. Gavaia
Universidade do Algarve
Departamento de Ciências Biomédicas e Medicina
Declaro ser o autor deste trabalho, que é original e inédito. Autores e trabalhos consultados estão devidamente citados no texto e constam da listagem de referências incluída.
I declare to be the author of this work, which is original and unpublished. Authors and studies reviewed are properly cited in the text and contained in the included references list.
Copyright ©
“A Universidade do Algarve reserva para si o direito, em conformidade com o disposto no Código do Direito de Autor e dos Direitos Conexos, de arquivar, reproduzir, e publicar a obra, independentemente do meio utilizado, bem como de a divulgar através de repositórios científicos e de admitir a sua cópia e distribuição para fins meramente educacionais ou de investigação e não comerciais, conquanto seja dado o devido crédito ao
i
Agradecimentos /Acknowledgements
Em primeiro lugar gostaria de agradecer à professora Dra. Maria Leonor Cancela por me ter disponibilizado o seu laboratório, sem o qual nada poderia ter sido feito. Agradecer também a todos os elementos que fizeram ou fazem parte da equipa do Bioskel, que de alguma forma ajudaram para que este trabalho se concretizasse. Agradeço também ao Dr. Paulo Gavaia, por toda a orientação prestada durante a realização deste relatório, e por todo o apoio.
De uma forma mais especial, quero agradecer ao Dr. Ignacio Fernández, por tudo o que fez por mim, por toda a paciência, disponibilidade e conhecimentos prestados, essenciais para que esta tese progredisse com sucesso, mas em especial pelo amigo que foi durante todo este tempo. Muito obrigado Nacho!
ii
Abstract
Vitamin K (VK) acts as a cofactor of the enzyme γ-glutamyl carboxylase (Ggcx) promoting the γ-carboxylation of VK dependent proteins (VKDP), where a posttranslational conversion of Glu into Gla residues is achieved, providing calcium binding properties to VKDPs. Some VKDPs are involved in blood clotting but also in other processes. During γ-carboxylation, the reduced VK is converted to the epoxide form, which is then recycled back into VK by the enzyme VK epoxide reductase (Vkor).
Warfarin inhibits Vkor activity, being used to control blood clotting through the reduction of the γ-carboxylation of coagulation factors in patients who are at risk of venous thromboembolism. However, it might affect the activity of other VKDP. When administered during pregnancy, it induces fetal morbidity and mortality in pregnant women, being this associated with bleeding disorders and skeletal deformities. In this work the effects of VK deficiency in vertebrate’s early development were evaluated using zebrafish (Danio rerio) as a model. Zebrafish (embryos and larvae) were exposed to increasing levels of warfarin (0, 5, 25 and 125 mg L-1) during two critical periods: 0-2.5 (embryonic development) and 2.5-5 (endotrophic larvae) days post fertilization. Larvae exposed to high concentrations of warfarin showed growth retardation, bleeding, underdeveloped swimbladder, pericardial inflammation, disruption of skeletogenesis, and increased mortality. The effects were much more severe when they were exposed to the anticoagulant during the embryonic stage. Regarding skeletogenesis, mineralization of several cranial structures as well as the axial skeleton was reduced. The length of the endochodral structures in the cranial region was also shorter in warfarin exposed larvae. Expression of genes involved in skeletogenesis (sox9, runx2, osx, col2a1, grp1, alp, mgp and bgp) was affected depending on the developmental stage analyzed. Present work brings new insights on the particular mechanisms by which warfarin (and thus, VK deficiency) affects chondrogenesis and osteoblastogenesis.
Key-words: Vitamin K; warfarin; zebrafish; skeletogenesis; Warfarin Embryopathy; gene
iii
Resumo
A vitamina K (VK) é uma vitamina lipossolúvel que atua como cofator da enzima γ-glutamil carboxilase (Gccx) de forma a promover a γ-carboxilação das proteínas dependentes de VK (VKDP). Neste processo ocorre uma modificação pós-tradução que é responsável por converter os resíduos de glutamato (Glu) que estão presentes nas VKDP em resíduos γ-carboxilglutamato (Gla), que são necessários para promover a sua ligação a iões de cálcio de maneira a que estas possam desempenhar corretamente as suas funções. As VKDPs estão envolvidas na coagulação do sangue (fatores de coagulação), mas também em outros processos, entre os quais a esqueletogénese. Durante a γ-carboxilação, a forma reduzida da VK é convertida para a forma de epóxido, que é depois reciclada de volta para VK pela enzima VK epóxido redutase (Vkor), de maneira que esta possa ser novamente usada. A forma reduzida da VK tem uma elevada capacidade antioxidante e pode ligar-se ao recetor X de pregnano (Pxr). Através desta ligação a VK também tem um papel na transcrição, uma vez que o Pxr controla a transcrição de vários genes envolvidos tanto no processo de desintoxicação do organismo como na homeostasia óssea.
A Varfarina, um derivado de cumarina com baixo peso molecular é um inibidor da atividade da Vkor. Neste sentido, uma vez que a varfarina bloqueia a reciclagem de VK, esta é usada para controlar a coagulação do sangue através da redução da γ-carboxilação dos fatores de coagulação (e portanto a sua atividade) em pacientes que estão em risco de tromboembolismo venoso. A varfarina está associada a diversos problemas em humanos, como calcificação vascular devido à inibição da γ-carboxilação de diversas VKDP não relacionadas com a coagulação sanguínea, tais como a proteína Gla óssea (Bgp), a proteína Gla da matriz (Mgp) e a proteína rica em Gla (Grp). Vários outros anticoagulantes foram desenvolvidos e estão a ser testados clinicamente, contudo problemas associados a estes têm surgido, como é o caso do aumento do risco de infarto do miocárdio. Além disso, estes anticoagulantes não apresentam antidoto, sendo impossível reverter o seu efeito. Assim, embora a varfarina também afete a atividade de outras VKDP, continua a ser o anticoagulante mais eficaz e mais utilizado em todo o mundo. Quando administrada durante a gravidez, a varfarina tem a capacidade de atravessar a placenta induzindo morbilidade e mortalidade fetal em mulheres grávidas. A mortalidade fetal após exposição a varfarina é associada a eventos hemorrágicos e deformações esqueléticas
iv
(chondrodysplasia punctata, dismorfismo facial com hipoplasia nasal, membros curtos entre outros), sendo esta condição patológica conhecida como embriopatia da varfarina.
Ao longo dos anos vários trabalhos têm demonstrado que a VK tem um papel importante no metabolismo do osso. Vários estudos em humano reportaram um efeito positivo da VK no osso, inibindo a diminuição da densidade mineral óssea e aumentando a resistência do mesmo. Além disso, trabalhos in vitro demonstraram que a VK está envolvida na promoção do crescimento e maturação osteoblástica (transição osteoblasto-osteócito) promovendo desta forma a mineralização, mediada em parte através da γ-carboxilação de VKDP. A VK está também envolvida na diminuição da reabsorção óssea (inibição da osteoclastogénese). Através da sua ligação ao recetor nuclear PXR regula também a homeostasia óssea, promovendo o aumento expressão de marcadores ósseos. Trabalhos in vivo também reforçam o papel da VK na esqueletogénese. Estudos verificaram que a suplementação de VK na dieta de larvas de linguado estava envolvida na modelação de proteínas envolvidas em vários processos biológicos, entre os quais o desenvolvimento ósseo, promovendo uma melhoria na qualidade da formação do osso. O efeito contrário foi também demonstrado; a deficiência em VK está na origem de distúrbios no desenvolvimento do peixe-zebra, sendo que também a esqueletogénese é afetada (aumento do número de deformações).
Neste trabalho propomo-nos a avaliar os efeitos promovidos pela deficiência em VK no desenvolvimento inicial de vertebrados utilizando o peixe-zebra (Danio rerio) como modelo. O peixe-zebra é um pequeno teleósteo de água doce que tem como principais características que o tornam um bom modelo de estudo a fecundação externa, a claridade ótica durante a embriogénese, o desenvolvimento rápido e a alta taxa de reprodução. Embriões e larvas de peixe-zebra foram expostos a níveis crescentes de varfarina (0, 5, 25 e 125 mg L-1) durante dois períodos críticos do seu desenvolvimento: 0-2,5 (desenvolvimento embrionário) e 0-2,5-5 (desenvolvimento endotrófico) dias após a fertilização (dpf). Neste sentido, as larvas expostas a elevadas concentrações de varfarina (em particular a 125 mg L- 1) mostraram um atraso significativo no crescimento, eventos hemorrágicos, bexiga natatória subdesenvolvida, inflamação pericárdica, reabsorção do saco vitelino afetada e perturbação na esqueletogénese (mineralização e comprimento ósseo), levando a um aumento significativo da mortalidade. Os efeitos encontrados foram muito mais graves quando o peixe-zebra foi exposto ao anticoagulante durante a fase embrionária, sendo que estas larvas mostraram imitar a embriopatia da varfarina em
v
humanos. Quanto à esqueletogénese, verificou-se que a mineralização de várias estruturas cranianas (tais como o basioccipital, o opérculo, o cleitro, os arcos ceratohiais e o parasphenoide), bem como o esqueleto axial se encontrava reduzida. O comprimento das estruturas endocondrais na região craniana (cartilagem de Meckel, arcos ceratohiais, o primeiro arco ceratobranquial e a placa etmoide) também foi encontrado reduzido em larvas expostas a varfarina. A expressão de genes envolvidos na esqueletogénese (sox9, runx2, osx, col2a1, grp1, alp, mgp e bgp) foi também encontrada afetada, sendo que a alteração na expressão dependeu do estágio de desenvolvimento em que a análise foi feita. Enquanto aos 3 dpf as larvas expostas à varfarina mostraram uma alteração na expressão (subexpressão) em genes envolvidos na condrogénese (sox9, col2a1 e grp1), aos 5 dpf a expressão de genes envolvidos na osteoblastogénese (osx e alp) foi encontrada alterada (subexpressão). Surpreendentemente, alguns genes envolvidos tanto na condrogénese como na osteoblastogénese (runx2 e osx) foram encontrados sobre-expressos aos 16 dpf nas larvas expostas à varfarina, indicando um desenvolvimento tardio do esqueleto.
Neste sentido, o presente estudo traz novas visões em particular sobre os mecanismos pelos quais a varfarina (e portanto, a deficiência em VK) afeta tanto a condrogénese como a osteoblastogénese. Este estudo reforça também o importante papel que a VK tem no desenvolvimento inicial dos vertebrados.
Palavras-chave: vitamina K; varfarina; peixe-zebra; esqueletogénese; Embriopatia da
varfarina; expressão génica.
vi
Agradecimentos /Acknowledgements ... i
Abstract ... ii
Resumo ... iii
List of figures ... viii
List of tables ... x
Abbreviations ... xi
Chapter 1 ... 1
1. Introduction ... 2
1.1 Skeleton: functions, tissues and cell types ... 2
1.2 Bone formation and mineralization ... 3
1.3 Transcriptional control of bone formation and homeostasis ... 4
1.4 Vitamin K ... 7 1.5 Vitamin K cycle ... 8 1.6 VK deficiency ... 11 1.7 Zebrafish ... 12 Chapter 2 ... 14 2. Objectives ... 15 Chapter 3 ... 16
3. Materials and methods ... 17
3.1 Embryos rearing and fish maintenance ... 17
3.2 Compound exposure ... 18
3.3 Fish sampling ... 18
3.4 Larval performance ... 18
3.5 Skeletal development ... 18
3.6 Whole amount double staining procedure ... 19
3.7 Morphometric analysis ... 19
3.8 RNA extraction ... 20
3.9 DNAse treatment and cDNA synthesis by Reverse Transcription (RT) reaction ... 21
3.10 Gene cloning ... 21
3.10.1 Determination of the primers efficiency ... 23
3.10.2 Purified PCR product’s ligation ... 23
3.10.3 Transformation of competent bacteria ... 23
3.10.4 Screening of bacterial colonies by PCR ... 24
3.10.5 Plasmid DNA extraction, purification and sequencing ... 24
3.11 Quantitative Real-Time PCR (RT-qPCR) ... 25
vii
Chapter 4 ... 26
4. Results ... 27
4.1 Survival rate and larval performance ... 27
4.2 Zebrafish skeletogenesis ... 33 4.2.1 Cranial structures ... 33 4.2.2 Axial skeleton ... 45 4.3 Gene expression ... 47 Chapter 5 ... 50 5. Discussion ... 51 Chapter 6 ... 60 6. Conclusions ... 61 Chapter 7 ... 62 7. Future perspectives ... 63 Chapter 8 ... 64 8. References ... 65
viii
List of figures
Figure 1.1: General illustration of the endochondral ossification……….…...….…… 3
Figure 1.2: Transcriptional roles of Sox9, Runx2 and Osx in the cell-fate process by which mesenchymal cells become chondrocytes and osteoblasts………...…...….. 6
Figure 1.3: Vitamin K cycle and its metabolic and transcriptional roles………. 9 Figure 3.1: Schematic representation of zebrafish exposure to warfarin………... 14
Figure 3.2: Schematic representation of the dissected and measured cranial structures in
zebrafish larvae.……...………... 17
Figure 4.1: Cumulative mortality and endpoint survival rate of zebrafish exposed to
increased concentrations of warfarin…... 23
Figure 4.2: Standard length of larvae exposed to increased concentrations of warfarin… 25
Figure 4.3: Percentage of larvae showing hemorrhages when exposed to increased concentrations of warfarin………... 26
Figure 4.4: Percentage of larvae at 3 and 5 dph showing an opaque yolk sac when exposed
to increased concentrations of warfarin………... 27
Figure 4.5: Percentage of larvae showing pericardial inflammation when exposed to
increased concentrations of warfarin……….………... 28
Figure 4.6: Percentage of larvae with the swimbladder fully developed when exposed to
increased concentrations of warfarin……….…... 29
Figure 4.7: Percentage of zebrafish showing different mineralization degrees of the
basioccipital (bop) when exposed to increased concentrations of warfarin………….…… 30
Figure 4.8: Percentage of zebrafish showing different mineralization degree of operculum when exposed to increased concentrations of warfarin……….... 31
Figure 4.9: Percentage of zebrafish showing different mineralization degree of cleithrum when exposed to increased concentrations of warfarin………... 33
Figure 4.10: Percentage of zebrafish showing different mineralization degree of ceratohyal
arches when exposed to increased concentrations of warfarin……… 34
Figure 4.11: Percentage of zebrafish showing different mineralization degree of parasphenoid when exposed to increased concentrations of warfarin……….…… 35 Figure 4.12: Mean length of meckel’s cartilage in zebrafish exposed to increased concentrations of warfarin………... 36
Figure 4.13: Mean length of ceratohyal arches in larvae exposed to increased concentrations of warfarin………... 37
ix Figure 4.14: Mean length of the 1st ceratobranchial arch in larvae exposed to increased concentrations of warfarin………... 38
Figure 4.15: Mean width of the ethmoid plate in larvae exposed to increased concentrations of warfarin………... 39
Figure 4.16: Mean length of the ethmoid plate in larvae exposed to increased concentrations of warfarin………... 40
Figure 4.17: Mean angle of the ethmoid plate in larvae exposed to increased concentrations of warfarin…... 41
Figure 4.18: Percentage of zebrafish showing different mineralization of vertebrae when exposed to increased concentrations of warfarin... 42
Figure 4.19: Relative expression of sex determining region Y-box 9a, runt-related transcription factor 2, osxterix, collagen type 2, gla-rich protein 1 and alkaline phosphatase genes in zebrafish at 3 dpf upon exposure to warfarin during embryonic stage…... 43
Figure 4.20: Relative expression of sex determining region Y-box 9a, runt-related transcription factor 2, osxterix, collagen type 2, gla-rich protein 1and alkaline phosphatase genes in zebrafish larvae at 5 dpf upon exposure to warfarin during endotrophic stage... 44
Figure 4.21:Relative expression of runt-related transcription factor 2, osxterix, collagen type 2, matrix gla protein, bone gla protein and alkaline phosphatase in zebrafish larvae at 16 dpf upon exposure to warfarin during larval stage………. 45
x
List of tables
Table 3.1: Gene names, access numbers (GenBank), primers, primer sequences and
expected amplicon size (bp) used to perform the evaluation of the efficiency of qPCR primers and the relative gene expression quantification in zebrafish larvae exposed to warfarin during embryonic and endotrophic stages………..…...18
xi
Abbreviations
3-KDS - 3-ketodihydrosphingosine Alp - Alkaline phosphatase
Bgp - Bone gla protein Bgp1 - Bone Gla Protein 1 Bgp2 - Bone Gla Protein 2 Bop - Basioccipital
Bp - Base pairs
Cbfa1 - Core-binding factor alpha 1 CCD - Cleidocranial dysplasia CD - Campomelic dysplasia cDNA - Complementary DNA CO2 - Carbon dioxide
Col2a1 - Collagen type 2 alpha 1 Col9a2 - Collagen type 9 alpha 2 Col11a2 - Collagen type 11 alpha 2 DEPC - Diethylpyrocarbonate DNA - Deoxyribonucleic acid DNase - Deoxyribonuclease
dNTP - Nucleotide triphosphates containing deoxyribose Dpf - Days post fertilization
ECM - Extracellular matrix
EDTA - Ethylenediamine tetraacetic acid EtBr - Ethidium bromide
EtOH - Ethanol
FWS - Fetal warfarin syndrome GAGs - Glycosaminoglycans Gas6 - Growth-arrest specific 6
xii Ggcx - Γ-glutamyl carboxylase
Gla - Γ-carboxyl glutamate Glu - Glutamate Grp - Gla-rich protein Grp1 - Gla-rich protein 1 Grp2 - Gla-rich protein 2 HCl - Hydrochloric acid H2O – Water H2O2 - Hydrogen peroxide
KOH - Potassium hydroxide LB - Lysogeny broth
Mgp - Matrix gla protein MK - Menaquinone MK-4 - Menaquinone-4
M-MLV - Moloney-murine leukemia virus mRNA - Messenger RNA
NaOH - Sodium hydroxide NF-kB - Nuclear factor kappa-B NR - Nuclear receptor
O2 - Oxygen
ON - Overnight
OSE2 - Osteoblast-specific cis-acting element 2 Osx - Osterix
PBS - Phosphate Buffered Saline PCR - Polymerase chain reaction PFA - Paraformaldehyde
Pxr - Pregnane X receptor
RANK - Receptor activator of nuclear factor kβ
xiii RNA - Ribonucleic acid
RNAse - Ribonuclease RT - Room temperature
RT-qPCR - real-time quantitative polymerase chain reaction Runx1 - Runt-related transcription factor 1
Runx2 - Runt-related transcription factor 2 Runx3 - Runt-related transcription factor 3 Rxr - Retinoid X receptor
SDS - Sodium dodecyl sulfate
SOC - Super Optimal Broth with Catabolite repression Sox9 - Sex determining region Y-box 9
Sxr - Steroid and xenobiotic receptor
Sxre - Steroid and Xenobiotic Receptor responsive elements TRAP - Tartrate-resistant acid phosphatase
TF - Transcription factor
Tnap - Tissue-nonspecific alkaline phosphatase UV - Ultraviolet light
VK - Vitamin K VK1 - Vitamin K 1
VK2 - Vitamin K 2
VK3 - Vitamin K 3
VKA - Vitamin K antagonist
VKDB - Vitamin K Deficiency Bleeding VKDP - Vitamin K dependent protein VKH2 - Vitamin K hydroquinone
Vkor - Vitamin K epoxide reductase
Vkorc1 - Vitamin K epoxide reductase complex subunit 1
Vkorc1l1 - vitamin K epoxide reductase complex subunit 1-like protein 1 VKR - Vitamin K reduction
xiv WE - Warfarin Embryopathy
1
Chapter 1
2
1. Introduction
1.1 Skeleton: functions, tissues and cell types
The skeleton, formed mainly by bone and cartilage, plays important functions in the organism providing internal support and protection to vital organs. Further, together with the musculature it allows the locomotion. In mammals, bone is also a source of calcium and phosphate under specific conditions and holds the house of the hematopoietic system (reviewed in Hall, 2015).
Cartilage, unlike bone, is an avascularized and anaerobic tissue consisting of cells in an extracellular matrix (ECM; reviewed in Hall, 2015). Cartilage cells are generally the chondroblasts and the chondrocytes (cartilage forming and homeostasis), which are derived from mesenchymal stem cells, being responsible to secrete a cartilaginous ECM (Myllyharju, 2014). ECM in cartilage is composed by specific types of collagens, glycosaminoglycans (GAGs), proteoglycans and water. The major collagen is the type II, however other collagen types, such as VI, IX and XI are present. In particular hypertrophic chondrocytes are characterized by the production of type 10 collagen. Regarding to proteoglycans, aggrecan is the major component (Myllyharju, 2014).
Bone is an aerobic and vascularized tissue consisting of cells and an ECM. The main bone cell types are the osteoblasts (bone-forming cells), the osteocytes (bone homeostasis), and the osteoclasts (bone remodeling). Osteoblasts are cells derived from mesenchymal stem cells and are responsible for synthetizing the ECM. When they become trapped into ithe ECM, they are called osteocytes (Franz-Odendaal et al., 2006). Osteocytes are osteoblast-derived cells involved in bone homeostasis, regulating some bone responses to particular stimulus, such as damages and mechanical loads. Osteocytes can communicate with neighboring osteocytes and with the other cells on the bone surface via canaliculi within the bone matrix. Through this communication, osteocytes are involved in the regulation of the deposition of bone matrix, modulation of osteoclast activity, but also in the resorption of the perilacunar bone (osteocytic osteolisys; reviewed in Hall, 2015). They are by far the most abundant cellular component of bones, making up 95% of all bone cells (Franz-Odendaal et al., 2006). Interestingly, bone can be classified by the presence or absence of osteocytes in the ECM, so in this sense, bone may be cellular (osteocytic) or acellular (anosteocytic; reviewed in Hall, 2015). Finally, osteoclasts are
3
mono or multinucleated cells of hematopoietic origin responsible for bone remodeling (Witten et al., 2001; Boyle et al., 2003). The mature osteoclasts are activated by external signals like the activation of receptor activator of nuclear factor kβ (RANK) by its ligand RANKL inducing internal structural changes to prepare them for bone resorption. In this sense, rearrangements of the actin cytoskeleton and formation of a tight junction between the bone surface and basal membrane form a sealed compartment which is then acidified by the export of hydrogen ions (Boyle et al., 2003). Secretion continues with the export of the lytic enzymes Tartrate-resistant acid phosphatase (TRAP) and pro-cathepsin K into a resorption pit called as Howship’s lacunae (Boyle et al., 2003). In contrast to cartilage ECM, bone ECM is composed essentially by inorganic components (65%-70% of total ECM) such as calcium and phosphate but also by organic components (35%-30% of total ECM) such as collagen fibers (mainly type I collagen) and other non-collagenous proteins such as proteoglycans, growth factors, and other bone matrix proteins, such as bone Gla protein (Bgp), osteopontin, osteonectin and matrix Gla protein (Mgp; reviewed in Jiang et al., 2007; Hall, 2015). The first bone matrix is formed in an unmineralized state, known as osteoid, being then impregnated with hydroxyapatite to form bone (Hall, 2015).
1.2 Bone formation and mineralization
Bone can form through two different processes. In one hand, most of the mammalian skeleton is formed by endochondral ossification, which involves a cartilage intermediate.
In this process mesenchymal stem cells form condensations and differentiate into chondroblasts (Fig. 1.1A; Crombrugghe et al., 2001). Bone growth occurs through a specialized cartilaginous structure, named growth plate, where an ordered zone of proliferating and differentiating chondrocytes produce the extracellular matrix (Fig. 1.1B; Myllyharju, 2014). These chondrocytes undergoing unidirectional proliferation become hypertrophic and start to mineralize the ECM before entering in apoptosis (Fig. 1.1C; Crombrugghe et al., 2001). At the same time that chondrocyte hypertrophy occurs, some of the mesenchymal stem cells surrounding cartilage start to differentiate leading to the appearance of osteoblasts (Fig. 1.1D). These osteoblasts invade the zones of hypertrophic chondrocytes together with blood vessels and osteoclasts (Fig. 1.1E). While osteoclasts degrade the hypertrophic cartilage matrix, osteoblasts use the remnants of cartilage matrix as a scaffold for the deposition of bone matrix (Crombrugghe et al., 2001).
4
On the other hand, a small number of skeletal elements, mainly craniofacial and flat bones, are formed by intramembranous ossification. Here, bones form through mesenchymal stem cell condensations that differentiate directly into osteoblasts, without a cartilage template (Crombrugghe et al., 2001).
Figure 1.1. General illustration of the endochondral ossification process. Cells in the condensations differentiate into chondrocytes (A-B). These chondrocytes undergo unidirectional proliferation, becoming hypertrophic (C). At the same time that chondrocyte hypertrophy occurs, some of the mesenchymal cells surrounding cartilage start to differentiate into osteoblasts (D). These osteoblasts invade the zones of hypertrophic chondrocytes together with blood vessels and osteoclasts (E). Figure adapted from http://www.anatomiahumana.ucv.cl/kine1/top2.html.
1.3 Transcriptional control of bone formation and homeostasis
Early development of the skeleton is dependent on factors which have crucial roles in the cell-fate process by which mesenchymal cells become chondrocytes and osteoblasts (Fig. 1.2; reviewed in Sinha and Zhou, 2013). These are transcription factors (TF) and nuclear receptors (NR). TFs are proteins that can bind to specific DNA sequences, thereby controlling the rate of transcription of genetic information from DNA by promoting or blocking the transcription of specific genes (Latchman, 1997; Lee and Young, 2000). NRs are transcription factors that respond to signals carried by steroids, thyroid hormones and other molecules such as vitamins. Through this interaction they are able to regulate the expression of specific genes by its binding to specific DNA sequences (reviewed in Huang et al., 2010). Some TFs important in bone formation will be described (Runx2, Sox9 and Osterix) as well as NRs such as the pregnane X receptor (Pxr), a nuclear receptor involved in bone homeostasis (Azuma et al., 2010).
5
Sex determining region Y-box 9 (Sox9) is a member of the TFs Sox family, being required for testogenesis, chondrogenesis, terminal differentiation of oligodendrocytes and cardiogenesis (Mori-Akiyama et al., 2003 Akiyama, 2008). Regarding its role in chondrogenesis, Sox9 is crucial for the commitment of osteochondroprogenitors, chondrogenic mesenchymal condensation and proper chondrocyte proliferation, differentiation, maturation and hypertrophic conversion (Akiyama, 2008). During embryogenesis it is expressed in all chondroprogenitors and chondrocytes, except in the hypertrophic (Akiyama, 2008). Studies have showed that Sox9-null cells do not express chondrogenic marker genes, such as col2a1, col9a2, col11a2, and aggrecan (Akiyama, 2008). Further, mutations in one allele of Sox9 in humans result in campomelic dysplasia (CD), a skeletal dysplasia characterized by sex reversal and skeletal malformations of endochondral bones (Mori-Akiyama et al., 2003; Akiyama, 2008).
The runt-related TFs family includes Runx1, Runx2 and Runx3. These factors are essential for hematopoietic (Runx1), neuronal, gastrointestinal (Runx3) and osteochondrogenic (Runx2) differentiation (reviewed in Ziros et al., 2008). In particular Runx2, also known as core-binding factor alpha 1 (Cbfa1) is essential in the terminal differentiation of chondrocytes, a prerequisite for endochondral ossification. During osteoblast differentiation, Runx2 play essential roles in the commitment of pluripotent mesenchymal cells to the osteoblastic lineage (reviewed in Komori, 2010). There are two known isoforms of Runx2. The type I seems to be mainly involved in intramembranous bone formation (reviewed in Ziros et al., 2008). The type II isoform is exclusively involved in endochondral bone formation. Runx2 operates by binding to osteoblast-specific cis-acting element 2 (OSE2), which is found in the promoter region of all major osteoblast-related genes (reviewed in Ziros et al., 2008). Studies have demonstrated that mice with a mutated runx2 locus have a complete lack of ossification due to the maturational arrest of osteoblasts (reviewed in Ziros et al., 2008).
Like Runx2, Osterix (Osx; also known as Sp7 TF) is a major and essential effector for osteoblast differentiation, activating bone-specific genes that support bone formation (reviewed in Shina and Zhou, 2013). Mice lacking Osx die within 1 h of birth with a complete absence of intramembranous and endochondral bone formation (Baek et al., 2009).
Pxr (also known as steroid and xenobiotic receptor; SXR) is a member of the NR superfamily NR1I, it is mainly expressed in the liver and intestine where it acts as a
6
xenobiotic sensor. In fact, it plays important roles on different processes like the detoxification of the organism (drug metabolism), bone homeostasis, but also regulating metabolic pathways for the elimination of cholesterol and regulating the glucose metabolism (Timsit and Negishi, 2007). Pxr can be activated by various endogenous and dietary substances such as vitamin K (VK), pharmaceutical agents and xenobiotic compounds (Ekins et al., 2008). Recently, Wallace et al. (2013) described the 3D structure the heterodimer formed by Pxr and the retinoid X receptor (Rxr). The formed complex will bind to Sxr responsive elements (Sxre) in the promotor or enhancer regions of target genes, activating their transcription. Although expression of pxr was detected at lower levels in bone, being found in osteoblasts (Tabb et al., 2003; Azuma et al., 2010); Azuma and colleagues (2010) have demonstrated that systemic Pxr deficiency results in osteopenia. They also saw through histomorphometrical analysis of trabecular bones that bone formation parameters (bone mineral density and stiffness) were decreased in pxr knock-out compared with WT mice, suggesting Pxr loss-of-function result in suppressed osteoblastic function (Azuma et al., 2010). Pxr also affected calcium and phosphate homeostasis through the induction of vitamin D-catabolizing enzyme CYP3A4 in the liver and intestine (Zhou et al., 2006). VK2, according to Tabb et al. (2003), can have important roles in bone
development by binding to Pxr, through the regulation of the transcription of bone markers such as alp, mgp and opn. Further characterization of how VK2 induce osteoblast function through Pxr at transcriptional level of other osteoblastic genes (tsukushi, matrilin-2 and CD14 antigen) was reported by Ichikawa et al. (2006). In addition, other possible pathways by which Pxr affect bone metabolism can be the suppression of the nuclear factor kappa-B (NF-kB) signalling (Gu et al., 2006). NF-kB was reported as a promoter of osteoclastogenesis (Jimi et al., 2004) and inhibitor of bone formation by mature osteoblast (Chang et al., 2009).
7 Figure 1.2. Transcriptional roles of Sox9, Runx2 and Osx in the cell-fate process by which mesenchymal cells become chondrocytes and osteoblasts. Sox9 is crucial for the commitment of osteochondroprogenitors, chondrogenic mesenchymal condensation and proper chondrocyte proliferation, differentiation, maturation and hypertrophic conversion. Runx2 is essential for chondrocyte and osteoblast differentiation. Osx, together with Runx2, is essential for osteoblast differentiation and function. Figure modified from Karsenty, 2008.
1.4 Vitamin K
Vitamin K (VK) belongs to the group of fat-soluble vitamins, being only de novo synthesized by plants and bacteria. There are two natural metabolites, phylloquinone (VK1)
and menaquinone (VK2), and a synthetic one, menadione (VK3; Oldenburg et al., 2008).
VK1 is synthesized by plants while VK2 or menaquinones (MK) are synthesized by a
limited number of obligate and facultative anaerobic bacteria, some of which occupy the microflora of the human gut (reviewed in Shearer and Newman, 2014). The MK family contains a wide spectrum of isoprenologs being named according to the number of these prenyl units (MK-n; reviewed in Shearer and Newman, 2014). VK is predominantly present in the forms of VK1 and menaquinone-4 (MK-4), which is now known to be
synthesized in human from VK1 by the UbiA prenyltransferase containing 1 (Ubiad1)
8
VK in lower organisms has an important role as electron carrier in energy transduction pathways (Oldenburg et al., 2008). In contrast, in higher organisms, the VK family members have been studied during decades due to its important role on blood coagulation process (Oldenburg et al., 2008). In this sense VK acts as cofactor of the glutamyl carboxylase (Ggcx) enzyme, which is responsible to perform posttranslational γ-carboxylation of vitamin K dependent proteins (VKDPs). VK (reduced form VKH2) was
also recognized as having a potent antioxidant capacity (Mukai et al., 1993; Fig. 1.3).Also Li et al. (2003) had demonstrated that cell death caused by oxidative stress can be prevented in cultures of neuronal cells by VK1 and VK2 through the blockage of reactive
oxygen species (ROS) accumulation. More recently, Westhofen et al. (2011) suggested that one of the enzymes responsible for VK recycling, Vitamin K epoxide reductase complex subunit 1-like protein 1 (
Vkorc1l1)
, is responsible for VK-mediated increased survival of cells under oxidative stress limiting the amount of intracellular ROS in vitro. In addition, VK was identified as a specific ligand of Pxr (Tabb et al., 2003; Fig. 1.3). In this sense therefore, VK also have a transcriptional role, controlling different pathways through its binding to this nuclear receptor (Tabb et al., 2003).Beside the roles above described, VK is also important in sphingolipid metabolism. VK promotes the induction of 3-ketodihydrosphingosine synthase (3-KDS), the enzyme involved in the initial step of sphingolipid biosynthesis (reviewed in Ferland, 2012). Sphingolipids are a group of complex lipids present in cells, being the major components of cell membranes (reviewed in Ferland, 2012), and are viewed as crucial players of important cellular events such as proliferation, differentiation, senescence and cell–cell interaction (reviewed in Ferland, 2012).
1.5 Vitamin K cycle
In mammals, recycling of VK (Fig. 1.3) is extremely important, since VK reservoirs in the organism are low. As described before, VK plays important roles, such as acting as a cofactor to the Ggcx enzyme, which is responsible for the posttranslational modification of glutamate (Glu) to γ-carboxylglutamate (Gla) required for the activity of VKDPs, conferring them calcium binding properties (reviewed in Stafford, 2005; Oldenburg et al., 2008). The γ-carboxylation reaction requires the propeptide-containing substrate and three co-substrates: reduced VK (reduced form, VKH2), CO2 and O2. The rate of γ-carboxylation
9
is mainly controlled by the level of VKH2 available for the reactions; while the dissociation
rate constant is dependent upon both the propeptide and the Gla domain of the substrate. To promote the γ-carboxylation the subtraction of a proton from the carbon 4 of glutamate by VKH2 is required, and results in the conversion of VKH2 to VK epoxide. The epoxide
form must be recycled to VK before it can be reused, a reaction catalyzed by the enzyme vitamin K epoxide reductase (Vkor; reviewed in Stafford, 2005). In contrast to genomes of archaea, eubacteria, plants, protists, and lower animals that include a single Vkor protein, the vertebrate genomes include two paralogous enzymes, Vitamin K epoxide reductase complex subunit 1 (Vkorc1) and Vitamin K epoxide reductase complex subunit 1-like protein 1 (Vkorc1l1; Westhofen et al., 2011). Westhofen et al., (2011) suggested that both enzymes have different functions; Vkorc1 is responsible for converting the epoxide in VK, being then Vkorc1-like 1 responsible for reducing the VK to its active form (VKH2;
Westhofen et al., 2011). That author suggests that Vkorc1 is more efficient at de-epoxidation (Vkor activity), whereas Vkorc1l1 is more efficient at converting quinone to hydroquinone reduction (VKR activity; Westhofen et al., 2011). However, Hammed et al. (2013) showed recently that Vkorc1l1 is also able to support Vkor activity and can be an alternative pathway able to substitute or partially complement for loss of Vkorc1 function in various non-hepatic tissues of vkorc1knockoutmice. Thus, it seems that both enzymes are able to support Vkor and VKR activity, being responsible for de novo reduction of VK in the VK cycle (Oldenburg et al., 2015).
Although VK recycling is crucial to restore the levels of this vitamin available in organisms, it can be blocked by some anticoagulants (coumarins), which are specific inhibitors of Vkor activity and called as vitamin K antagonists (VKA; Fig. 1.3). Anticoagulant therapy is particularly recommended to prevent and treat thromboembolic conditions in patients who have prosthetic heart valves but also with history/symptoms of excessive levels of blood coagulation (How, 2004; Moyer et al., 2009). Commonly are used those comprising parenteral anticoagulants, such as unfractionated heparin, low-molecular-weight heparin or fondaparinux, but also VKA such as warfarin, acenocumarol or phenprocoumon (coumarin derivatives; Beinema et al., 2008; Gómez-Outes et al., 2009). Other anticoagulants have been recently developed, such as dabigatran, rivaroxaban, apixaban, edoxaban or betrixaban (Gómez-Outes et al., 2013). However, this new molecules are more problematic anticoagulant therapies, since in general they (specifically targeting Thrombin and FXa) have no antidote (Gómez-Outes et al., 2013). In
10
addition, other particularities have been described, such as an increase of myocardial infarction risk when patients are under Dabigatran therapy (Kohli and Cannon, 2013).
Nowadays, the most used anticoagulant is warfarin (3-(a-acetonylbenzyl)-4-hydroxycoumarin). Warfarin is a low molecular weight drug derived from coumarins being a racemic mixture of R and S enantiomers, with the S enantiomer being about three times more potent than the R enantiomer (Kamali and Wynne, 2010). Since it acts as VKA, this effect is used in oral anticoagulation treatments for thromboembolic disorders, controlling the γ-carboxylation of coagulation factors (Oldenburg et al., 2008). In this way, warfarin therapy leads to a decrease on the activity of the clotting factors II, VII, IX, and X, as well as the naturally endogenous anticoagulant proteins C and S, leading to a decrease on blood coagulation rate (Kuruvilla and Gurk-Turner, 2001). However, although warfarin treatment has been successfully used to control thromboembolic disorders, undesired side effects such as bleeding, swelling, bruising, articular pain or skin conditions have been reported as warfarin also prevents the γ-carboxylation of other VKDPs and might hamper the transcriptional activity of Pxr (Fernandez et al., 2014).
Figure 1.3. Vitamin K cycle and its metabolic and transcriptional roles. VK coming from dietary intake or glut microflora is first transformed to VKH2 (reduced form has the antioxidant capacity). In one hand VKH2
is used by the γ-glutamyl carboxylase (Ggcx) to convert glutamate into γ-carboxyl glutamate (Gla) residues in VK-dependent proteins; as a by-product VK epoxide. VK epoxide is then recycled to VK quinone by VK epoxide reductase (Vkor). VKH2 is also involved in the antioxidant activity. Warfarin is a known inhibitor of
11
the VK recycling through its binding to Vkor. At the other VK is a ligand of the nuclear receptor Pxr. The activation of Pxr by VK, promote the formation of a heterodimer with retinoid acid receptor (Rxr). Then the formed complex will bind to Sxr responsive elements (Sxre) in the promotor or enhancer regions of target genes, activating their transcription and thus proteins synthesis.
1.6 VK deficiency
During pregnancy, anticoagulant therapy is recommended to women who use prosthetic heart valves and have thromboembolic conditions but also with history/symptoms of excessive levels of blood coagulation (How, 2004). However, this is problematic because since warfarin has a low molecular weight, it can pass through the placenta inducing spontaneous abortion, stillbirth, neonatal death, and a variety of congenital anomalies known as fetal warfarin syndrome (FWS) or warfarin embryopathy (WE; How, 2004; Sathienkijkanchai and Wasant, 2005). In WE the warfarin’s teratogenic effects can occur when the fetus is exposed during either in embryonic (since fertilization until 8ª week) and fetal period (from 9ª week until the birth; Hou, 2004). However, the most critical period is between 6-9 weeks of gestation (reviewed in Sathienkijkanchai and Wasant, 2005). The effects comprise a wide range of manifestations such as dysmorphology in neonate with chondrodysplasia punctata (nasal hypoplasia and stippling of epiphyses), spine abnormalities, choanal atresia, laryngeal abnormalities, short neck, hypoplasia of distal phalanges, brachydactyly, short limbs and less frequently, abnormalities of the brain, eyes, and ears (Menger et al., 1997; Sathienkijkanchai and Wasant, 2005; Mehndiratta et al., 2010). Other manifestations in fetuses exposed to warfarin after the second or third trimester include optic atrophy, blindness, corneal opacity, deafness, microcephaly, hydrocephalus, epilepsy and mental retardation (reviewed in Sathienkijkanchai and Wasant, 2005).
Others conditions related with a deficiency of VK are known such as VK deficiency bleeding (VKDB) and VK deficiency embryopathy (Sutor et al., 1999; Shearer, 2009). VKDB is an acquired coagulopathy caused by a reduction of VK dependent coagulation factors below homeostatic levels, which is associated to intracranial hemorrhages in infants (Sutor et al., 1999; Shearer, 2009). VK deficiency embryophaty is a condition caused by a prenatal disorder in the VK metabolism, which is considered a phenocopy of WE (Menger et al., 1997). These conditions can be triggered by insufficient intake of VK, decreased gut flora, decreased VK absorption, or disruption of VK recycling
12
caused by mutations in Vkor and/or inhibited γ-carboxylation due to mutations in Ggcx enzymes (Menger et al., 1997; Greer, 2010; Takada et al., 2014). Several studies have demonstrated that mutations in Ggcx are responsible for visceral hemorrhages and a short life span (Zhu et al., 2007). Regarding to mutations in Vkor, Spohn et al., (2009) have demonstrated that homozygous Vkorc1-deficient mice developed normally until birth, but dyeing within 2-20 days after birth due to extensive, predominantly intracerebral hemorrhage resulted from a severe deficiency of γ-carboxylated clotting factors.
Although some information regarding the roles of VK and the signaling pathways controlled by Pxr at transcriptional level are known, the specific signaling pathways by which warfarin therapy during pregnancy induce WE in newborns is still not known.
1.7 Zebrafish
Animal models in biomedical research have been used to understand the mechanisms underlying vertebrate’s development and pathogenesis of human diseases. In this sense, zebrafish (Danio rerio) has emerged as an excellent animal model, taking advantage over other ones, such as rodents and other mammalian species (reviewed by Lieschke and Currie, 2007). Zebrafish is a small freshwater teleost, with external fertilization, optical clarity during embryogenesis, rapid development, high reproductive rate and short life cycle. In addition, in the last years, genomic resources have been developed, including high density genetic maps for mapping induced mutations (Lieschke and Currie, 2007). In this sense, although zebrafish has been used mainly for developmental and molecular biology studies, teleosts are also suitable models for studying vertebrate skeletogenesis for both comparative (Witten and Huysseune, 2009) and evolutionary (Sire et al., 2009) purposes. Furthermore, zebrafish is a reliable tool in toxicology research as well as in drug discovery (Lieschke and Currie, 2007).
Previous works have demonstrated the expression and activity of Ggcx and its inhibition by warfarin exposure in zebrafish (Hanumanthaiah et al., 2001) and its teratogenicity and embryonic lethality under acute warfarin exposure (Weigt et al., 2012). Fernández et al., (2014) have characterized the effects of warfarin’s long-term exposure during zebrafish exogenous feeding phase, and highlighted the two major up-stream pathways by which warfarin might affect normal development (VK-dependent protein γ-carboxylation rate and Pxr activation). More recently, Fernández et al., (2015) have
13
demonstrated that opposite VK status (induced VK deficiency by warfarin exposure and VK supplementation) was correlated with the altered expression of some of the molecular players of the VK cycle in vitro. The same authors also reported the gene expression patterns of vkors throughout larval development and in adult tissues in fish. Altogether indicate that zebrafish might be a good model to uncover the detailed mechanisms by which warfarin exposure during early development induce WE.
14
Chapter 2
15
2. Objectives
The present study aimed at describing the effects of an induced VK deficiency through warfarin exposure in skeletogenesis and unveils the affected underlying skeletogenic pathways. Previous works have described the effects of an induced VK deficiency in zebrafish early development upon warfarin exposure. However, no reports have demonstrated the effects of VK deficiency in the skeletal development. In this work the effects of this deficiency in larval performance and skeletogenesis in zebrafish larvae exposed to warfarin during two critical periods of its development (0-2.5, embryonic stage; and 2.5-5 days post fertilization (dpf), endotrophic stage) will be evaluated. Larval performance, mineralization degree of the skeleton, skull structures length and gene expression of osteogenic markers will be analyzed at specific time points.
16
Chapter 3
17
3. Materials and methods
3.1 Embryos rearing and fish maintenance
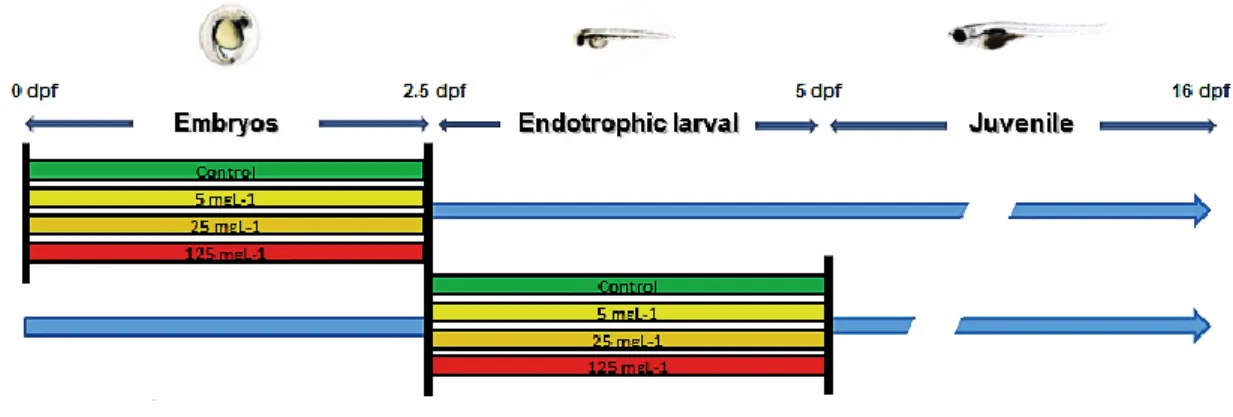
Zebrafish eggs were obtained from natural pairwise mating of wild type broodstock maintained in a ZebTec housing system (Tecniplast), being then collected and distributed in petri dishes (65-75 eggs per dish). Water parameters were maintained as follows: pH 7.6 ± 0.2; 700 mS conductivity; 7.8 mg L-1 dissolved oxygen; 14:10 hours light:dark photoperiod. In order to determine the effects of warfarin during the two key early developmental stages (embryonic and larval endogenous feeding phase), embryos or larvae were exposed to increasing concentrations of this VKA (0, 5, 25, 125 mg L-1; named as
Control, W5, W25, and W125, respectively) from 0 to 2.5 days post fertilization (dpf; embryonic development) and from 2.5 to 5 dpf (corresponding from hatching to mouth opening; endotrophic developmental stage; Fig. 3.1) in triplicate. After warfarin exposure, larvae were transferred to 500 ml tanks and raised until 16 dpf. From 4 dpf to the end of the trial zebrafish larvae were fed twice a day with newly hatched Artemia nauplii (AF strain INVE, 5-10 nauplii mL-1), and a 50% water renewal every two days was done.
Figure 3.1. Schematic representation of zebrafish exposure to warfarin. Zebrafish embryos and larvae were exposed to increased levels of warfarin: 0 (Control), 5, 25 and 125 mg L-1 during embryonic and
18
3.2 Compound exposure
Warfarin (3-(α-acetonylbenzyl)-4-hydroxycoumarin sodium salt; Sigma-Aldrich) was dissolved in distilled water. Work solutions (5, 25 and 125 mg L-1) were prepared for 30 ml of water from a stock of 10 mM.
3.3 Fish sampling
Fish from the different experimental groups were sampled at 3, 5, 7 and 16 dpf. Larvae were euthanized with a lethal dose of tricaine methanesulfonate (MS-222, Sigma-Aldrich) and washed with sterilized water. Larvae were then fixed in 1 ml of paraformaldehyde (PFA) 4% (pH 7.4), during 2h at room temperature (RT) and stored in 1ml of 100% ethanol (EtOH) until double staining procedure was performed, or in 1ml of TRIzol reagent (Qiagen) at -80 °C until RNA extraction.
3.4 Larval performance
Survival rate was calculated as the percentage of surviving fish at the end of the trial with respect to the initial number of fish minus the sampled larvae during embryonic or exogenous feeding larvae trials, respectively. Standard length of larvae, presence of hemorrhages, swimbladder inflation/development degree, pericardial aedema, yolk sac appearance and general larval morphology were evaluated under an MZ7.5 stereomicroscope (Leica Microsystems).
3.5 Skeletal development
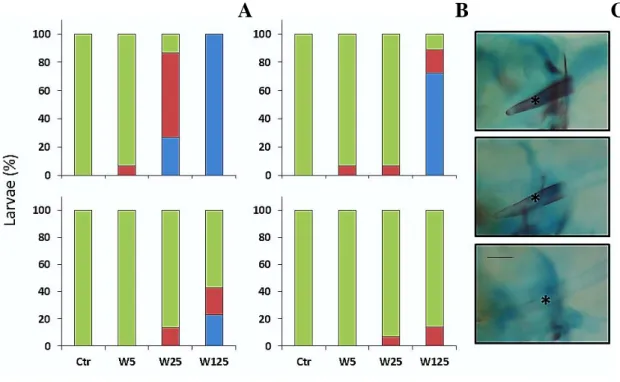
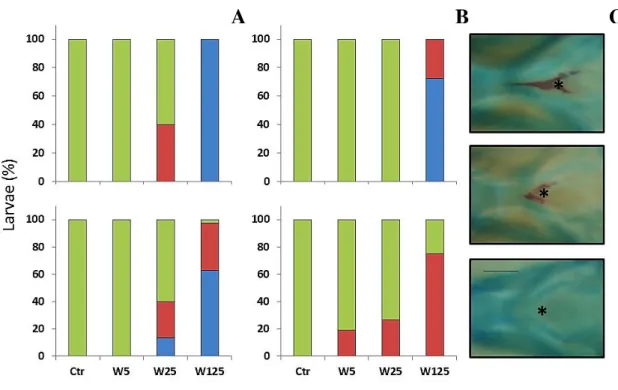
In order to analyze the particular effects of warfarin exposure on the skeletal development and incidence of skeletal deformities, a modified whole amount alcian blue-alizarin S red double staining technique for bone and cartilage staining from Walker and Kimmel (2007) at 5, 7 and 16 dpf larvae was used (described in detail below). After staining, the skeletal development (percentage of structures non-, slightly- and mineralized) of cranial (basioccipital (bop), ceratohyal arches, ceratobranchial arches, cleithrum, operculum, parasphenoid) and axial structures (weberian, precaudal, vertebrae, fin vertebrae) was
19
assessed under a MZ7.5 stereomicroscope (Leica Microsystems). Skeletal structures were named according to Bird and Mabee (2003).
3.6 Whole mount double staining procedure
A modified whole mount alcian blue-alizarin S red double staining technique was used to stain larvae from 5, 7 and 16 dpf. In brief, after larvae were fixed with PFA (4% and pH 7.4), during 2 hours at RT, they were dehydrated in EtOH through a graded series of EtOH in water (25, 50, 75 and 100% v/v), during 10-30 minutes each. For the cartilage staining of the samples, they were treated with alcian blue Solution 0.02% (Stock solution 0.4%) with 80 mM chloride magnesium (in 70% EtOH) during 10-12 hours.
For bone staining, the samples were treated with a 0.005% alizarin red S solution in water for 1 hour (Stock solution 0.5%). Subsequently, larvae were bleached during at least 1 hour with a 1.5% hydrogen peroxide (H2O2) and 1% potassium hydroxide (KOH)
solution. Finally, clearing of larvae to remove the excess of dye in soft tissues was done with 20% glycerol and 0.25% KOH solution for 4 hours, 50% glycerol and 0.25% KOH overnight (ON) at 4° C, 50% glycerol in water and 75% glycerol in water ON at 4 °C. Larvae were then stored in 100% glycerol at 4 °C. After staining, the mineralization status of the skeletal structures was evaluated.
3.7 Morphometric analysis
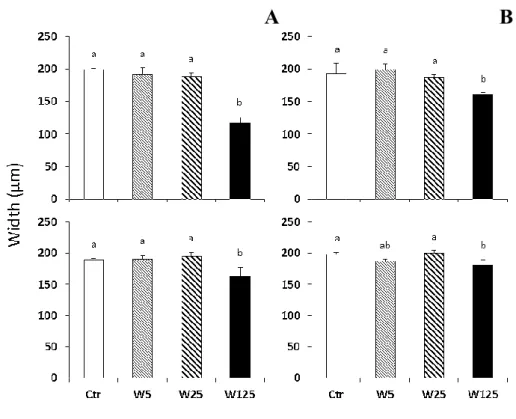
Cranial structures, such as meckel´s cartilage, ceratohyal, the first ceratobranchial arch and ethmoid plate were measured (length and width) as depicted in Figure 3.2. For this purpose, cranial structures of larvae previously double stained were manually dissected under a Stereo Discovery.V20 stereomicroscope (Zeiss) and placed in microscope slides. The structures were then photographed (AxioCam) in an Axio Imager.Z2 microscope (Zeiss) and analyzed using AxioVision image software.
20 Figure 3.2. Schematic representation of the dissected and measured cranial structures in zebrafish larvae. Structures from the lower jaw, Meckel´s cartilage (1), ceratohyal arches (2), the first ceratobranchial arch (3; A) and from the upper jaw, ethmoid plate length (4), width (5) and angle (6; B) were measured in larvae exposed to increased levels of warfarin: 0 (Control), 25 (W25) and 125 mg L-1 (W125) during embryonic and
larval stage. Scale = 100 µm.
3.8 RNA extraction
Total RNA was extracted from samples using TRIzol reagent (QIAGEN) as specified by the manufacturer. Briefly, samples were homogenized using seringes (18 and 20 G; TERUMO). The homogenate was then kept at room temperature (RT) during 5 minutes. After this step, phenol-chloroform (0.2 ml per ml of TRIzol) was added and vigorously agitated and kept at RT during 3 minutes. Samples were then centrifuged at 12000g, 4 °C during 15 minutes. At the end of this step three different phases were obtained. The upper aqueous phase (containing RNA) was passed to a new tube and subsequently isopropanol (0.5 ml per ml of TRIzol) was added. Tubes were then vortexed and incubated at RT during 10 minutes. A new centrifugation step was performed at 12000g, 4 °C during 10 minutes. The resulting supernatant was then removed and EtOH 75% was added (1 ml of 75% EtOH per ml of Trizol) to wash the pellet. A new centrifugation (7500g at 4 °C during 5 minutes) was done and EtOH 75% was removed. Diethylpyrocarbonate (DEPC) treated water (30 µL for first sampling points (3 and 5 dpf) and 100 µL for 16 dpf sampling
1 2 3 4 5 6
A
B
21
point) was added to eppendorfs and warmed (at 55 ºC) until RNA was dissolved. RNA quantification was determined measuring the optical density at 260 nm, using a Nanodrop (Thermo Scientific). Purity of RNA was established by the absorbance ratios 260/280 nm and 260/230 nm.
3.9 DNAse treatment and cDNA synthesis by Reverse Transcription (RT) reaction
The synthesis of cDNA was performed using the Moloney-murine leukemia virus (M-MLV) reverse transcriptase (200U/µL, Invitogen), according to manufacturer protocol. Briefly, RNA samples were treated with DNAse (RQ1 RNase-Free DNase; Promega). Next, the reaction was incubated for 10 minutes at 65 ºC. 500 ng of total RNA was supplemented with 1 µL oligo(dT) (500 µg/ml; Sigma-Aldrich) 1 µL dNTP’s (10 mM, Invitrogen), 4 µL of First Strand buffer (5x, Invitogen) and 1 µL of DTT (0.1 M). This mixture was incubated during 3 minutes at 60 ºC, and then cooled 5 min at 4 ºC. To the resulting reaction 1 µL RNaseOUT (40U/µ, Invitrogen) and 1 µL of M-MLV reverse transcriptase was added. The reverse transcription reaction continued for 60 minutes at 37 ºC. Finally, samples were incubated during 5 minutes at 95 ºC to inactivate the reaction enzymes and stored at -20 ºC until use.
3.10 Gene cloning
For gene expression analysis and the evaluation of the efficiency of amplification by qPCR primers a different set of specific primers were designed (see Table 3.1) taking advantage of available genomic resources (NCBI and ENSEMBL).
Gene Name Access
Number Primer Name Sequence (5’-3’) Bp size Col2a1a - ef NM_131292.1 Forward Reverse TTCACGGACTCTCCTGCTACTTGTG GCTCGCCATCTCTCCCTCTTG 458
22 Alp - ef NM_201007.2 Forward Reverse TTCCCCACGTCGCCCTCTCT ACATGCTTCTCCGCCCACCC 405 Runx2 - ef NM_212862.1 Forward Reverse GCACGGAGAGGGACTGACGG AGGGCCACCACCTTAAACGC 357 Osx - ef NM_212863.1 Forward Reverse GTTTCCCAGGACCCTTCGCT GCAATCGCAAGAAGACCTCC 498 Sox9a - ef NM_131643.1 Forward Reverse CCAGCGAACACTCAGGC TGGTGATGGAGGGAAATGAAG 483 Col2a1a - qPCR NM_131292.1 Forward Reverse CAGGAAGAGTTTGGCGGCTGT GACACGGCACGGTTCTGGTT 81 Alp - qPCR NM_201007.1 Forward Reverse TTCCTCTGCGGTGTCAAAGCCAA AAGCAGCACTCGGGGTGGCAT 184 Mgp - qPCR NM_205640 Forward Reverse TGTTGTTCTGGCTCTCGGTGCT CACCTCCGCACGCCGCTC 169 Bgp2 - qPCR NM_001291889 .1 Forward Reverse CCAACTCCGCATCAGACTCCGCATCA AGCAACACTCCGCTTCAGCAGCACAT 185 Runx2 - qPCR NM_212862 Forward Reverse CTCTCACGCAAACGGAGGACATACG TGCATTCGAGTTCACGTCGTTCATCT 138 Osx - qPCR NM_212863.1 Forward Reverse GCTAAGTCCAGGGCAGGCTCAG CAATGGCGTGAAATCAGGAGTGTAAC 115 Sox9a - qPCR NM_131643.1 Forward Reverse CGCCCACTCCTCCCACCACC GACCGTTCGGCGGGAGGTATTG 201 Grp1 - qPCR JQ003911.1 Forward Reverse CCATTCACTGCTCTCTCAACCACAA GGCGGACAAAACAAGCAGACAG 128 Rps18 - qPCR NM_173234.1 Forward Reverse AACACGAACATTGATGGAAGACG ATTAGCAAGGACCTGGCTGTATTT 255 Β-actin2 - qPCR NM_181601.4 Forward Reverse GCAGAAGGAGATCACATCCCTGGC CATTGCCGTCACCTTCACCGTTC 322
Table 3.1. Gene names, access numbers (GenBank), primers, primer sequences and expected amplicon size (bp) used to perform the evaluation of the efficiency of qPCR primers and the relative gene expression quantification in zebrafish larvae exposed to warfarin during embryonic and endotrophic stages.
23
3.10.1 Determination of primers efficiency
To determine the efficiency of the qPCR designed primers (Table 3.1), a PCR reaction was done to amplify a fragment of the genes of interest, using zebrafish cDNA as template. In the amplification process, two different temperatures of annealing were used (65 and 68 ºC). For each PCR reaction it was added 1 µL of cDNA in a mix of 2.5 µL of Dream Taq buffer 10x, 2.5 µL of dNTPs (10mM), 1.5 µL of specific primers forward and reverse (10µM), 0.2 μL of Dream Taq Polymerase and miliQ water to a final volume of 25 μL. The PCR were performed under the following conditions: an initial denaturant step at 94 ºC for 5 minutes, followed by 35 cycles: 94 ºC during 30 seconds, 65 or 68 ºC during 30 seconds and 72 ºC during 30 seconds. PCR products of the expected size were confirmed by a gel electrophoresis.
3.10.2 Purified PCR product’s ligation
In the ligation procedure the purified PCR products were inserted into pCR® II-TOPO® vector. In brief, the ligations on the pCR® II-TOPO® were performed following the manufacturer’s instructions. 4 μL of the fresh PCR products were added to 1 μL of pCR® II-TOPO® vector and 1 μL of salt solution (6 μL final volume). The reaction was then incubated for 5 minutes at RT and then placed in ice.
3.10.3 Transformation of competent bacteria
The product obtained from the reaction of the previous step was inserted into E. coli - DH5α strain. In breaf, 4 μL of the pCR® II-TOPO® ligation reaction was added to a vial of E. coli. The tubes were then placed in ice for 30 minutes. Bacteria were incubated during 30 seconds at 42 °C (heat shock) to promote the DNA uptake. Under a Bunsen burner, 250 μL of a nutritive medium (SOC) was slowly added to the tubes in order to activate/potentiate E. coli. Next, bacteria were incubated during 1 hour at 37 °C with mechanical agitation (200 rpm). 100 μL of the bacterial suspension was pipetted and spread in a pre-warmed (at 37º C) LB agar plate containing ampicillin (100 μL ml-1 LB Agar) and X-GAL (40 μL per plate). The plates were then inverted and incubated at 37 °C ON. Individual and well defined white colonies (5 colonies per plate) were selected from
24
the plates and grown in 3.5 mL of LB medium with ampicillin (100 μL ml-1 LB) at 37 °C
under constant mechanical agitation (200 rpm) ON, to promote bacterial colonies growth.
3.10.4 Screening of bacterial colonies by PCR
In order to confirm the presence of inserts of interest, a polymerase chain reaction (PCR) with the M13 primers and other with the specific primers for each gene was performed using 2 μL of the bacteria culture as DNA template. The M13 and the specific PCR primers will amplify the fragments of DNA that are inserted into the vector allowing us to confirm if the colonies are false or true positives. The primers (0.5 μL of 10 µM) were added in a mix with Dream Taq buffer 10x (2.5 μL), dNTPs (10 mM; 2.5 μL), Dream Taq Polymerase (0.2 μL) and DEPC water (17.8 μL). Finally, PCR products were analyzed by electrophoresis in an ethidium bromide (EtBr) agarose gel (1.2 – 2.0 %) in 1x TAE buffer and visualized under UV light in a High Performance UV Transluminator (UVP®).
3.10.5 Plasmid DNA extraction, purification and sequencing
Plasmid DNA extraction was performed manually. Briefly, the bacterial culture was centrifuge and the pellet was re-suspended in 100 μL of solution PI, which contains Tris-HCl (50 mM), ethylenediamine tetraacetic acid (10 mM; EDTA; prevents the activation of DNAses) and RNAse (100 µg mL-1; responsible for degradation of RNA). 100 μL of a solution PII, which contains sodium dodecyl sulfate (SDS; a detergent that lyses the cells wall and denatures cellular proteins) and sodium hydroxide (200 mM; NaOH) was added and the mixture was incubated at RT for 5 minutes. After the incubation, 100 μL of solution PIII (containing Potassium acetate (3M)) was added to promote bacterial DNA and protein precipitation, due to the potassium acetate present in this solution. The mix was incubated in ice for 10 minutes and then centrifuged for 5 minutes at 13200 rpm. Plasmid DNA was precipitated after adding 2 volumes of 100% EtOH and washing with 2 volumes of 70% EtOH and re-suspended in 30 μL DEPC water. Plasmid DNA concentration and purity was determined by the absorbance ratios 260/280 and 260/230 nm using a Nanodrop 1000 spectrophotometer (Thermo Scientific). Finally, samples were sequenced at Centre of Marine Sciences (CCMAR) sequencing facility of the with the M13 F and M13 R primers.
25
3.11 Quantitative Real-Time PCR (RT-qPCR)
To quantify the expression of genes of interest, the cDNA resulting from the RT reaction was used as a template for qPCR. qPCR was performed on a Real-Time PCR system (Bio-Rad system) using gene-specific forward and reverse primers (Table 3.1). qPCR efficiency was close to 100% for all genes. All reactions were performed in triplicates in 96-well plates containing 10 ml of SsoFast EvaGreen Supermix (Bio-Rad), 0.5 ml of forward and reverse primers (10 µM), 7 ml of molecular biology grade water (Sigma), and 2 ml of a 1:10 dilution of cDNA template. Amplification parameters were as follows: 95°C for 1 min, followed by 40 amplification cycles at 95°C for 5 seconds and 65 °C for 10 seconds. A final dissociation reaction (melting curve) was performed with the following steps: 95 ºC for 15 seconds, 70 ºC for 1 minutes, and 15 seconds at incremental temperatures of 0.5 ºC until 95 ºC. A calibrator sample was included in each qPCR plate (Derveaux et al., 2010). Relative gene expression was determined according to Pfaffl et al. (2001) using cDNA from control larvae groups of both trials as reference samples, and set to one.
The suitability of 2 housekeeping genes (β-actin2 and rps18) was evaluated using NormFinder (Andersen et al. 2004) and BestKeeper (Pfaffl et al. 2004) algorithms. Rps18 was selected as the best housekeeping gene.
3.12 Statistical analyses
Results are given as mean ± standard deviation. Differences among all experimental groups within each trial were identified by one-way ANOVA and T-test. Correlation between variables was evaluated using Pearson Product Moment Correlation test. When significant differences were detected in one-way ANOVA, Tukey multiple-comparison test was used to determine differences among experimental groups. In all cases, differences were considered to be significant when P< 0.05. All statistical analyses were done using GraphPad Prism 5.0 (GraphPad Software, Inc.).
26
Chapter 4
27
4. Results
4.1 Survival rate and larval performance
Warfarin exposure during embryonic and endotrophic stages has promoted a wide range of effects in zebrafish larvae. Survival of the larvae exposed to increased levels of warfarin was clearly affected. Mortality of larvae exposed to gradual concentrations of warfarin increased overtime (Fig. 4.1A). However, while exposure during the embryonic stage (0-2.5 dpf) promoted a gradual increase in mortality when exposed to the highest concentration of warfarin (W125, 125 mg L-1), and significantly higher from 4 dpf onwards (32.53 ± 7.09 %; one-way ANOVA, P < 0.05) when compared with the other groups (from 13.9 ± 2.55 to19.67 ± 1.70 %); exposure to warfarin during the endotrophic stage (2.5-5 dpf) showed quite low mortality until the 7 dpf. From 9 dpf onward, exposure to 125 mg L-1 induced a significant increase in mortality (15.65 ± 8.22 %; one-way
ANOVA, P < 0.05) when compared with Control and lower concentrations (5 and 25 mg L-1) of warfarin (from 1.67 ± 2.89 to 3.17 ± 1.4 %). The above mentioned mortality related with the exposure (concentration and developmental stage) to warfarin has been translated into a statistically different endpoint survival among experimental groups (Fig. 4.1B; one-way ANOVA, P < 0.05). Exposure to warfarin during the embryonic stage leads to a lower survival when treated with 125 mg L-1 (27.72 ± 5.75 %); while during the endotrophic stage (same concentration) showed a slighter effect on survival (61.29 ± 13.06 %).